
Hi Team,
Today, I’ll be explaining the enhancement of one of the previous posts. I know that I’ve shared the fascinating API named prophet-API, which Facebook developed. One can quickly get more accurate predictions with significantly fewer data points. (If you want to know more about that post, please click on the following link.)
However, there is another enhancement on top of that API, which is more accurate. However, one needs to know – when they should consider using it. So, today, we’ll be talking about the neural prophet API.
But, before we start digging deep, why don’t we view the demo first?
Let’s visit a diagram. That way, you can understand where you can use it. Also, I’ll be sharing some of the links from the original site for better information mining.
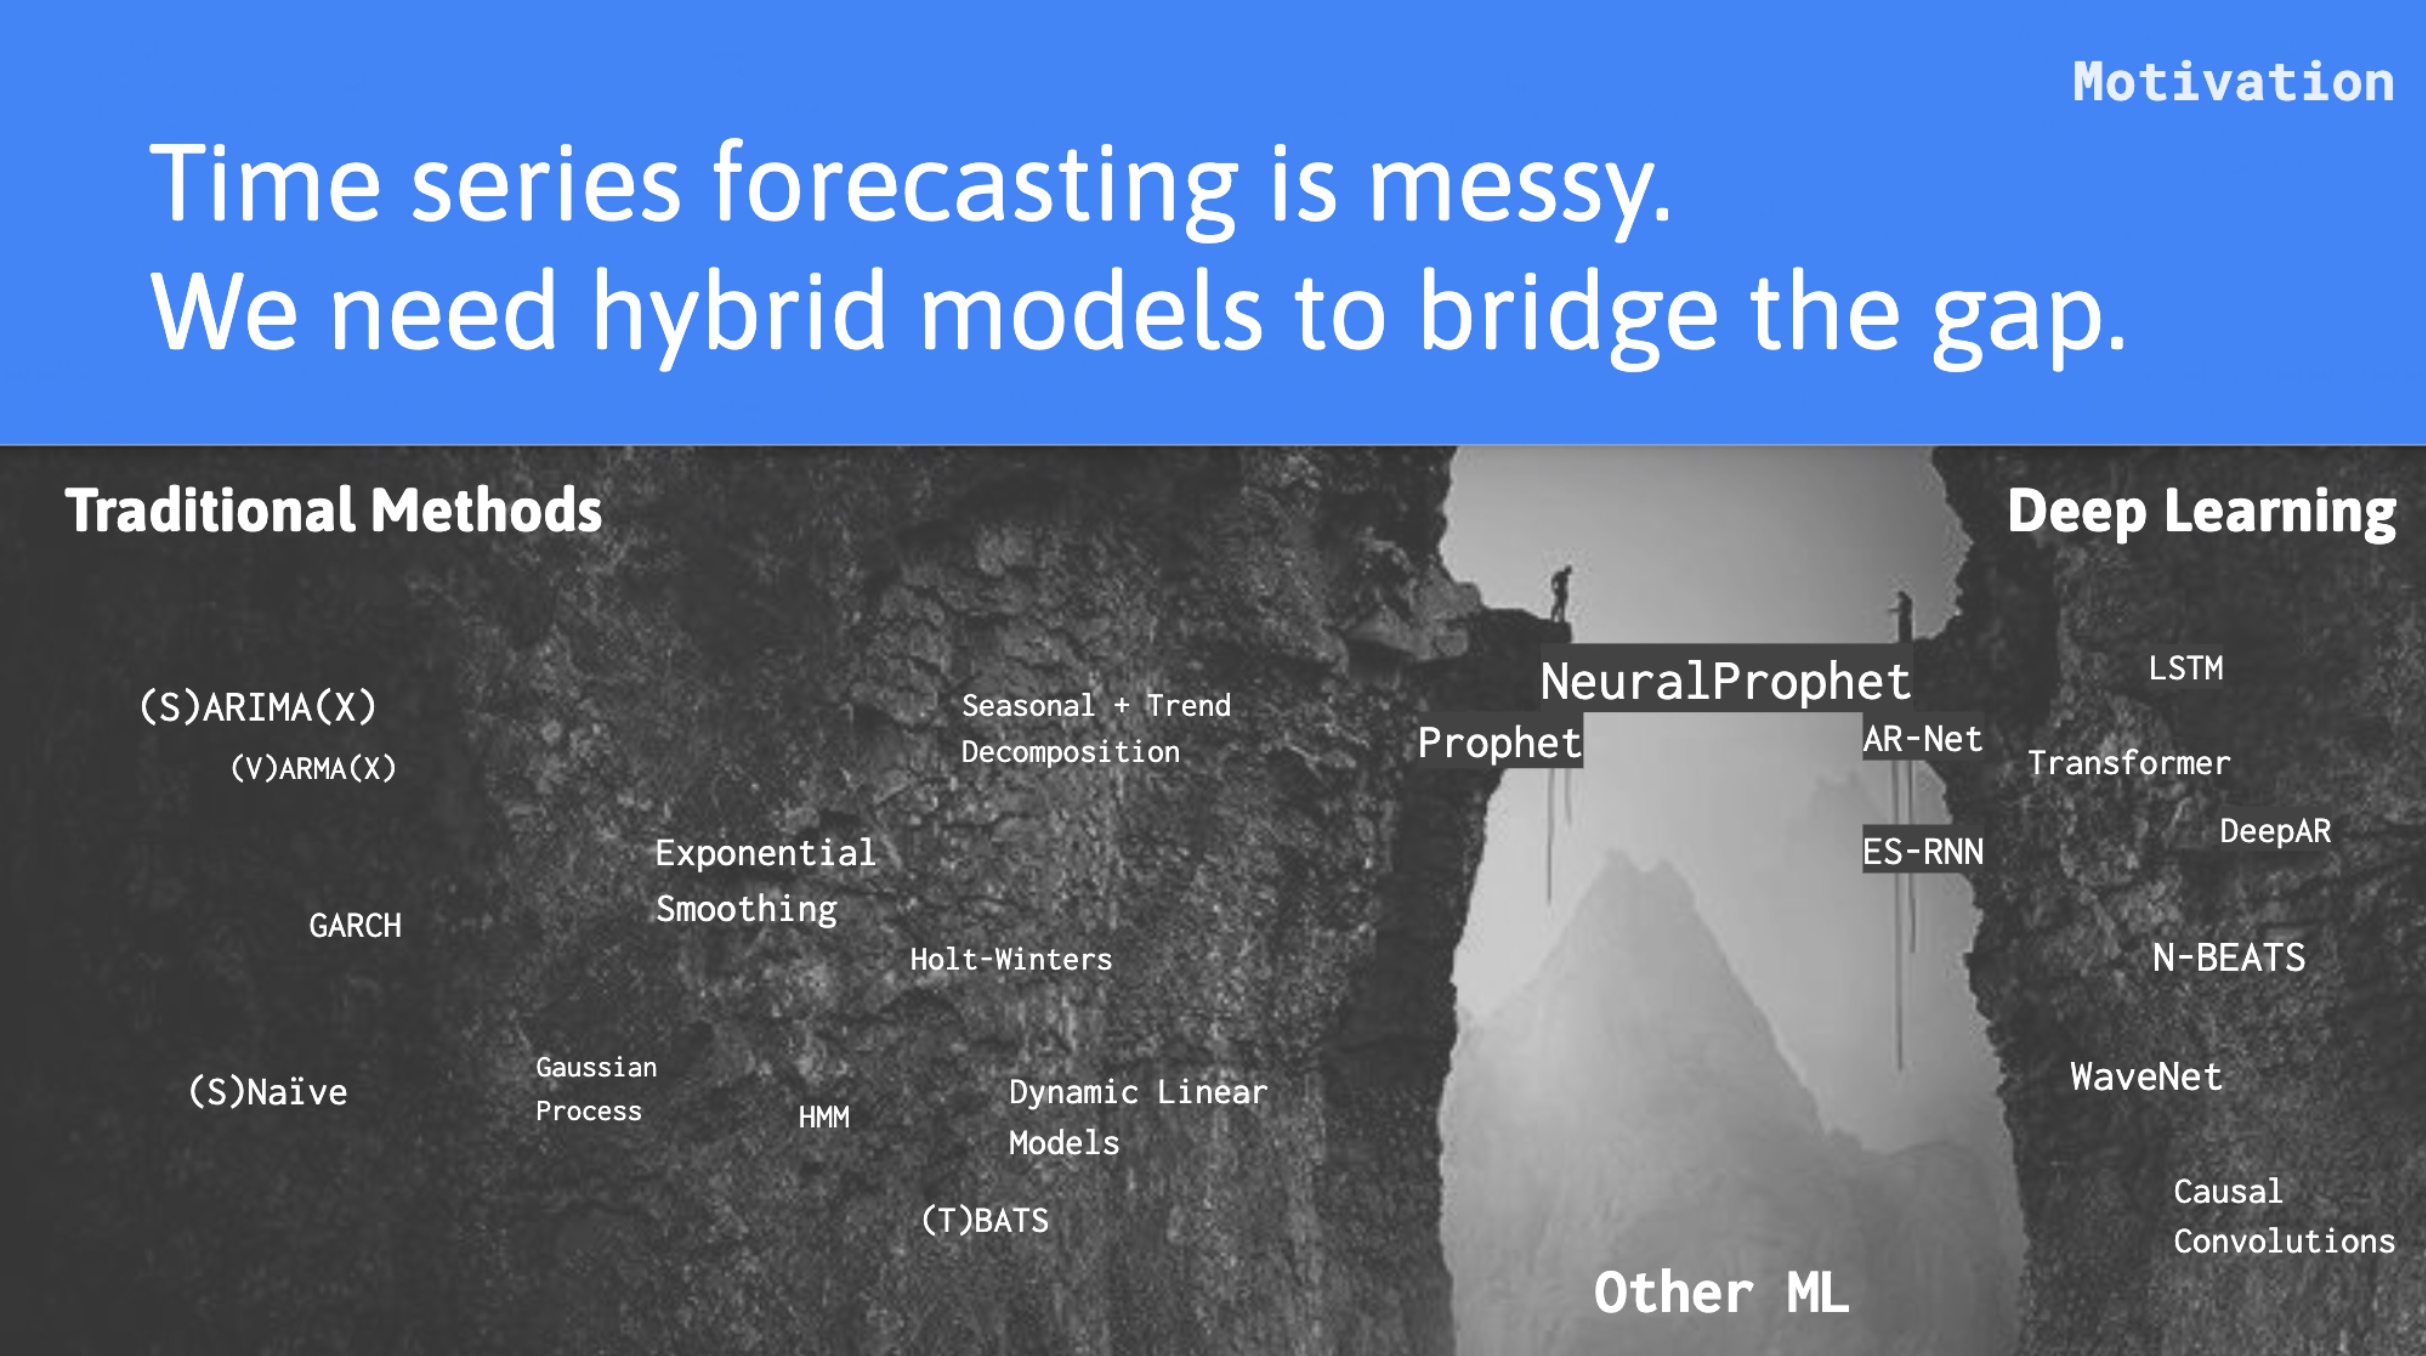
As one can see, this API is trying to bridge between the different groups & it enables the time-series computation efficiently.
WHERE TO USE:
Let’s visit another diagram from the same source.
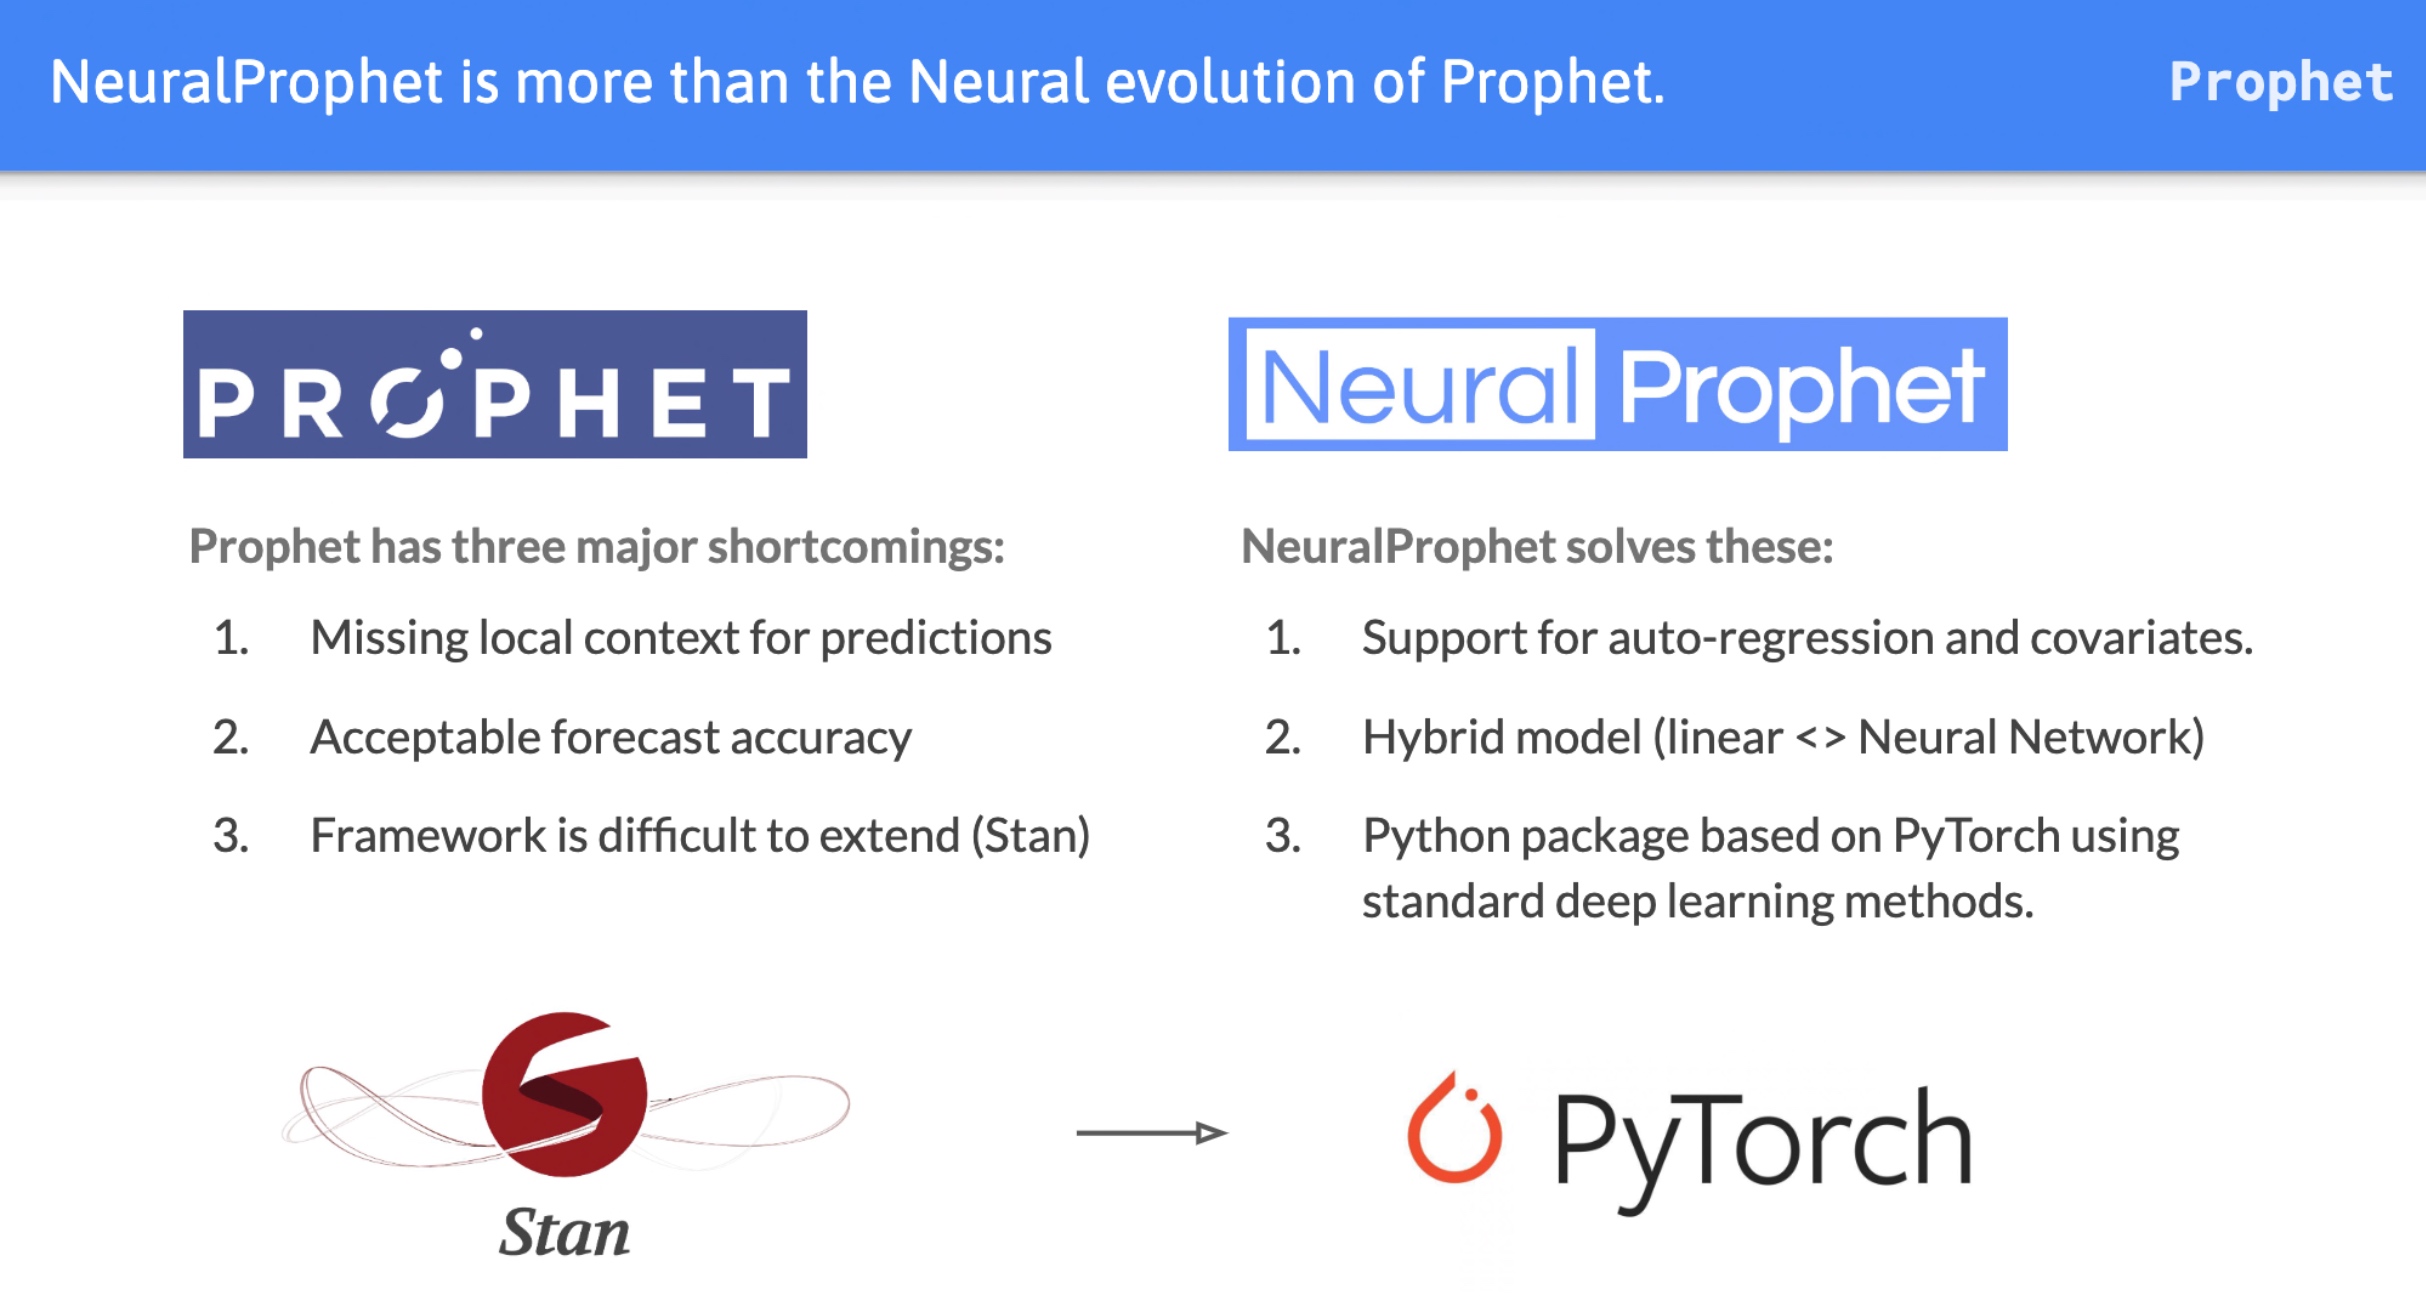
So, I hope these two pictures give you a clear picture & relatively set your expectations to more ground reality.
ARCHITECTURE:
Let us explore the architecture –

As one can see, the application is processing IoT data & creating a historical data volume, out of which the model is gradually predicting correct outcomes with higher confidence.
For more information on this API, please visit the following link.
CODE:
Let’s explore the essential scripts here.
- clsConfig.py (Configuration file for the entire application.)
This file contains hidden or bidirectional Unicode text that may be interpreted or compiled differently than what appears below. To review, open the file in an editor that reveals hidden Unicode characters.
Learn more about bidirectional Unicode characters
| ################################################ | |
| #### Written By: SATYAKI DE #### | |
| #### Written On: 15-May-2020 #### | |
| #### Modified On: 28-Dec-2021 #### | |
| #### #### | |
| #### Objective: This script is a config #### | |
| #### file, contains all the keys for #### | |
| #### Machine-Learning & streaming dashboard.#### | |
| #### #### | |
| ################################################ | |
| import os | |
| import platform as pl | |
| import pandas as p | |
| class clsConfig(object): | |
| Curr_Path = os.path.dirname(os.path.realpath(__file__)) | |
| os_det = pl.system() | |
| if os_det == "Windows": | |
| sep = '\\' | |
| else: | |
| sep = '/' | |
| conf = { | |
| 'APP_ID': 1, | |
| 'ARCH_DIR': Curr_Path + sep + 'arch' + sep, | |
| 'PROFILE_PATH': Curr_Path + sep + 'profile' + sep, | |
| 'LOG_PATH': Curr_Path + sep + 'log' + sep, | |
| 'REPORT_PATH': Curr_Path + sep + 'report', | |
| 'FILE_NAME': Curr_Path + sep + 'Data' + sep + 'thermostatIoT.csv', | |
| 'SRC_PATH': Curr_Path + sep + 'data' + sep, | |
| 'APP_DESC_1': 'Old Video Enhancement!', | |
| 'DEBUG_IND': 'N', | |
| 'INIT_PATH': Curr_Path, | |
| 'SUBDIR': 'data', | |
| 'SEP': sep, | |
| 'testRatio':0.2, | |
| 'valRatio':0.2, | |
| 'epochsVal':8, | |
| 'sleepTime':3, | |
| 'sleepTime1':6, | |
| 'factorVal':0.2, | |
| 'learningRateVal':0.001, | |
| 'event1': { | |
| 'event': 'SummerEnd', | |
| 'ds': p.to_datetime([ | |
| '2010-04-01', '2011-04-01', '2012-04-01', | |
| '2013-04-01', '2014-04-01', '2015-04-01', | |
| '2016-04-01', '2017-04-01', '2018-04-01', | |
| '2019-04-01', '2020-04-01', '2021-04-01', | |
| ]),}, | |
| 'event2': { | |
| 'event': 'LongWeekend', | |
| 'ds': p.to_datetime([ | |
| '2010-12-01', '2011-12-01', '2012-12-01', | |
| '2013-12-01', '2014-12-01', '2015-12-01', | |
| '2016-12-01', '2017-12-01', '2018-12-01', | |
| '2019-12-01', '2020-12-01', '2021-12-01', | |
| ]),} | |
| } |
The only key snippet would be passing a nested json element with pandas dataframe in the following lines –
'event1': {
    'event': 'SummerEnd',
    'ds': p.to_datetime([
        '2010-04-01', '2011-04-01', '2012-04-01',
        '2013-04-01', '2014-04-01', '2015-04-01',
        '2016-04-01', '2017-04-01', '2018-04-01',
        '2019-04-01', '2020-04-01', '2021-04-01',
    ]),},
'event2': {
    'event': 'LongWeekend',
    'ds': p.to_datetime([
        '2010-12-01', '2011-12-01', '2012-12-01',
        '2013-12-01', '2014-12-01', '2015-12-01',
        '2016-12-01', '2017-12-01', '2018-12-01',
        '2019-12-01', '2020-12-01', '2021-12-01',
    ]),}
As one can see, our application is equipped with the events to predict our use case better.
2. clsPredictIonIoT.py (Main class file, which will invoke neural-prophet forecast for the entire application.)
This file contains hidden or bidirectional Unicode text that may be interpreted or compiled differently than what appears below. To review, open the file in an editor that reveals hidden Unicode characters.
Learn more about bidirectional Unicode characters
| ################################################ | |
| #### Written By: SATYAKI DE #### | |
| #### Written On: 19-Feb-2022 #### | |
| #### Modified On 21-Feb-2022 #### | |
| #### #### | |
| #### Objective: This python script will #### | |
| #### perform the neural-prophet forecast #### | |
| #### based on the historical input received #### | |
| #### from IoT device. #### | |
| ################################################ | |
| # We keep the setup code in a different class as shown below. | |
| from clsConfig import clsConfig as cf | |
| import psutil | |
| import os | |
| import pandas as p | |
| import json | |
| import datetime | |
| from neuralprophet import NeuralProphet, set_log_level | |
| from neuralprophet import set_random_seed | |
| from neuralprophet.benchmark import Dataset, NeuralProphetModel, SimpleExperiment, CrossValidationExperiment | |
| import time | |
| import clsL as cl | |
| import matplotlib.pyplot as plt | |
| ############################################### | |
| ### Global Section ### | |
| ############################################### | |
| # Initiating Log class | |
| l = cl.clsL() | |
| set_random_seed(10) | |
| set_log_level("ERROR", "INFO") | |
| ############################################### | |
| ### End of Global Section ### | |
| ############################################### | |
| class clsPredictIonIoT: | |
| def __init__(self): | |
| self.sleepTime = int(cf.conf['sleepTime']) | |
| self.event1 = cf.conf['event1'] | |
| self.event2 = cf.conf['event2'] | |
| def forecastSeries(self, inputDf): | |
| try: | |
| sleepTime = self.sleepTime | |
| event1 = self.event1 | |
| event2 = self.event2 | |
| df = inputDf | |
| print('IoTData: ') | |
| print(df) | |
| ## user specified events | |
| # history events | |
| SummerEnd = p.DataFrame(event1) | |
| LongWeekend = p.DataFrame(event2) | |
| dfEvents = p.concat((SummerEnd, LongWeekend)) | |
| # NeuralProphet Object | |
| # Adding events | |
| m = NeuralProphet(loss_func="MSE") | |
| # set the model to expect these events | |
| m = m.add_events(["SummerEnd", "LongWeekend"]) | |
| # create the data df with events | |
| historyDf = m.create_df_with_events(df, dfEvents) | |
| # fit the model | |
| metrics = m.fit(historyDf, freq="D") | |
| # forecast with events known ahead | |
| futureDf = m.make_future_dataframe(df=historyDf, events_df=dfEvents, periods=365, n_historic_predictions=len(df)) | |
| forecastDf = m.predict(df=futureDf) | |
| events = forecastDf[(forecastDf['event_SummerEnd'].abs() + forecastDf['event_LongWeekend'].abs()) > 0] | |
| events.tail() | |
| ## plotting forecasts | |
| fig = m.plot(forecastDf) | |
| ## plotting components | |
| figComp = m.plot_components(forecastDf) | |
| ## plotting parameters | |
| figParam = m.plot_parameters() | |
| ################################# | |
| #### Train & Test Evaluation #### | |
| ################################# | |
| m = NeuralProphet(seasonality_mode= "multiplicative", learning_rate = 0.1) | |
| dfTrain, dfTest = m.split_df(df=df, freq="MS", valid_p=0.2) | |
| metricsTrain = m.fit(df=dfTrain, freq="MS") | |
| metricsTest = m.test(df=dfTest) | |
| print('metricsTest:: ') | |
| print(metricsTest) | |
| # Predict Into Future | |
| metricsTrain2 = m.fit(df=df, freq="MS") | |
| futureDf = m.make_future_dataframe(df, periods=24, n_historic_predictions=48) | |
| forecastDf = m.predict(futureDf) | |
| fig = m.plot(forecastDf) | |
| # Visualize training | |
| m = NeuralProphet(seasonality_mode="multiplicative", learning_rate=0.1) | |
| dfTrain, dfTest = m.split_df(df=df, freq="MS", valid_p=0.2) | |
| metrics = m.fit(df=dfTrain, freq="MS", validation_df=dfTest, plot_live_loss=True) | |
| print('Tail of Metrics: ') | |
| print(metrics.tail(1)) | |
| ###################################### | |
| #### Time-series Cross-Validation #### | |
| ###################################### | |
| METRICS = ['SmoothL1Loss', 'MAE', 'RMSE'] | |
| params = {"seasonality_mode": "multiplicative", "learning_rate": 0.1} | |
| folds = NeuralProphet(**params).crossvalidation_split_df(df, freq="MS", k=5, fold_pct=0.20, fold_overlap_pct=0.5) | |
| metricsTrain = p.DataFrame(columns=METRICS) | |
| metricsTest = p.DataFrame(columns=METRICS) | |
| for dfTrain, dfTest in folds: | |
| m = NeuralProphet(**params) | |
| train = m.fit(df=dfTrain, freq="MS") | |
| test = m.test(df=dfTest) | |
| metricsTrain = metricsTrain.append(train[METRICS].iloc[-1]) | |
| metricsTest = metricsTest.append(test[METRICS].iloc[-1]) | |
| print('Stats: ') | |
| dfStats = metricsTest.describe().loc[["mean", "std", "min", "max"]] | |
| print(dfStats) | |
| #################################### | |
| #### Using Benchmark Framework #### | |
| #################################### | |
| print('Starting extracting result set for Benchmark:') | |
| ts = Dataset(df = df, name = "thermoStatsCPUUsage", freq = "MS") | |
| params = {"seasonality_mode": "multiplicative"} | |
| exp = SimpleExperiment( | |
| model_class=NeuralProphetModel, | |
| params=params, | |
| data=ts, | |
| metrics=["MASE", "RMSE"], | |
| test_percentage=25, | |
| ) | |
| resultTrain, resultTest = exp.run() | |
| print('Test result for Benchmark:: ') | |
| print(resultTest) | |
| print('Finished extracting result test for Benchmark!') | |
| #################################### | |
| #### Cross Validate Experiment #### | |
| #################################### | |
| print('Starting extracting result set for Corss-Validation:') | |
| ts = Dataset(df = df, name = "thermoStatsCPUUsage", freq = "MS") | |
| params = {"seasonality_mode": "multiplicative"} | |
| exp_cv = CrossValidationExperiment( | |
| model_class=NeuralProphetModel, | |
| params=params, | |
| data=ts, | |
| metrics=["MASE", "RMSE"], | |
| test_percentage=10, | |
| num_folds=3, | |
| fold_overlap_pct=0, | |
| ) | |
| resultTrain, resultTest = exp_cv.run() | |
| print('resultTest for Cross Validation:: ') | |
| print(resultTest) | |
| print('Finished extracting result test for Corss-Validation!') | |
| ###################################################### | |
| #### 3-Phase Train, Test & Validation Experiment #### | |
| ###################################################### | |
| print('Starting 3-phase Train, Test & Validation Experiment!') | |
| m = NeuralProphet(seasonality_mode= "multiplicative", learning_rate = 0.1) | |
| # create a test holdout set: | |
| dfTrainVal, dfTest = m.split_df(df=df, freq="MS", valid_p=0.2) | |
| # create a validation holdout set: | |
| dfTrain, dfVal = m.split_df(df=dfTrainVal, freq="MS", valid_p=0.2) | |
| # fit a model on training data and evaluate on validation set. | |
| metricsTrain1 = m.fit(df=dfTrain, freq="MS") | |
| metrics_val = m.test(df=dfVal) | |
| # refit model on training and validation data and evaluate on test set. | |
| metricsTrain2 = m.fit(df=dfTrainVal, freq="MS") | |
| metricsTest = m.test(df=dfTest) | |
| metricsTrain1["split"] = "train1" | |
| metricsTrain2["split"] = "train2" | |
| metrics_val["split"] = "validate" | |
| metricsTest["split"] = "test" | |
| metrics_stat = metricsTrain1.tail(1).append([metricsTrain2.tail(1), metrics_val, metricsTest]).drop(columns=['RegLoss']) | |
| print('Metrics Stat:: ') | |
| print(metrics_stat) | |
| # Train, Cross-Validate and Cross-Test evaluation | |
| METRICS = ['SmoothL1Loss', 'MAE', 'RMSE'] | |
| params = {"seasonality_mode": "multiplicative", "learning_rate": 0.1} | |
| crossVal, crossTest = NeuralProphet(**params).double_crossvalidation_split_df(df, freq="MS", k=5, valid_pct=0.10, test_pct=0.10) | |
| metricsTrain1 = p.DataFrame(columns=METRICS) | |
| metrics_val = p.DataFrame(columns=METRICS) | |
| for dfTrain1, dfVal in crossVal: | |
| m = NeuralProphet(**params) | |
| train1 = m.fit(df=dfTrain, freq="MS") | |
| val = m.test(df=dfVal) | |
| metricsTrain1 = metricsTrain1.append(train1[METRICS].iloc[-1]) | |
| metrics_val = metrics_val.append(val[METRICS].iloc[-1]) | |
| metricsTrain2 = p.DataFrame(columns=METRICS) | |
| metricsTest = p.DataFrame(columns=METRICS) | |
| for dfTrain2, dfTest in crossTest: | |
| m = NeuralProphet(**params) | |
| train2 = m.fit(df=dfTrain2, freq="MS") | |
| test = m.test(df=dfTest) | |
| metricsTrain2 = metricsTrain2.append(train2[METRICS].iloc[-1]) | |
| metricsTest = metricsTest.append(test[METRICS].iloc[-1]) | |
| mtrain2 = metricsTrain2.describe().loc[["mean", "std"]] | |
| print('Train 2 Stats:: ') | |
| print(mtrain2) | |
| mval = metrics_val.describe().loc[["mean", "std"]] | |
| print('Validation Stats:: ') | |
| print(mval) | |
| mtest = metricsTest.describe().loc[["mean", "std"]] | |
| print('Test Stats:: ') | |
| print(mtest) | |
| return 0 | |
| except Exception as e: | |
| x = str(e) | |
| print('Error: ', x) | |
| return 1 |
Some of the key snippets that I will discuss here are as follows –
## user specified events
# history events
SummerEnd = p.DataFrame(event1)
LongWeekend = p.DataFrame(event2)

dfEvents = p.concat((SummerEnd, LongWeekend))

# NeuralProphet Object
# Adding events
m = NeuralProphet(loss_func="MSE")

# set the model to expect these events
m = m.add_events(["SummerEnd", "LongWeekend"])

# create the data df with events
historyDf = m.create_df_with_events(df, dfEvents)
Creating & adding events into your model will allow it to predict based on the milestones.
# fit the model
metrics = m.fit(historyDf, freq="D")

# forecast with events known ahead
futureDf = m.make_future_dataframe(df=historyDf, events_df=dfEvents, periods=365, n_historic_predictions=len(df))
forecastDf = m.predict(df=futureDf)

events = forecastDf[(forecastDf['event_SummerEnd'].abs() + forecastDf['event_LongWeekend'].abs()) > 0]
events.tail()

## plotting forecasts
fig = m.plot(forecastDf)

## plotting components
figComp = m.plot_components(forecastDf)

## plotting parameters
figParam = m.plot_parameters()
Based on the daily/monthly collected data, our algorithm tries to plot the data points & predict a future trend, which will look like this –

From the above diagram, we can conclude that the CPU’s trend has been growing day by day since the beginning. However, there are some events when we can see a momentary drop in requirements due to the climate & holidays. During those times, either people are not using them or are not at home.
Apart from that, I’ve demonstrated the use of a benchwork framework, & splitting the data into Train, Test & Validation & captured the RMSE values. I would request you to go through that & post any questions if you have any.
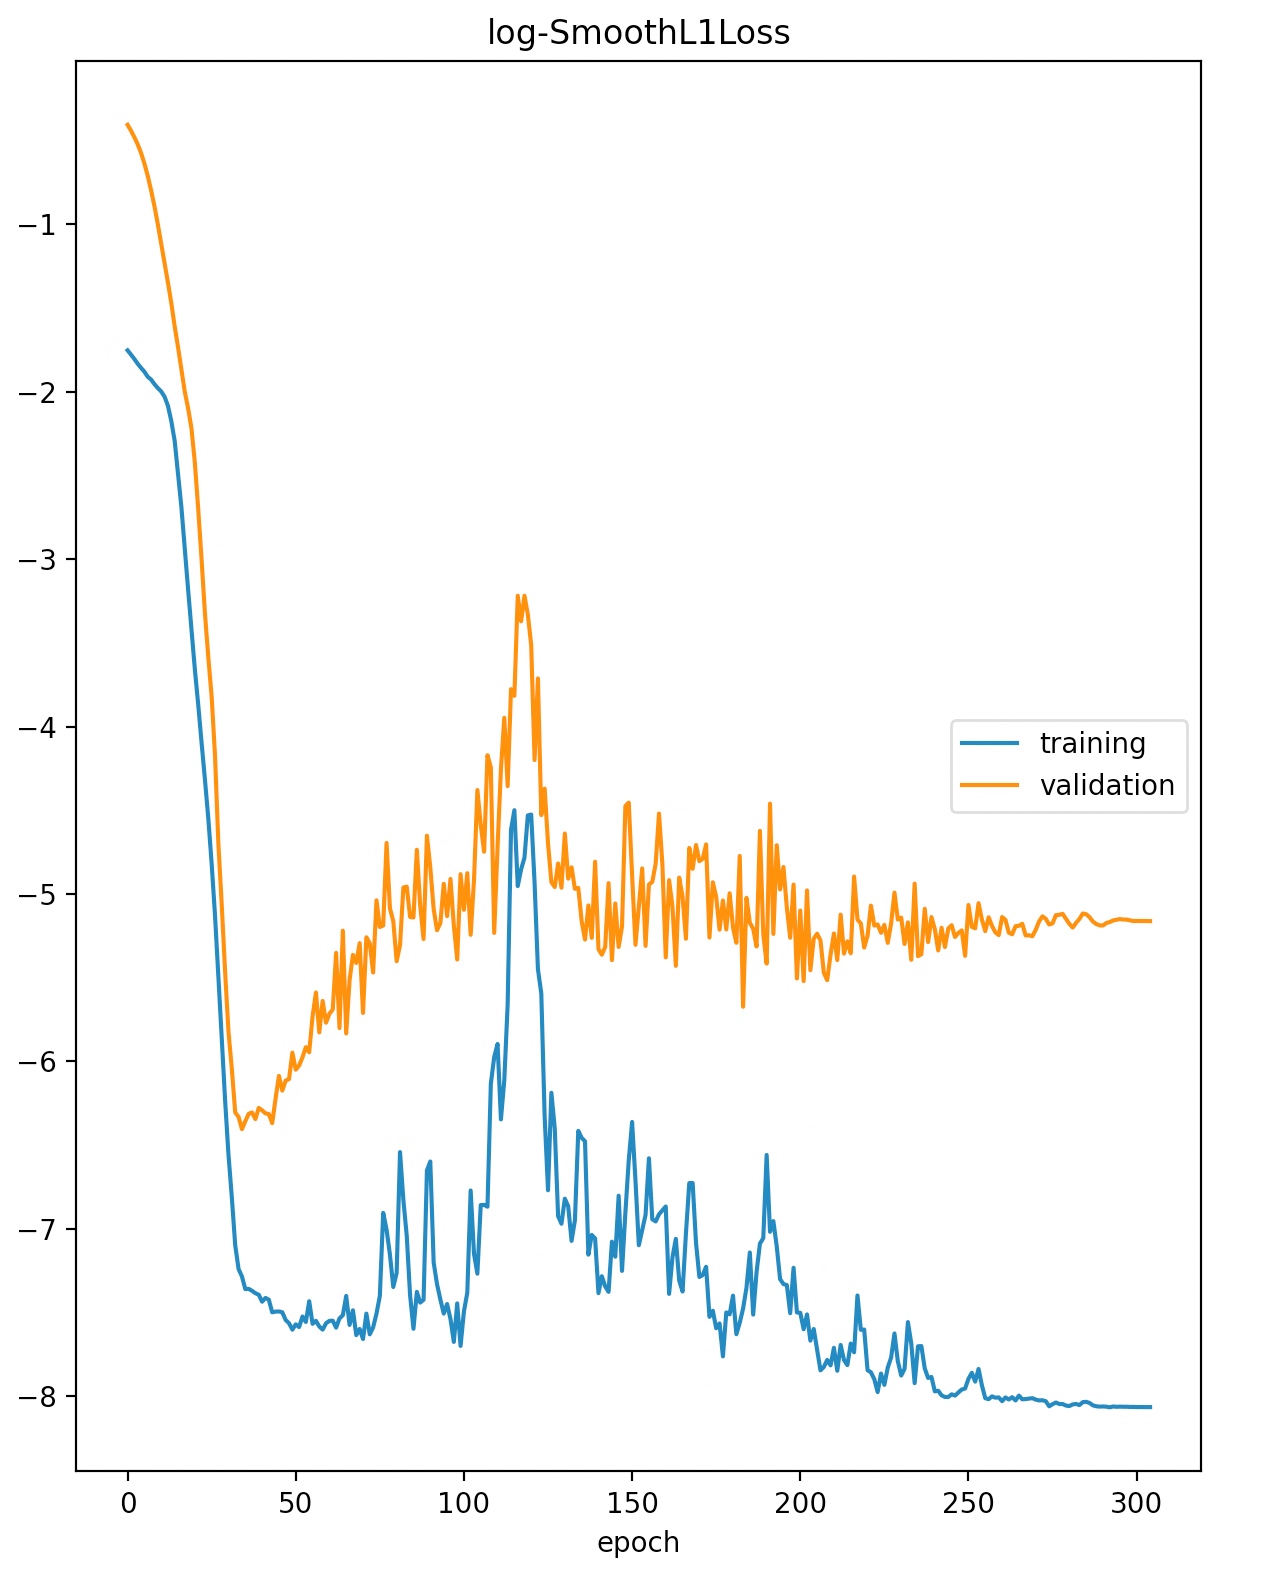
You can witness the train & validation datasets & visualize them in the standard manner, which will look something like –
3. readingIoT.py (Main invoking script.)
This file contains hidden or bidirectional Unicode text that may be interpreted or compiled differently than what appears below. To review, open the file in an editor that reveals hidden Unicode characters.
Learn more about bidirectional Unicode characters
| ############################################### | |
| #### Written By: SATYAKI DE #### | |
| #### Written On: 21-Feb-2022 #### | |
| #### Modified On 21-Feb-2022 #### | |
| #### #### | |
| #### Objective: This python script will #### | |
| #### invoke the main class to use the #### | |
| #### stored historical IoT data stored & #### | |
| #### then transform, cleanse, predict & #### | |
| #### analyze the data points into more #### | |
| #### meaningful decision-making insights. #### | |
| ############################################### | |
| # We keep the setup code in a different class as shown below. | |
| from clsConfig import clsConfig as cf | |
| import datetime | |
| import logging | |
| import pandas as p | |
| import clsPredictIonIoT as cpt | |
| ############################################### | |
| ### Global Section ### | |
| ############################################### | |
| sep = str(cf.conf['SEP']) | |
| Curr_Path = str(cf.conf['INIT_PATH']) | |
| fileName = str(cf.conf['FILE_NAME']) | |
| ############################################### | |
| ### End of Global Section ### | |
| ############################################### | |
| def main(): | |
| try: | |
| # Other useful variables | |
| debugInd = 'Y' | |
| var = datetime.datetime.now().strftime("%Y-%m-%d_%H-%M-%S") | |
| var1 = datetime.datetime.now() | |
| # Initiating Prediction class | |
| x1 = cpt.clsPredictIonIoT() | |
| print('Start Time: ', str(var)) | |
| # End of useful variables | |
| # Initiating Log Class | |
| general_log_path = str(cf.conf['LOG_PATH']) | |
| # Enabling Logging Info | |
| logging.basicConfig(filename=general_log_path + 'IoT_NeuralProphet.log', level=logging.INFO) | |
| # Reading the source IoT data | |
| iotData = p.read_csv(fileName) | |
| df = iotData.rename(columns={'MonthlyDate': 'ds', 'AvgIoTCPUUsage': 'y'})[['ds', 'y']] | |
| r1 = x1.forecastSeries(df) | |
| if (r1 == 0): | |
| print('Successfully IoT forecast predicted!') | |
| else: | |
| print('Failed to predict IoT forecast!') | |
| var2 = datetime.datetime.now() | |
| c = var2 – var1 | |
| minutes = c.total_seconds() / 60 | |
| print('Total Run Time in minutes: ', str(minutes)) | |
| print('End Time: ', str(var1)) | |
| except Exception as e: | |
| x = str(e) | |
| print('Error: ', x) | |
| if __name__ == "__main__": | |
| main() |
Here are some of the key snippets –
# Reading the source IoT data
iotData = p.read_csv(fileName)
df = iotData.rename(columns={'MonthlyDate': 'ds', 'AvgIoTCPUUsage': 'y'})[['ds', 'y']]

r1 = x1.forecastSeries(df)

if (r1 == 0):
    print('Successfully IoT forecast predicted!')
else:
    print('Failed to predict IoT forecast!')

var2 = datetime.datetime.now()
In those above lines, the main calling application is invoking the neural-forecasting class & passing the pandas dataframe containing IoT’s historical data to train its model.
For your information, here is the outcome of the run, when you invoke the main calling script –

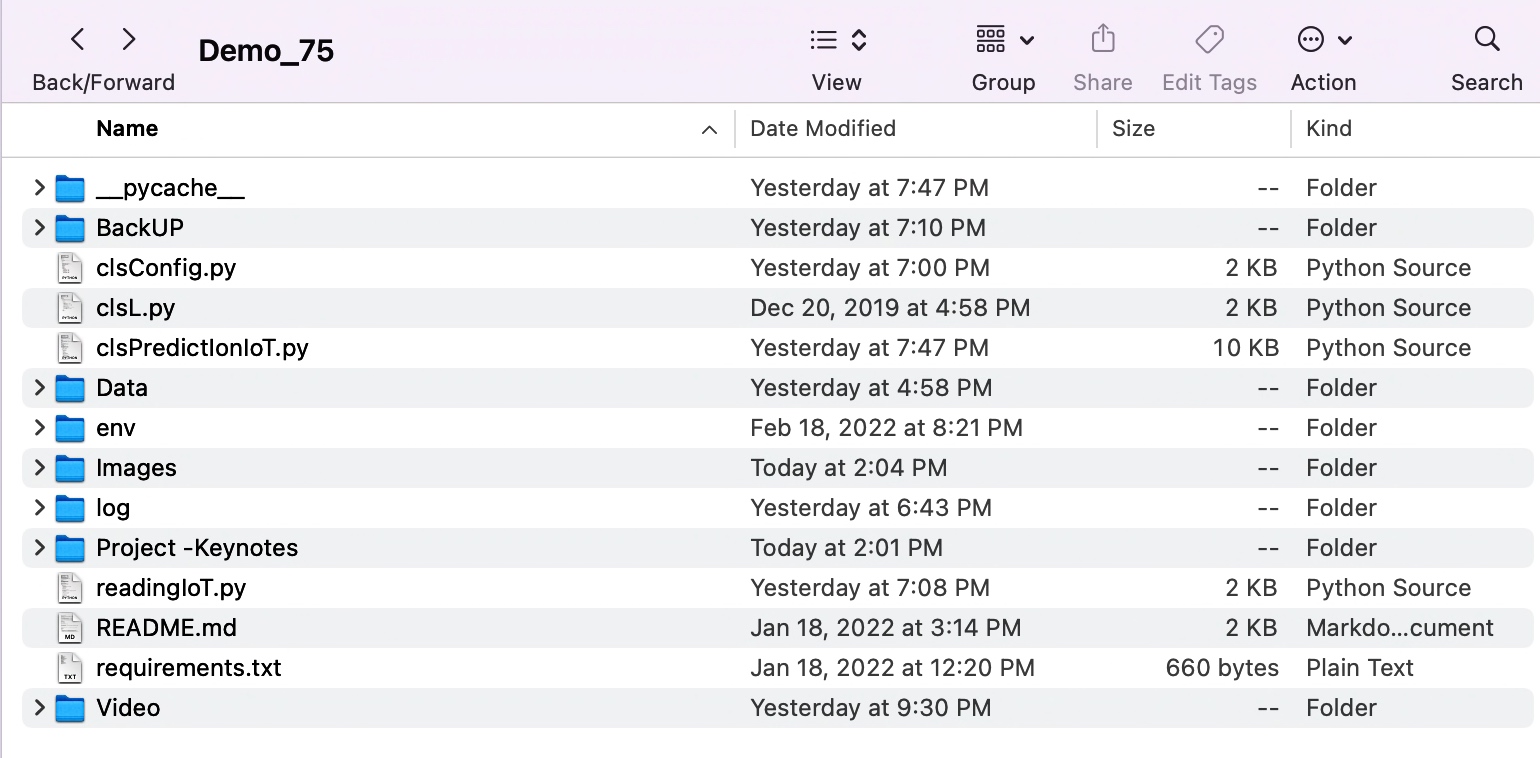
FOLDER STRUCTURE:
Please find the folder structure as shown –
So, we’ve done it.
You will get the complete codebase in the following Github link.
I’ll bring some more exciting topic in the coming days from the Python verse. Please share & subscribe my post & let me know your feedback.
Till then, Happy Avenging! 😀
Note: All the data & scenario posted here are representational data & scenarios & available over the internet & for educational purpose only. Some of the images (except my photo) that we’ve used are available over the net. We don’t claim the ownership of these images. There is an always room for improvement & especially the prediction quality.
You must be logged in to post a comment.