Realtime reading from a Streaming using Computer Vision

This week we’re going to extend one of our earlier posts & trying to read an entire text from streaming using computer vision. If you want to view the previous post, please click the following link.

But, before we proceed, why don’t we view the demo first?
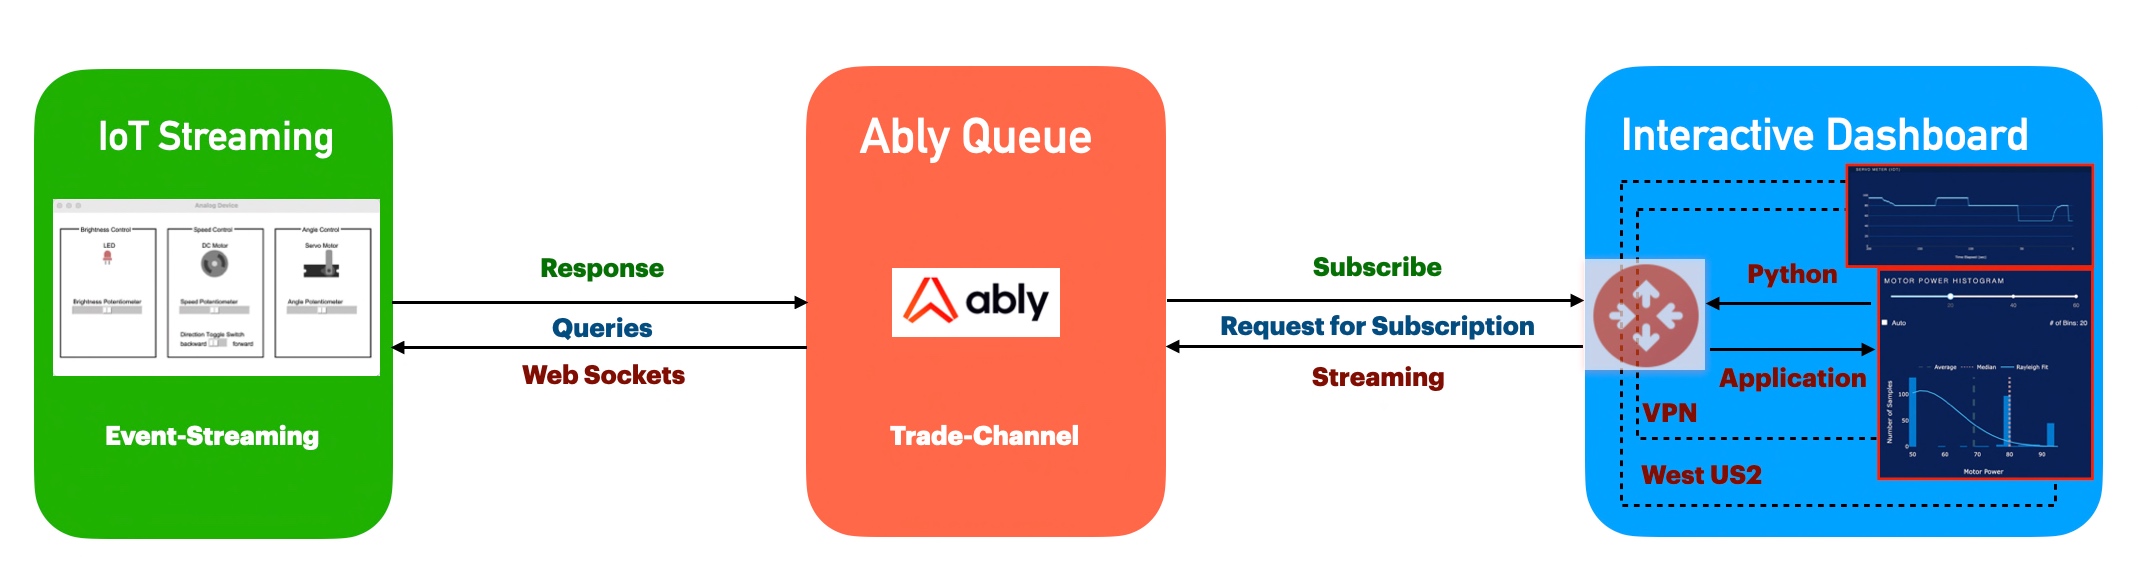
Demo

Architecture:

Let us understand the architecture flow –

Architecture flow

The above diagram shows that the application, which uses the Open-CV, analyzes individual frames from the source & extracts the complete text within the video & displays it on top of the target screen besides prints the same in the console.

Python Packages:

pip install imutils==0.5.4
pip install matplotlib==3.5.2
pip install numpy==1.21.6
pip install opencv-contrib-python==4.6.0.66
pip install opencv-contrib-python-headless==4.6.0.66
pip install opencv-python==4.6.0.66
pip install opencv-python-headless==4.6.0.66
pip install pandas==1.3.5
pip install Pillow==9.1.1
pip install pytesseract==0.3.9
pip install python-dateutil==2.8.2

CODE:

Let us now understand the code. For this use case, we will only discuss three python scripts. However, we need more than these three. However, we have already discussed them in some of the early posts. Hence, we will skip them here.

  • clsReadingTextFromStream.py (This is the main class of python script that will extract the text from the WebCAM streaming in real-time.)


##################################################
#### Written By: SATYAKI DE ####
#### Written On: 22-Jul-2022 ####
#### Modified On 25-Jul-2022 ####
#### ####
#### Objective: This is the main class of ####
#### python script that will invoke the ####
#### extraction of texts from a WebCAM. ####
#### ####
##################################################
# Importing necessary packages
from clsConfig import clsConfig as cf
from imutils.object_detection import non_max_suppression
import numpy as np
import pytesseract
import imutils
import time
import cv2
import time
###############################################
### Global Section ###
###############################################
# Two output layer names for the text detector model
lNames = cf.conf['LAYER_DET']
# Tesseract OCR text param values
strVal = "-l " + str(cf.conf['LANG']) + " –oem " + str(cf.conf['OEM_VAL']) + " –psm " + str(cf.conf['PSM_VAL']) + ""
config = (strVal)
###############################################
### End of Global Section ###
###############################################
class clsReadingTextFromStream:
def __init__(self):
self.sep = str(cf.conf['SEP'])
self.Curr_Path = str(cf.conf['INIT_PATH'])
self.CacheL = int(cf.conf['CACHE_LIM'])
self.modelPath = str(cf.conf['MODEL_PATH']) + str(cf.conf['MODEL_FILE_NAME'])
self.minConf = float(cf.conf['MIN_CONFIDENCE'])
self.wt = int(cf.conf['WIDTH'])
self.ht = int(cf.conf['HEIGHT'])
self.pad = float(cf.conf['PADDING'])
self.title = str(cf.conf['TITLE'])
self.Otitle = str(cf.conf['ORIG_TITLE'])
self.drawTag = cf.conf['DRAW_TAG']
self.aRange = int(cf.conf['ASCII_RANGE'])
self.sParam = cf.conf['SUBTRACT_PARAM']
def findBoundBox(self, boxes, res, rW, rH, orig, origW, origH, pad):
try:
# Loop over the bounding boxes
for (spX, spY, epX, epY) in boxes:
# Scale the bounding box coordinates based on the respective
# ratios
spX = int(spX * rW)
spY = int(spY * rH)
epX = int(epX * rW)
epY = int(epY * rH)
# To obtain a better OCR of the text we can potentially
# apply a bit of padding surrounding the bounding box.
# And, computing the deltas in both the x and y directions
dX = int((epX spX) * pad)
dY = int((epY spY) * pad)
# Apply padding to each side of the bounding box, respectively
spX = max(0, spX dX)
spY = max(0, spY dY)
epX = min(origW, epX + (dX * 2))
epY = min(origH, epY + (dY * 2))
# Extract the actual padded ROI
roi = orig[spY:epY, spX:epX]
# Choose the proper OCR Config
text = pytesseract.image_to_string(roi, config=config)
# Add the bounding box coordinates and OCR'd text to the list
# of results
res.append(((spX, spY, epX, epY), text))
# Sort the results bounding box coordinates from top to bottom
res = sorted(res, key=lambda r:r[0][1])
return res
except Exception as e:
x = str(e)
print(x)
return res
def predictText(self, imgScore, imgGeo):
try:
minConf = self.minConf
# Initializing the bounding box rectangles & confidence score by
# extracting the rows & columns from the imgScore volume.
(numRows, numCols) = imgScore.shape[2:4]
rects = []
confScore = []
for y in range(0, numRows):
# Extract the imgScore probabilities to derive potential
# bounding box coordinates that surround text
imgScoreData = imgScore[0, 0, y]
xVal0 = imgGeo[0, 0, y]
xVal1 = imgGeo[0, 1, y]
xVal2 = imgGeo[0, 2, y]
xVal3 = imgGeo[0, 3, y]
anglesData = imgGeo[0, 4, y]
for x in range(0, numCols):
# If our score does not have sufficient probability,
# ignore it
if imgScoreData[x] < minConf:
continue
# Compute the offset factor as our resulting feature
# maps will be 4x smaller than the input frame
(offX, offY) = (x * 4.0, y * 4.0)
# Extract the rotation angle for the prediction and
# then compute the sin and cosine
angle = anglesData[x]
cos = np.cos(angle)
sin = np.sin(angle)
# Derive the width and height of the bounding box from
# imgGeo
h = xVal0[x] + xVal2[x]
w = xVal1[x] + xVal3[x]
# Compute both the starting and ending (x, y)-coordinates
# for the text prediction bounding box
epX = int(offX + (cos * xVal1[x]) + (sin * xVal2[x]))
epY = int(offY (sin * xVal1[x]) + (cos * xVal2[x]))
spX = int(epX w)
spY = int(epY h)
# Adding bounding box coordinates and probability score
# to the respective lists
rects.append((spX, spY, epX, epY))
confScore.append(imgScoreData[x])
# return a tuple of the bounding boxes and associated confScore
return (rects, confScore)
except Exception as e:
x = str(e)
print(x)
rects = []
confScore = []
return (rects, confScore)
def processStream(self, debugInd, var):
try:
sep = self.sep
Curr_Path = self.Curr_Path
CacheL = self.CacheL
modelPath = self.modelPath
minConf = self.minConf
wt = self.wt
ht = self.ht
pad = self.pad
title = self.title
Otitle = self.Otitle
drawTag = self.drawTag
aRange = self.aRange
sParam = self.sParam
val = 0
# Initialize the video stream and allow the camera sensor to warm up
print("[INFO] Starting video stream…")
cap = cv2.VideoCapture(0)
# Loading the pre-trained text detector
print("[INFO] Loading Text Detector…")
net = cv2.dnn.readNet(modelPath)
# Loop over the frames from the video stream
while True:
try:
# Grab the frame from our video stream and resize it
success, frame = cap.read()
orig = frame.copy()
(origH, origW) = frame.shape[:2]
# Setting new width and height and then determine the ratio in change
# for both the width and height
(newW, newH) = (wt, ht)
rW = origW / float(newW)
rH = origH / float(newH)
# Resize the frame and grab the new frame dimensions
frame = cv2.resize(frame, (newW, newH))
(H, W) = frame.shape[:2]
# Construct a blob from the frame and then perform a forward pass of
# the model to obtain the two output layer sets
blob = cv2.dnn.blobFromImage(frame, 1.0, (W, H), sParam, swapRB=True, crop=False)
net.setInput(blob)
(confScore, imgGeo) = net.forward(lNames)
# Decode the predictions, then apply non-maxima suppression to
# suppress weak, overlapping bounding boxes
(rects, confidences) = self.predictText(confScore, imgGeo)
boxes = non_max_suppression(np.array(rects), probs=confidences)
# Initialize the list of results
res = []
# Getting BoundingBox boundaries
res = self.findBoundBox(boxes, res, rW, rH, orig, origW, origH, pad)
for ((spX, spY, epX, epY), text) in res:
# Display the text OCR by using Tesseract APIs
print("Reading Text::")
print("=" *60)
print(text)
print("=" *60)
# Removing the non-ASCII text so it can draw the text on the frame
# using OpenCV, then draw the text and a bounding box surrounding
# the text region of the input frame
text = "".join([c if ord(c) < aRange else "" for c in text]).strip()
output = orig.copy()
cv2.rectangle(output, (spX, spY), (epX, epY), drawTag, 2)
cv2.putText(output, text, (spX, spY 20), cv2.FONT_HERSHEY_SIMPLEX, 1.2, drawTag, 3)
# Show the output frame
cv2.imshow(title, output)
#cv2.imshow(Otitle, frame)
# If the `q` key was pressed, break from the loop
if cv2.waitKey(1) == ord('q'):
break
val = 0
except Exception as e:
x = str(e)
print(x)
val = 1
# Performing cleanup at the end
cap.release()
cv2.destroyAllWindows()
return val
except Exception as e:
x = str(e)
print('Error:', x)
return 1

Please find the key snippet from the above script –

# Two output layer names for the text detector model

lNames = cf.conf['LAYER_DET']

# Tesseract OCR text param values

strVal = "-l " + str(cf.conf['LANG']) + " --oem " + str(cf.conf['OEM_VAL']) + " --psm " + str(cf.conf['PSM_VAL']) + ""
config = (strVal)

The first line contains the two output layers’ names for the text detector model. Among them, the first one indicates the outcome possibilities & the second one use to derive the bounding box coordinates of the predicted text.

The second line contains various options for the tesseract APIs. You need to understand the opportunities in detail to make them work. These are the essential options for our use case –

  • Language – The intended language, for example, English, Spanish, Hindi, Bengali, etc.
  • OEM flag – In this case, the application will use 4 to indicate LSTM neural net model for OCR.
  • OEM Value – In this case, the selected value is 7, indicating that the application treats the ROI as a single line of text.

For more details, please refer to the config file.

print("[INFO] Loading Text Detector...")
net = cv2.dnn.readNet(modelPath)

The above lines bring the already created model & load it to memory for evaluation.

# Setting new width and height and then determine the ratio in change
# for both the width and height
(newW, newH) = (wt, ht)
rW = origW / float(newW)
rH = origH / float(newH)

# Resize the frame and grab the new frame dimensions
frame = cv2.resize(frame, (newW, newH))
(H, W) = frame.shape[:2]

# Construct a blob from the frame and then perform a forward pass of
# the model to obtain the two output layer sets
blob = cv2.dnn.blobFromImage(frame, 1.0, (W, H), sParam, swapRB=True, crop=False)
net.setInput(blob)
(confScore, imgGeo) = net.forward(lNames)

# Decode the predictions, then apply non-maxima suppression to
# suppress weak, overlapping bounding boxes
(rects, confidences) = self.predictText(confScore, imgGeo)
boxes = non_max_suppression(np.array(rects), probs=confidences)

The above lines are more of preparing individual frames to get the bounding box by resizing the height & width followed by a forward pass of the model to obtain two output layer sets. And then apply the non-maxima suppression to remove the weak, overlapping bounding box by interpreting the prediction. In short, this will identify the potential text region & put the bounding box surrounding it.

# Initialize the list of results
res = []

# Getting BoundingBox boundaries
res = self.findBoundBox(boxes, res, rW, rH, orig, origW, origH, pad)

The above function will create the bounding box surrounding the predicted text regions. Also, we will capture the expected text inside the result variable.

for (spX, spY, epX, epY) in boxes:
  # Scale the bounding box coordinates based on the respective
  # ratios
  spX = int(spX * rW)
  spY = int(spY * rH)
  epX = int(epX * rW)
  epY = int(epY * rH)

  # To obtain a better OCR of the text we can potentially
  # apply a bit of padding surrounding the bounding box.
  # And, computing the deltas in both the x and y directions
  dX = int((epX - spX) * pad)
  dY = int((epY - spY) * pad)

  # Apply padding to each side of the bounding box, respectively
  spX = max(0, spX - dX)
  spY = max(0, spY - dY)
  epX = min(origW, epX + (dX * 2))
  epY = min(origH, epY + (dY * 2))

  # Extract the actual padded ROI
  roi = orig[spY:epY, spX:epX]

Now, the application will scale the bounding boxes based on the previously computed ratio for actual text recognition. In this process, the application also padded the bounding boxes & then extracted the padded region of interest.

# Choose the proper OCR Config
text = pytesseract.image_to_string(roi, config=config)

# Add the bounding box coordinates and OCR'd text to the list
# of results
res.append(((spX, spY, epX, epY), text))

Using OCR options, the application extracts the text within the video frame & adds that to the res list.

# Sort the results bounding box coordinates from top to bottom
res = sorted(res, key=lambda r:r[0][1])

It then sends a sorted output to the primary calling functions.

for ((spX, spY, epX, epY), text) in res:
  # Display the text OCR by using Tesseract APIs
  print("Reading Text::")
  print("=" *60)
  print(text)
  print("=" *60)

  # Removing the non-ASCII text so it can draw the text on the frame
  # using OpenCV, then draw the text and a bounding box surrounding
  # the text region of the input frame
  text = "".join([c if ord(c) < aRange else "" for c in text]).strip()
  output = orig.copy()

  cv2.rectangle(output, (spX, spY), (epX, epY), drawTag, 2)
  cv2.putText(output, text, (spX, spY - 20), cv2.FONT_HERSHEY_SIMPLEX, 1.2, drawTag, 3)

  # Show the output frame
  cv2.imshow(title, output)

Finally, it fetches the potential text region along with the text & then prints on top of the source video. Also, it removed some non-printable characters during this time to avoid any cryptic texts.

  • readingVideo.py (Main calling script.)


#####################################################
#### Written By: SATYAKI DE ####
#### Written On: 22-Jul-2022 ####
#### Modified On 25-Jul-2022 ####
#### ####
#### Objective: This is the main calling ####
#### python script that will invoke the ####
#### clsReadingTextFromStream class to initiate ####
#### the reading capability in real-time ####
#### & display text via Web-CAM. ####
#####################################################
# We keep the setup code in a different class as shown below.
import clsReadingTextFromStream as rtfs
from clsConfig import clsConfig as cf
import datetime
import logging
###############################################
### Global Section ###
###############################################
# Instantiating all the main class
x1 = rtfs.clsReadingTextFromStream()
###############################################
### End of Global Section ###
###############################################
def main():
try:
# Other useful variables
debugInd = 'Y'
var = datetime.datetime.now().strftime("%Y-%m-%d_%H-%M-%S")
var1 = datetime.datetime.now()
print('Start Time: ', str(var))
# End of useful variables
# Initiating Log Class
general_log_path = str(cf.conf['LOG_PATH'])
# Enabling Logging Info
logging.basicConfig(filename=general_log_path + 'readingTextFromVideo.log', level=logging.INFO)
print('Started reading text from videos!')
# Execute all the pass
r1 = x1.processStream(debugInd, var)
if (r1 == 0):
print('Successfully read text from the Live Stream!')
else:
print('Failed to read text from the Live Stream!')
var2 = datetime.datetime.now()
c = var2 var1
minutes = c.total_seconds() / 60
print('Total difference in minutes: ', str(minutes))
print('End Time: ', str(var1))
except Exception as e:
x = str(e)
print('Error: ', x)
if __name__ == "__main__":
main()

view raw

readingVideo.py

hosted with ❤ by GitHub

Please find the key snippet –

# Instantiating all the main class

x1 = rtfs.clsReadingTextFromStream()

# Execute all the pass
r1 = x1.processStream(debugInd, var)

if (r1 == 0):
    print('Successfully read text from the Live Stream!')
else:
    print('Failed to read text from the Live Stream!')

The above lines instantiate the main calling class & then invoke the function to get the desired extracted text from the live streaming video if that is successful.
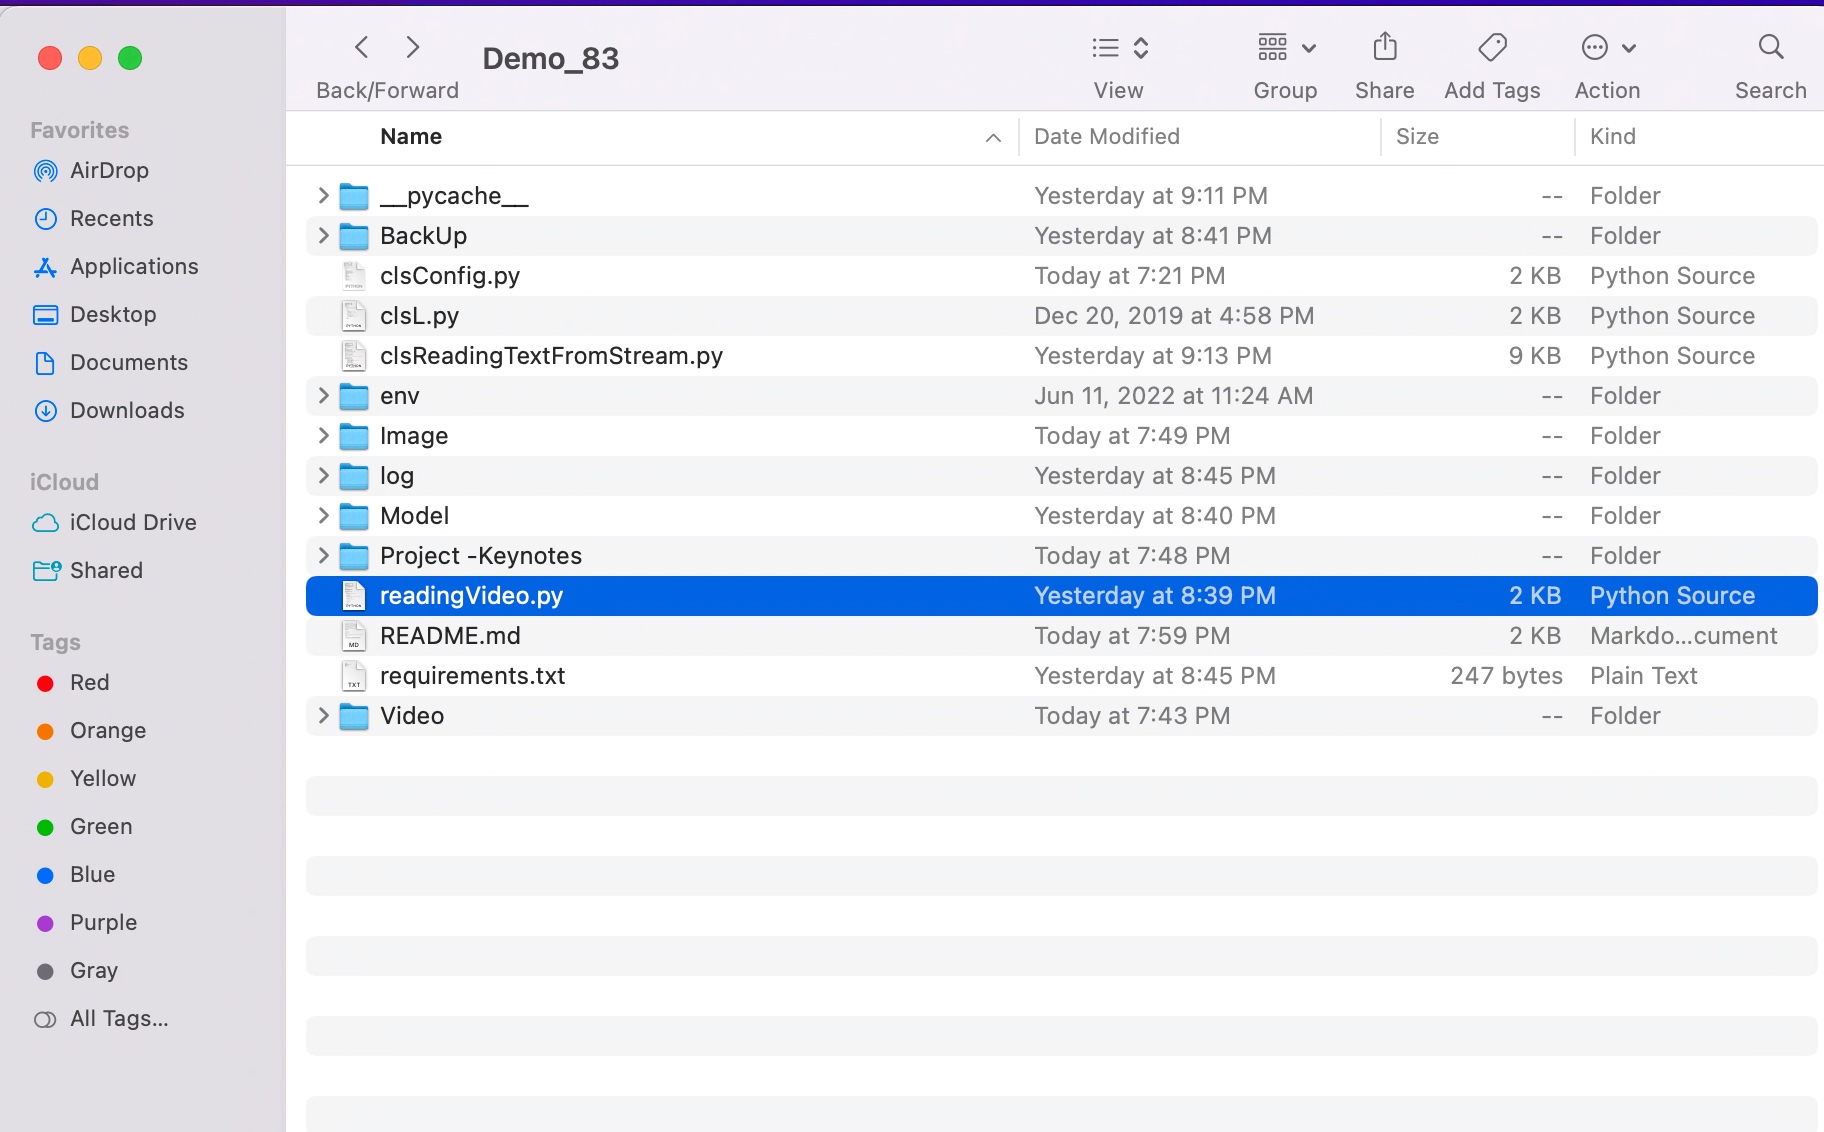
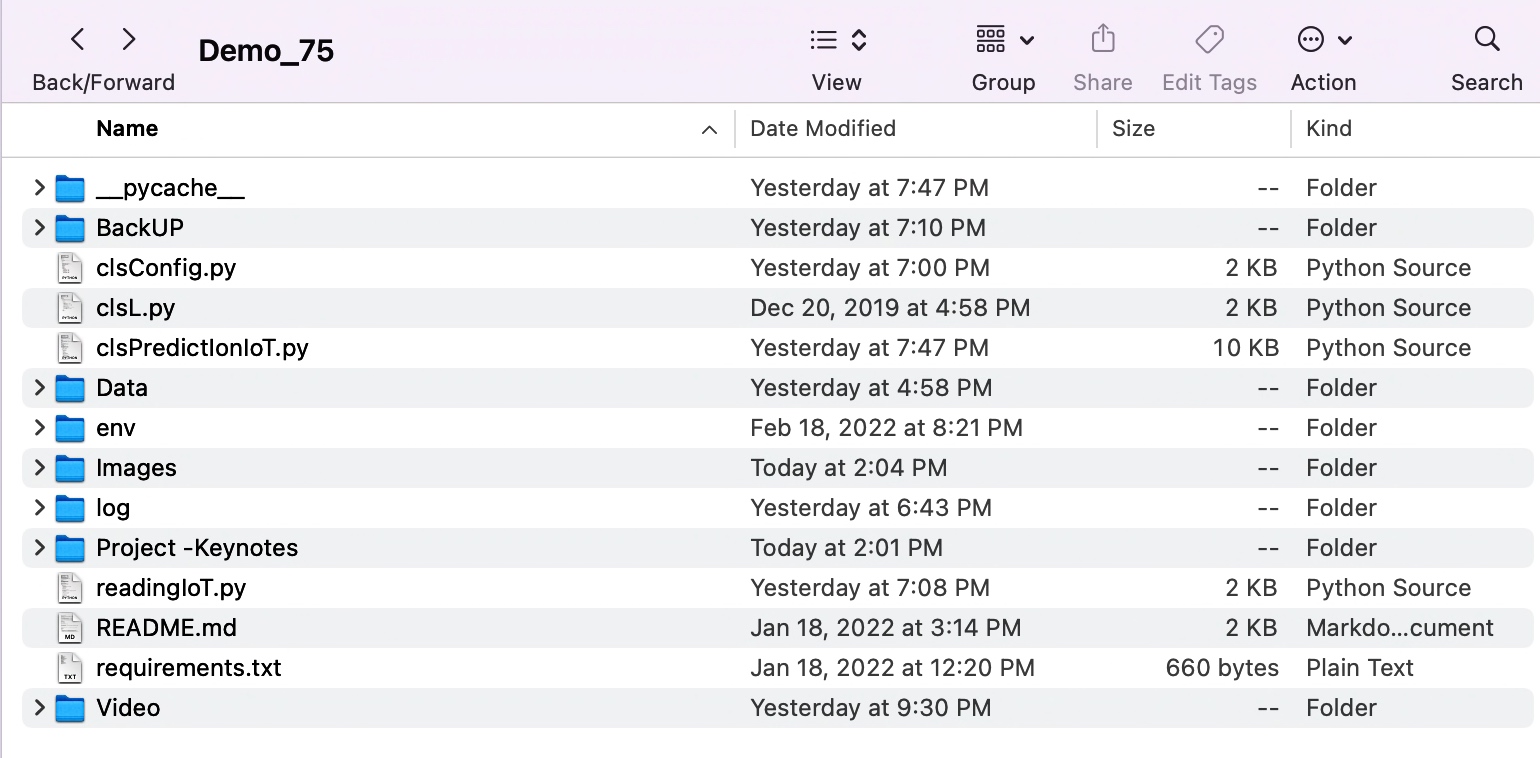
FOLDER STRUCTURE:

Here is the folder structure that contains all the files & directories in MAC O/S –

You will get the complete codebase in the following Github link.

Unfortunately, I cannot upload the model due to it’s size. I will share on the need basis.

I’ll bring some more exciting topic in the coming days from the Python verse. Please share & subscribe my post & let me know your feedback.

Till then, Happy Avenging! 🙂

Note: All the data & scenario posted here are representational data & scenarios & available over the internet & for educational purpose only. Some of the images (except my photo) that we’ve used are available over the net. We don’t claim the ownership of these images. There is an always room for improvement & especially the prediction quality.

Neural prophet – The enhanced version of Facebook’s forecasting API

Hi Team,

Today, I’ll be explaining the enhancement of one of the previous posts. I know that I’ve shared the fascinating API named prophet-API, which Facebook developed. One can quickly get more accurate predictions with significantly fewer data points. (If you want to know more about that post, please click on the following link.)

However, there is another enhancement on top of that API, which is more accurate. However, one needs to know – when they should consider using it. So, today, we’ll be talking about the neural prophet API.

But, before we start digging deep, why don’t we view the demo first?

Demo

Let’s visit a diagram. That way, you can understand where you can use it. Also, I’ll be sharing some of the links from the original site for better information mining.

Source: Neural Prophet (Official Site)

As one can see, this API is trying to bridge between the different groups & it enables the time-series computation efficiently.

WHERE TO USE:

Let’s visit another diagram from the same source.

Source: Neural Prophet (Official Site)

So, I hope these two pictures give you a clear picture & relatively set your expectations to more ground reality.


ARCHITECTURE:

Let us explore the architecture –

Architecture Diagram

As one can see, the application is processing IoT data & creating a historical data volume, out of which the model is gradually predicting correct outcomes with higher confidence.

For more information on this API, please visit the following link.


CODE:

Let’s explore the essential scripts here.

  1. clsConfig.py (Configuration file for the entire application.)


################################################
#### Written By: SATYAKI DE ####
#### Written On: 15-May-2020 ####
#### Modified On: 28-Dec-2021 ####
#### ####
#### Objective: This script is a config ####
#### file, contains all the keys for ####
#### Machine-Learning & streaming dashboard.####
#### ####
################################################
import os
import platform as pl
import pandas as p
class clsConfig(object):
Curr_Path = os.path.dirname(os.path.realpath(__file__))
os_det = pl.system()
if os_det == "Windows":
sep = '\\'
else:
sep = '/'
conf = {
'APP_ID': 1,
'ARCH_DIR': Curr_Path + sep + 'arch' + sep,
'PROFILE_PATH': Curr_Path + sep + 'profile' + sep,
'LOG_PATH': Curr_Path + sep + 'log' + sep,
'REPORT_PATH': Curr_Path + sep + 'report',
'FILE_NAME': Curr_Path + sep + 'Data' + sep + 'thermostatIoT.csv',
'SRC_PATH': Curr_Path + sep + 'data' + sep,
'APP_DESC_1': 'Old Video Enhancement!',
'DEBUG_IND': 'N',
'INIT_PATH': Curr_Path,
'SUBDIR': 'data',
'SEP': sep,
'testRatio':0.2,
'valRatio':0.2,
'epochsVal':8,
'sleepTime':3,
'sleepTime1':6,
'factorVal':0.2,
'learningRateVal':0.001,
'event1': {
'event': 'SummerEnd',
'ds': p.to_datetime([
'2010-04-01', '2011-04-01', '2012-04-01',
'2013-04-01', '2014-04-01', '2015-04-01',
'2016-04-01', '2017-04-01', '2018-04-01',
'2019-04-01', '2020-04-01', '2021-04-01',
]),},
'event2': {
'event': 'LongWeekend',
'ds': p.to_datetime([
'2010-12-01', '2011-12-01', '2012-12-01',
'2013-12-01', '2014-12-01', '2015-12-01',
'2016-12-01', '2017-12-01', '2018-12-01',
'2019-12-01', '2020-12-01', '2021-12-01',
]),}
}

view raw

clsConfig.py

hosted with ❤ by GitHub

The only key snippet would be passing a nested json element with pandas dataframe in the following lines –

'event1': {
    'event': 'SummerEnd',
    'ds': p.to_datetime([
        '2010-04-01', '2011-04-01', '2012-04-01',
        '2013-04-01', '2014-04-01', '2015-04-01',
        '2016-04-01', '2017-04-01', '2018-04-01',
        '2019-04-01', '2020-04-01', '2021-04-01',
    ]),},
'event2': {
    'event': 'LongWeekend',
    'ds': p.to_datetime([
        '2010-12-01', '2011-12-01', '2012-12-01',
        '2013-12-01', '2014-12-01', '2015-12-01',
        '2016-12-01', '2017-12-01', '2018-12-01',
        '2019-12-01', '2020-12-01', '2021-12-01',
    ]),}

As one can see, our application is equipped with the events to predict our use case better.

2. clsPredictIonIoT.py (Main class file, which will invoke neural-prophet forecast for the entire application.)


################################################
#### Written By: SATYAKI DE ####
#### Written On: 19-Feb-2022 ####
#### Modified On 21-Feb-2022 ####
#### ####
#### Objective: This python script will ####
#### perform the neural-prophet forecast ####
#### based on the historical input received ####
#### from IoT device. ####
################################################
# We keep the setup code in a different class as shown below.
from clsConfig import clsConfig as cf
import psutil
import os
import pandas as p
import json
import datetime
from neuralprophet import NeuralProphet, set_log_level
from neuralprophet import set_random_seed
from neuralprophet.benchmark import Dataset, NeuralProphetModel, SimpleExperiment, CrossValidationExperiment
import time
import clsL as cl
import matplotlib.pyplot as plt
###############################################
### Global Section ###
###############################################
# Initiating Log class
l = cl.clsL()
set_random_seed(10)
set_log_level("ERROR", "INFO")
###############################################
### End of Global Section ###
###############################################
class clsPredictIonIoT:
def __init__(self):
self.sleepTime = int(cf.conf['sleepTime'])
self.event1 = cf.conf['event1']
self.event2 = cf.conf['event2']
def forecastSeries(self, inputDf):
try:
sleepTime = self.sleepTime
event1 = self.event1
event2 = self.event2
df = inputDf
print('IoTData: ')
print(df)
## user specified events
# history events
SummerEnd = p.DataFrame(event1)
LongWeekend = p.DataFrame(event2)
dfEvents = p.concat((SummerEnd, LongWeekend))
# NeuralProphet Object
# Adding events
m = NeuralProphet(loss_func="MSE")
# set the model to expect these events
m = m.add_events(["SummerEnd", "LongWeekend"])
# create the data df with events
historyDf = m.create_df_with_events(df, dfEvents)
# fit the model
metrics = m.fit(historyDf, freq="D")
# forecast with events known ahead
futureDf = m.make_future_dataframe(df=historyDf, events_df=dfEvents, periods=365, n_historic_predictions=len(df))
forecastDf = m.predict(df=futureDf)
events = forecastDf[(forecastDf['event_SummerEnd'].abs() + forecastDf['event_LongWeekend'].abs()) > 0]
events.tail()
## plotting forecasts
fig = m.plot(forecastDf)
## plotting components
figComp = m.plot_components(forecastDf)
## plotting parameters
figParam = m.plot_parameters()
#################################
#### Train & Test Evaluation ####
#################################
m = NeuralProphet(seasonality_mode= "multiplicative", learning_rate = 0.1)
dfTrain, dfTest = m.split_df(df=df, freq="MS", valid_p=0.2)
metricsTrain = m.fit(df=dfTrain, freq="MS")
metricsTest = m.test(df=dfTest)
print('metricsTest:: ')
print(metricsTest)
# Predict Into Future
metricsTrain2 = m.fit(df=df, freq="MS")
futureDf = m.make_future_dataframe(df, periods=24, n_historic_predictions=48)
forecastDf = m.predict(futureDf)
fig = m.plot(forecastDf)
# Visualize training
m = NeuralProphet(seasonality_mode="multiplicative", learning_rate=0.1)
dfTrain, dfTest = m.split_df(df=df, freq="MS", valid_p=0.2)
metrics = m.fit(df=dfTrain, freq="MS", validation_df=dfTest, plot_live_loss=True)
print('Tail of Metrics: ')
print(metrics.tail(1))
######################################
#### Time-series Cross-Validation ####
######################################
METRICS = ['SmoothL1Loss', 'MAE', 'RMSE']
params = {"seasonality_mode": "multiplicative", "learning_rate": 0.1}
folds = NeuralProphet(**params).crossvalidation_split_df(df, freq="MS", k=5, fold_pct=0.20, fold_overlap_pct=0.5)
metricsTrain = p.DataFrame(columns=METRICS)
metricsTest = p.DataFrame(columns=METRICS)
for dfTrain, dfTest in folds:
m = NeuralProphet(**params)
train = m.fit(df=dfTrain, freq="MS")
test = m.test(df=dfTest)
metricsTrain = metricsTrain.append(train[METRICS].iloc[1])
metricsTest = metricsTest.append(test[METRICS].iloc[1])
print('Stats: ')
dfStats = metricsTest.describe().loc[["mean", "std", "min", "max"]]
print(dfStats)
####################################
#### Using Benchmark Framework ####
####################################
print('Starting extracting result set for Benchmark:')
ts = Dataset(df = df, name = "thermoStatsCPUUsage", freq = "MS")
params = {"seasonality_mode": "multiplicative"}
exp = SimpleExperiment(
model_class=NeuralProphetModel,
params=params,
data=ts,
metrics=["MASE", "RMSE"],
test_percentage=25,
)
resultTrain, resultTest = exp.run()
print('Test result for Benchmark:: ')
print(resultTest)
print('Finished extracting result test for Benchmark!')
####################################
#### Cross Validate Experiment ####
####################################
print('Starting extracting result set for Corss-Validation:')
ts = Dataset(df = df, name = "thermoStatsCPUUsage", freq = "MS")
params = {"seasonality_mode": "multiplicative"}
exp_cv = CrossValidationExperiment(
model_class=NeuralProphetModel,
params=params,
data=ts,
metrics=["MASE", "RMSE"],
test_percentage=10,
num_folds=3,
fold_overlap_pct=0,
)
resultTrain, resultTest = exp_cv.run()
print('resultTest for Cross Validation:: ')
print(resultTest)
print('Finished extracting result test for Corss-Validation!')
######################################################
#### 3-Phase Train, Test & Validation Experiment ####
######################################################
print('Starting 3-phase Train, Test & Validation Experiment!')
m = NeuralProphet(seasonality_mode= "multiplicative", learning_rate = 0.1)
# create a test holdout set:
dfTrainVal, dfTest = m.split_df(df=df, freq="MS", valid_p=0.2)
# create a validation holdout set:
dfTrain, dfVal = m.split_df(df=dfTrainVal, freq="MS", valid_p=0.2)
# fit a model on training data and evaluate on validation set.
metricsTrain1 = m.fit(df=dfTrain, freq="MS")
metrics_val = m.test(df=dfVal)
# refit model on training and validation data and evaluate on test set.
metricsTrain2 = m.fit(df=dfTrainVal, freq="MS")
metricsTest = m.test(df=dfTest)
metricsTrain1["split"] = "train1"
metricsTrain2["split"] = "train2"
metrics_val["split"] = "validate"
metricsTest["split"] = "test"
metrics_stat = metricsTrain1.tail(1).append([metricsTrain2.tail(1), metrics_val, metricsTest]).drop(columns=['RegLoss'])
print('Metrics Stat:: ')
print(metrics_stat)
# Train, Cross-Validate and Cross-Test evaluation
METRICS = ['SmoothL1Loss', 'MAE', 'RMSE']
params = {"seasonality_mode": "multiplicative", "learning_rate": 0.1}
crossVal, crossTest = NeuralProphet(**params).double_crossvalidation_split_df(df, freq="MS", k=5, valid_pct=0.10, test_pct=0.10)
metricsTrain1 = p.DataFrame(columns=METRICS)
metrics_val = p.DataFrame(columns=METRICS)
for dfTrain1, dfVal in crossVal:
m = NeuralProphet(**params)
train1 = m.fit(df=dfTrain, freq="MS")
val = m.test(df=dfVal)
metricsTrain1 = metricsTrain1.append(train1[METRICS].iloc[1])
metrics_val = metrics_val.append(val[METRICS].iloc[1])
metricsTrain2 = p.DataFrame(columns=METRICS)
metricsTest = p.DataFrame(columns=METRICS)
for dfTrain2, dfTest in crossTest:
m = NeuralProphet(**params)
train2 = m.fit(df=dfTrain2, freq="MS")
test = m.test(df=dfTest)
metricsTrain2 = metricsTrain2.append(train2[METRICS].iloc[1])
metricsTest = metricsTest.append(test[METRICS].iloc[1])
mtrain2 = metricsTrain2.describe().loc[["mean", "std"]]
print('Train 2 Stats:: ')
print(mtrain2)
mval = metrics_val.describe().loc[["mean", "std"]]
print('Validation Stats:: ')
print(mval)
mtest = metricsTest.describe().loc[["mean", "std"]]
print('Test Stats:: ')
print(mtest)
return 0
except Exception as e:
x = str(e)
print('Error: ', x)
return 1

Some of the key snippets that I will discuss here are as follows –

## user specified events
# history events
SummerEnd = p.DataFrame(event1)
LongWeekend = p.DataFrame(event2)

dfEvents = p.concat((SummerEnd, LongWeekend))

# NeuralProphet Object
# Adding events
m = NeuralProphet(loss_func="MSE")

# set the model to expect these events
m = m.add_events(["SummerEnd", "LongWeekend"])

# create the data df with events
historyDf = m.create_df_with_events(df, dfEvents)

Creating & adding events into your model will allow it to predict based on the milestones.

# fit the model
metrics = m.fit(historyDf, freq="D")

# forecast with events known ahead
futureDf = m.make_future_dataframe(df=historyDf, events_df=dfEvents, periods=365, n_historic_predictions=len(df))
forecastDf = m.predict(df=futureDf)

events = forecastDf[(forecastDf['event_SummerEnd'].abs() + forecastDf['event_LongWeekend'].abs()) > 0]
events.tail()

## plotting forecasts
fig = m.plot(forecastDf)

## plotting components
figComp = m.plot_components(forecastDf)

## plotting parameters
figParam = m.plot_parameters()

Based on the daily/monthly collected data, our algorithm tries to plot the data points & predict a future trend, which will look like this –

Future Data Points

From the above diagram, we can conclude that the CPU’s trend has been growing day by day since the beginning. However, there are some events when we can see a momentary drop in requirements due to the climate & holidays. During those times, either people are not using them or are not at home.

Apart from that, I’ve demonstrated the use of a benchwork framework, & splitting the data into Train, Test & Validation & captured the RMSE values. I would request you to go through that & post any questions if you have any.

You can witness the train & validation datasets & visualize them in the standard manner, which will look something like –

Demo

3. readingIoT.py (Main invoking script.)


###############################################
#### Written By: SATYAKI DE ####
#### Written On: 21-Feb-2022 ####
#### Modified On 21-Feb-2022 ####
#### ####
#### Objective: This python script will ####
#### invoke the main class to use the ####
#### stored historical IoT data stored & ####
#### then transform, cleanse, predict & ####
#### analyze the data points into more ####
#### meaningful decision-making insights. ####
###############################################
# We keep the setup code in a different class as shown below.
from clsConfig import clsConfig as cf
import datetime
import logging
import pandas as p
import clsPredictIonIoT as cpt
###############################################
### Global Section ###
###############################################
sep = str(cf.conf['SEP'])
Curr_Path = str(cf.conf['INIT_PATH'])
fileName = str(cf.conf['FILE_NAME'])
###############################################
### End of Global Section ###
###############################################
def main():
try:
# Other useful variables
debugInd = 'Y'
var = datetime.datetime.now().strftime("%Y-%m-%d_%H-%M-%S")
var1 = datetime.datetime.now()
# Initiating Prediction class
x1 = cpt.clsPredictIonIoT()
print('Start Time: ', str(var))
# End of useful variables
# Initiating Log Class
general_log_path = str(cf.conf['LOG_PATH'])
# Enabling Logging Info
logging.basicConfig(filename=general_log_path + 'IoT_NeuralProphet.log', level=logging.INFO)
# Reading the source IoT data
iotData = p.read_csv(fileName)
df = iotData.rename(columns={'MonthlyDate': 'ds', 'AvgIoTCPUUsage': 'y'})[['ds', 'y']]
r1 = x1.forecastSeries(df)
if (r1 == 0):
print('Successfully IoT forecast predicted!')
else:
print('Failed to predict IoT forecast!')
var2 = datetime.datetime.now()
c = var2 var1
minutes = c.total_seconds() / 60
print('Total Run Time in minutes: ', str(minutes))
print('End Time: ', str(var1))
except Exception as e:
x = str(e)
print('Error: ', x)
if __name__ == "__main__":
main()

view raw

readingIoT.py

hosted with ❤ by GitHub

Here are some of the key snippets –

# Reading the source IoT data
iotData = p.read_csv(fileName)
df = iotData.rename(columns={'MonthlyDate': 'ds', 'AvgIoTCPUUsage': 'y'})[['ds', 'y']]

r1 = x1.forecastSeries(df)

if (r1 == 0):
    print('Successfully IoT forecast predicted!')
else:
    print('Failed to predict IoT forecast!')

var2 = datetime.datetime.now()

In those above lines, the main calling application is invoking the neural-forecasting class & passing the pandas dataframe containing IoT’s historical data to train its model.

For your information, here is the outcome of the run, when you invoke the main calling script –

Demo – Continue

FOLDER STRUCTURE:

Please find the folder structure as shown –

Directory Structure

So, we’ve done it.

You will get the complete codebase in the following Github link.

I’ll bring some more exciting topic in the coming days from the Python verse. Please share & subscribe my post & let me know your feedback.

Till then, Happy Avenging! 😀

Note: All the data & scenario posted here are representational data & scenarios & available over the internet & for educational purpose only. Some of the images (except my photo) that we’ve used are available over the net. We don’t claim the ownership of these images. There is an always room for improvement & especially the prediction quality.

Real-Time Matplotlib view from a streaming data built using Python & Kivy-based iOS App

Today, I’ll be sharing one of the most exciting posts I’ve ever shared. This post is rare as you cannot find the most relevant working solution easily over the net.

So, what are we talking about here? We’re going to build a Python-based iOS App using the Kivy framework. You get plenty of videos & documents on this as well. However, nowhere you’ll find the capability that I’m about to disclose. We’ll consume live IoT streaming data from a dummy application & then plot them in a MatplotLib dashboard inside the mobile App. And that’s where this post is seriously different from the rest of the available white papers.


But, before we dig into more details, let us see a quick demo of our iOS App.

Demo:

Demo

Isn’t it exciting? Great! Now, let’s dig into the details.


Let’s understand the architecture as to how we want to proceed with the solution here.

Architecture:

Broad-level design

The above diagram shows that the Kive-based iOS application that will consume streaming data from the Ably queue. The initial dummy IoT application will push the real-time events to the same Ably queue.

So, now we understand the architecture. Fantastic!

Let’s deep dive into the code that we specifically built for this use case.


Code:

  1. IoTDataGen.py (Publishing Streaming data to Ably channels & captured IoT events from the simulator & publish them in Dashboard through measured KPIs.)


##############################################
#### Updated By: SATYAKI DE ####
#### Updated On: 12-Nov-2021 ####
#### ####
#### Objective: Publishing Streaming data ####
#### to Ably channels & captured IoT ####
#### events from the simulator & publish ####
#### them in Dashboard through measured ####
#### KPIs. ####
#### ####
##############################################
import random
import time
import json
import clsPublishStream as cps
import datetime
from clsConfig import clsConfig as cf
import logging
# Invoking the IoT Device Generator.
def main():
###############################################
### Global Section ###
###############################################
# Initiating Ably class to push events
x1 = cps.clsPublishStream()
###############################################
### End of Global Section ###
###############################################
# Initiating Log Class
general_log_path = str(cf.conf['LOG_PATH'])
msgSize = int(cf.conf['limRec'])
# Enabling Logging Info
logging.basicConfig(filename=general_log_path + 'IoTDevice.log', level=logging.INFO)
# Other useful variables
cnt = 1
idx = 0
debugInd = 'Y'
x_value = 0
total_1 = 100
total_2 = 100
var = datetime.datetime.now().strftime("%Y-%m-%d_%H-%M-%S")
# End of usefull variables
while True:
srcJson = {
"x_value": x_value,
"total_1": total_1,
"total_2": total_2
}
x_value += 1
total_1 = total_1 + random.randint(6, 8)
total_2 = total_2 + random.randint(5, 6)
tmpJson = str(srcJson)
if cnt == 1:
srcJsonMast = '{' + '"' + str(idx) + '":'+ tmpJson
elif cnt == msgSize:
srcJsonMast = srcJsonMast + '}'
print('JSON: ')
print(str(srcJsonMast))
# Pushing both the Historical Confirmed Cases
retVal_1 = x1.pushEvents(srcJsonMast, debugInd, var)
if retVal_1 == 0:
print('Successfully IoT event pushed!')
else:
print('Failed to push IoT events!')
srcJsonMast = ''
tmpJson = ''
cnt = 0
idx = 1
srcJson = {}
retVal_1 = 0
else:
srcJsonMast = srcJsonMast + ',' + '"' + str(idx) + '":'+ tmpJson
cnt += 1
idx += 1
time.sleep(1)
if __name__ == "__main__":
main()

view raw

IoTDataGen.py

hosted with ❤ by GitHub

Let’s explore the key snippets from the above script.

# Initiating Ably class to push events
x1 = cps.clsPublishStream()

The I-OS App is calling the main class to publish the JSON events to Ably Queue.

if cnt == 1:
    srcJsonMast = '{' + '"' + str(idx) + '":'+ tmpJson
elif cnt == msgSize:
    srcJsonMast = srcJsonMast + '}'
    print('JSON: ')
    print(str(srcJsonMast))

    # Pushing both the Historical Confirmed Cases
    retVal_1 = x1.pushEvents(srcJsonMast, debugInd, var)

    if retVal_1 == 0:
        print('Successfully IoT event pushed!')
    else:
        print('Failed to push IoT events!')

    srcJsonMast = ''
    tmpJson = ''
    cnt = 0
    idx = -1
    srcJson = {}
    retVal_1 = 0
else:
    srcJsonMast = srcJsonMast + ',' + '"' + str(idx) + '":'+ tmpJson

In the above snippet, we’re forming the payload dynamically & then calling the “pushEvents” to push all the random generated IoT mock-events to the Ably queue.

2. custom.kv (Publishing Streaming data to Ably channels & captured IoT events from the simulator & publish them in Dashboard through measured KPIs.)


###############################################################
#### ####
#### Written By: Satyaki De ####
#### Written Date: 12-Nov-2021 ####
#### ####
#### Objective: This Kivy design file contains all the ####
#### graphical interface of our I-OS App. This including ####
#### the functionalities of buttons. ####
#### ####
#### Note: If you think this file is not proeprly read by ####
#### the program, then remove this entire comment block & ####
#### then run the application. It should work. ####
###############################################################
MainInterface:
<MainInterface>:
ScreenManager:
id: sm
size: root.width, root.height
Screen:
name: "background_1"
Image:
source: "Background/Background_1.png"
allow_stretch: True
keep_ratio: True
size_hint_y: None
size_hint_x: None
width: self.parent.width
height: self.parent.width/self.image_ratio
FloatLayout:
orientation: 'vertical'
Label:
text: "This is an application, which will consume the live streaming data inside a Kivy-based IOS-App by using Matplotlib to capture the KPIs."
text_size: self.width + 350, None
height: self.texture_size[1]
halign: "left"
valign: "bottom"
pos_hint: {'center_x':2.9,'center_y':6.5}
Image:
id: homesc
pos_hint: {'right':6, 'top':5.4}
size_hint: None, None
size: 560, 485
source: "Background/FP.jpeg"
Screen:
name: "background_2"
Image:
source: "Background/Background_2.png"
allow_stretch: True
keep_ratio: True
size_hint_y: None
size_hint_x: None
width: self.parent.width
height: self.parent.width/self.image_ratio
FloatLayout:
Label:
text: "Please find the realtime IoT-device Live Statistics:"
text_size: self.width + 430, None
height: self.texture_size[1]
halign: "left"
valign: "top"
pos_hint: {'center_x':3.0,'center_y':7.0}
Label:
text: "DC to Servo Min Ratio:"
text_size: self.width + 430, None
height: self.texture_size[1]
halign: "left"
valign: "top"
pos_hint: {'center_x':3.0,'center_y':6.2}
Label:
id: dynMin
text: "100"
text_size: self.width + 430, None
height: self.texture_size[1]
halign: "left"
valign: "top"
pos_hint: {'center_x':6.2,'center_y':6.2}
Label:
text: "DC Motor:"
text_size: self.width + 430, None
height: self.texture_size[1]
halign: "left"
valign: "top"
pos_hint: {'center_x':6.8,'center_y':5.4}
Label:
text: "(MAX)"
text_size: self.width + 430, None
height: self.texture_size[1]
halign: "left"
valign: "top"
pos_hint: {'center_x':6.8,'center_y':5.0}
Label:
id: dynDC
text: "100"
text_size: self.width + 430, None
height: self.texture_size[1]
halign: "left"
valign: "top"
pos_hint: {'center_x':6.8,'center_y':4.6}
Label:
text: " ——- Vs ——- "
text_size: self.width + 430, None
height: self.texture_size[1]
halign: "left"
valign: "top"
pos_hint: {'center_x':6.8,'center_y':4.0}
Label:
text: "Servo Motor:"
text_size: self.width + 430, None
height: self.texture_size[1]
halign: "left"
valign: "top"
pos_hint: {'center_x':6.8,'center_y':3.4}
Label:
text: "(MAX)"
text_size: self.width + 430, None
height: self.texture_size[1]
halign: "left"
valign: "top"
pos_hint: {'center_x':6.8,'center_y':3.0}
Label:
id: dynServo
text: "100"
text_size: self.width + 430, None
height: self.texture_size[1]
halign: "left"
valign: "top"
pos_hint: {'center_x':6.8,'center_y':2.6}
FloatLayout:
id: box
size: 400, 550
pos: 200, 300
Screen:
name: "background_3"
Image:
source: "Background/Background_3.png"
allow_stretch: True
keep_ratio: True
size_hint_y: None
size_hint_x: None
width: self.parent.width
height: self.parent.width/self.image_ratio
FloatLayout:
orientation: 'vertical'
Label:
text: "Please find the live like status."
text_size: self.width + 350, None
height: self.texture_size[1]
halign: "left"
valign: "bottom"
pos_hint: {'center_x':2.6,'center_y':7.2}
Label:
id: dynVal
text: "100"
text_size: self.width + 350, None
height: self.texture_size[1]
halign: "left"
valign: "bottom"
pos_hint: {'center_x':4.1,'center_y':6.4}
Image:
id: lk_img_1
pos_hint: {'center_x':3.2, 'center_y':6.4}
size_hint: None, None
size: 460, 285
source: "Background/Likes_Btn_R.png"
Label:
text: "Want to know more about the Developer? Here is the detail ->"
text_size: self.width + 450, None
height: self.texture_size[1]
halign: "left"
valign: "bottom"
pos_hint: {'center_x':3.1,'center_y':5.5}
Label:
text: "I love to find out new technologies that is emerging as a driving force & shape our future!"
text_size: self.width + 290, None
height: self.texture_size[1]
halign: "left"
valign: "bottom"
pos_hint: {'center_x':2.3,'center_y':3.8}
Label:
text: "For more information view the website to know more on Python-Kivy along with Matplotlib Live Streaming."
text_size: self.width + 450, None
height: self.texture_size[1]
halign: "left"
valign: "bottom"
pos_hint: {'center_x':3.1,'center_y':1.9}
Image:
id: avatar
pos_hint: {'right':6.8, 'top':5.4}
size_hint: None, None
size: 460, 285
source: "Background/Me.jpeg"
Label:
text: "https://www.satyakide.com"
text_size: self.width + 350, None
height: self.texture_size[1]
halign: "left"
valign: "bottom"
pos_hint: {'center_x':3.4,'center_y':0.9}
Image:
source: "Background/Top_Bar.png"
size: 620, 175
pos: 0, root.height 535
Button:
#: set val 'Start'
size: 112.5, 75
pos: root.width/2190, root.height120
background_color: 1,1,1,0
on_press: root.pressed(self, val, sm)
on_release: root.released(self, val)
Image:
id: s_img
text: val
source: "Background/Start_Btn.png"
center_x: self.parent.center_x 260
center_y: self.parent.center_y 415
Button:
#: set val2 'Stats'
size: 112.5, 75
pos: root.width/255, root.height120
background_color: 1,1,1,0
on_press: root.pressed(self, val2, sm)
on_release: root.released(self, val2)
Image:
id: st_img
text: val2
source: "Background/Stats_Btn.png"
center_x: self.parent.center_x 250
center_y: self.parent.center_y 415
Button:
#: set val3 'Likes'
size: 112.5, 75
pos: root.width/2+75, root.height120
background_color: 1,1,1,0
on_press: root.pressed(self, val3, sm)
on_release: root.released(self, val3)
Image:
id: lk_img
text: val3
source: "Background/Likes_Btn.png"
center_x: self.parent.center_x 240
center_y: self.parent.center_y 415

view raw

custom.kv

hosted with ❤ by GitHub

To understand this, one needs to learn how to prepare a Kivy design layout using the KV-language. You can develop the same using native-python code as well. However, I wanted to explore this language & not to mention that this is the preferred way of doing a front-end GUI design in Kivy.

Like any graphical interface, one needs to understand the layouts & the widgets that you are planning to use or build. For that, please go through the following critical documentation link on Kivy Layouts. Please go through this if you are doing this for the first time.

To pinpoint the conversation, I would like to present the documentation segment from the official site in the given picture –

Official Kivy-refernce

Since we’ve used our custom buttons & top bars, the most convenient GUI layouts will be FloatLayout for our use case. By using that layout, we can conveniently position our widgets at any random place as per our needs. At the same time, one can use nested layouts by combining different types of arrangements under another.

Some of the key lines from the above scripting files will be –

Screen:
  name: "background_1"
  Image:
      source: "Background/Background_1.png"
      allow_stretch: True
      keep_ratio: True
      size_hint_y: None
      size_hint_x: None
      width: self.parent.width
      height: self.parent.width/self.image_ratio
      FloatLayout:
          orientation: 'vertical'
          Label:
              text: "This is an application, which will consume the live streaming data inside a Kivy-based IOS-App by using Matplotlib to capture the KPIs."
              text_size: self.width + 350, None
              height: self.texture_size[1]
              halign: "left"
              valign: "bottom"
              pos_hint: {'center_x':2.9,'center_y':6.5}
          Image:
              id: homesc
              pos_hint: {'right':6, 'top':5.4}
              size_hint: None, None
              size: 560, 485
              source: "Background/FP.jpeg"

Let us understand what we discussed here & try to map that with the image.

Part of GUI defined in KV file

From the above image now, you can understand how we placed the label & image into our custom positions to create a lean & clean interface.

Image:
      source: "Background/Top_Bar.png"
      size: 620, 175
      pos: 0, root.height - 535

  Button:
      #: set val 'Start'
      size: 112.5, 75
      pos: root.width/2-190, root.height-120
      background_color: 1,1,1,0
      on_press: root.pressed(self, val, sm)
      on_release: root.released(self, val)
      Image:
          id: s_img
          text: val
          source: "Background/Start_Btn.png"
          center_x: self.parent.center_x - 260
          center_y: self.parent.center_y - 415

  Button:
      #: set val2 'Stats'
      size: 112.5, 75
      pos: root.width/2-55, root.height-120
      background_color: 1,1,1,0
      on_press: root.pressed(self, val2, sm)
      on_release: root.released(self, val2)
      Image:
          id: st_img
          text: val2
          source: "Background/Stats_Btn.png"
          center_x: self.parent.center_x - 250
          center_y: self.parent.center_y - 415

  Button:
      #: set val3 'Likes'
      size: 112.5, 75
      pos: root.width/2+75, root.height-120
      background_color: 1,1,1,0
      on_press: root.pressed(self, val3, sm)
      on_release: root.released(self, val3)
      Image:
          id: lk_img
          text: val3
          source: "Background/Likes_Btn.png"
          center_x: self.parent.center_x - 240
          center_y: self.parent.center_y - 415

Let us understand the custom buttons mapped in our Apps.

So, these are custom buttons. We placed them into specific positions & sizes by mentioning the appropriate size & position coordinates & then assigned the button methods (on_press & on_release).

However, these button methods will be present inside the main python script, which we’ll discuss after this segment.

3. main.py (Consuming Streaming data from Ably channels & captured IoT events from the simulator & publish them in Kivy-based iOS App through measured KPIs.)


##############################################
#### Updated By: SATYAKI DE ####
#### Updated On: 12-Nov-2021 ####
#### ####
#### Objective: Consuming Streaming data ####
#### from Ably channels & captured IoT ####
#### events from the simulator & publish ####
#### them in Kivy-I/OS App through ####
#### measured KPIs. ####
#### ####
##############################################
from kivy.app import App
from kivy.uix.widget import Widget
from kivy.lang import Builder
from kivy.uix.boxlayout import BoxLayout
from kivy.uix.floatlayout import FloatLayout
from kivy.clock import Clock
from kivy.core.window import Window
from kivymd.app import MDApp
import datetime as dt
import datetime
from kivy.properties import StringProperty
from kivy.vector import Vector
import regex as re
import os
os.environ["KIVY_IMAGE"]="pil"
import platform as pl
import matplotlib.pyplot as plt
import pandas as p
from matplotlib.patches import Rectangle
from matplotlib import use as mpl_use
mpl_use('module://kivy.garden.matplotlib.backend_kivy')
plt.style.use('fivethirtyeight')
# Consuming data from Ably Queue
from ably import AblyRest
# Main Class to consume streaming
import clsStreamConsume as ca
# Create the instance of the Covid API Class
x1 = ca.clsStreamConsume()
var1 = datetime.datetime.now().strftime("%Y-%m-%d_%H-%M-%S")
print('*' *60)
DInd = 'Y'
Window.size = (310, 460)
Curr_Path = os.path.dirname(os.path.realpath(__file__))
os_det = pl.system()
if os_det == "Windows":
sep = '\\'
else:
sep = '/'
def getRealTimeIoT():
try:
# Let's pass this to our map section
df = x1.conStream(var1, DInd)
print('Data:')
print(str(df))
return df
except Exception as e:
x = str(e)
print(x)
df = p.DataFrame()
return df
class MainInterface(FloatLayout):
def __init__(self, **kwargs):
super().__init__(**kwargs)
self.data = getRealTimeIoT()
self.likes = 0
self.dcMotor = 0
self.servoMotor = 0
self.minRatio = 0
plt.subplots_adjust(bottom=0.19)
#self.fig, self.ax = plt.subplots(1,1, figsize=(6.5,10))
self.fig, self.ax = plt.subplots()
self.mpl_canvas = self.fig.canvas
def on_data(self, *args):
self.ax.clear()
self.data = getRealTimeIoT()
self.ids.lk_img_1.source = Curr_Path + sep + 'Background' + sep + "Likes_Btn.png"
self.likes = self.getMaxLike(self.data)
self.ids.dynVal.text = str(self.likes)
self.ids.lk_img_1.source = ''
self.ids.lk_img_1.source = Curr_Path + sep + 'Background' + sep + "Likes_Btn_R.png"
self.dcMotor = self.getMaxDCMotor(self.data)
self.ids.dynDC.text = str(self.dcMotor)
self.servoMotor = self.getMaxServoMotor(self.data)
self.ids.dynServo.text = str(self.servoMotor)
self.minRatio = self.getDc2ServoMinRatio(self.data)
self.ids.dynMin.text = str(self.minRatio)
x = self.data['x_value']
y1 = self.data['total_1']
y2 = self.data['total_2']
self.ax.plot(x, y1, label='Channel 1', linewidth=5.0)
self.ax.plot(x, y2, label='Channel 2', linewidth=5.0)
self.mpl_canvas.draw_idle()
box = self.ids.box
box.clear_widgets()
box.add_widget(self.mpl_canvas)
return self.data
def getMaxLike(self, df):
payload = df['x_value']
a1 = str(payload.agg(['max']))
max_val = int(re.search(r'\d+', a1)[0])
return max_val
def getMaxDCMotor(self, df):
payload = df['total_1']
a1 = str(payload.agg(['max']))
max_val = int(re.search(r'\d+', a1)[0])
return max_val
def getMaxServoMotor(self, df):
payload = df['total_2']
a1 = str(payload.agg(['max']))
max_val = int(re.search(r'\d+', a1)[0])
return max_val
def getMinDCMotor(self, df):
payload = df['total_1']
a1 = str(payload.agg(['min']))
min_val = int(re.search(r'\d+', a1)[0])
return min_val
def getMinServoMotor(self, df):
payload = df['total_2']
a1 = str(payload.agg(['min']))
min_val = int(re.search(r'\d+', a1)[0])
return min_val
def getDc2ServoMinRatio(self, df):
minDC = self.getMinDCMotor(df)
minServo = self.getMinServoMotor(df)
min_ratio = round(float(minDC/minServo), 5)
return min_ratio
def update(self, *args):
self.data = self.on_data(self.data)
def pressed(self, instance, inText, SM):
if str(inText).upper() == 'START':
instance.parent.ids.s_img.source = Curr_Path + sep + 'Background' + sep + "Pressed_Start_Btn.png"
print('In Pressed: ', str(instance.parent.ids.s_img.text).upper())
if ((SM.current == "background_2") or (SM.current == "background_3")):
SM.transition.direction = "right"
SM.current= "background_1"
Clock.unschedule(self.update)
self.remove_widget(self.mpl_canvas)
elif str(inText).upper() == 'STATS':
instance.parent.ids.st_img.source = Curr_Path + sep + 'Background' + sep + "Pressed_Stats_Btn.png"
print('In Pressed: ', str(instance.parent.ids.st_img.text).upper())
if (SM.current == "background_1"):
SM.transition.direction = "left"
elif (SM.current == "background_3"):
SM.transition.direction = "right"
SM.current= "background_2"
Clock.schedule_interval(self.update, 0.1)
else:
instance.parent.ids.lk_img.source = Curr_Path + sep + 'Background' + sep + "Pressed_Likes_Btn.png"
print('In Pressed: ', str(instance.parent.ids.lk_img.text).upper())
if ((SM.current == "background_1") or (SM.current == "background_2")):
SM.transition.direction = "left"
SM.current= "background_3"
Clock.schedule_interval(self.update, 0.1)
instance.parent.ids.dynVal.text = str(self.likes)
instance.parent.ids.dynDC.text = str(self.dcMotor)
instance.parent.ids.dynServo.text = str(self.servoMotor)
instance.parent.ids.dynMin.text = str(self.minRatio)
self.remove_widget(self.mpl_canvas)
def released(self, instance, inrText):
if str(inrText).upper() == 'START':
instance.parent.ids.s_img.source = Curr_Path + sep + 'Background' + sep + "Start_Btn.png"
print('Released: ', str(instance.parent.ids.s_img.text).upper())
elif str(inrText).upper() == 'STATS':
instance.parent.ids.st_img.source = Curr_Path + sep + 'Background' + sep + "Stats_Btn.png"
print('Released: ', str(instance.parent.ids.st_img.text).upper())
else:
instance.parent.ids.lk_img.source = Curr_Path + sep + 'Background' + sep + "Likes_Btn.png"
print('Released: ', str(instance.parent.ids.lk_img.text).upper())
class CustomApp(MDApp):
def build(self):
return MainInterface()
if __name__ == "__main__":
custApp = CustomApp()
custApp.run()

view raw

main.py

hosted with ❤ by GitHub

Let us explore the main script now.

def getRealTimeIoT():
    try:
        # Let's pass this to our map section
        df = x1.conStream(var1, DInd)

        print('Data:')
        print(str(df))

        return df
    except Exception as e:
        x = str(e)
        print(x)

        df = p.DataFrame()

        return df

The above function will invoke the streaming class to consume the mock IoT live events as a pandas dataframe from the Ably queue.

class MainInterface(FloatLayout):

    def __init__(self, **kwargs):
        super().__init__(**kwargs)
        self.data = getRealTimeIoT()
        self.likes = 0
        self.dcMotor = 0
        self.servoMotor = 0
        self.minRatio = 0
        plt.subplots_adjust(bottom=0.19)

        #self.fig, self.ax = plt.subplots(1,1, figsize=(6.5,10))
        self.fig, self.ax = plt.subplots()
        self.mpl_canvas = self.fig.canvas

Application is instantiating the main class & assignments of all the critical variables, including the matplotlib class.

    def pressed(self, instance, inText, SM):

        if str(inText).upper() == 'START':
            instance.parent.ids.s_img.source = Curr_Path + sep + 'Background' + sep + "Pressed_Start_Btn.png"
            print('In Pressed: ', str(instance.parent.ids.s_img.text).upper())
            if ((SM.current == "background_2") or (SM.current == "background_3")):
                SM.transition.direction = "right"
            SM.current= "background_1"
            Clock.unschedule(self.update)
            self.remove_widget(self.mpl_canvas)

We’ve taken one of the button events & captured how the application will behave once someone clicks the Start button & how it will bring all the corresponding elements of a static page. It also explained the transition type between screens.

        elif str(inText).upper() == 'STATS':

            instance.parent.ids.st_img.source = Curr_Path + sep + 'Background' + sep + "Pressed_Stats_Btn.png"
            print('In Pressed: ', str(instance.parent.ids.st_img.text).upper())
            if (SM.current == "background_1"):
                SM.transition.direction = "left"
            elif (SM.current == "background_3"):
                SM.transition.direction = "right"
            SM.current= "background_2"
            Clock.schedule_interval(self.update, 0.1)

The next screen invokes the dynamic & real-time content. So, please pay extra attention to the following line –

Clock.schedule_interval(self.update, 0.1)

This line will invoke the update function, which looks like –

    def update(self, *args):
        self.data = self.on_data(self.data)

Here is the logic for the update function, which will invoke another function named – “on_data“.

    def on_data(self, *args):
        self.ax.clear()
        self.data = getRealTimeIoT()

        self.ids.lk_img_1.source = Curr_Path + sep + 'Background' + sep + "Likes_Btn.png"
        self.likes = self.getMaxLike(self.data)
        self.ids.dynVal.text = str(self.likes)
        self.ids.lk_img_1.source = ''
        self.ids.lk_img_1.source = Curr_Path + sep + 'Background' + sep + "Likes_Btn_R.png"

        self.dcMotor = self.getMaxDCMotor(self.data)
        self.ids.dynDC.text = str(self.dcMotor)

        self.servoMotor = self.getMaxServoMotor(self.data)
        self.ids.dynServo.text = str(self.servoMotor)

        self.minRatio = self.getDc2ServoMinRatio(self.data)
        self.ids.dynMin.text = str(self.minRatio)

        x = self.data['x_value']
        y1 = self.data['total_1']
        y2 = self.data['total_2']

        self.ax.plot(x, y1, label='Channel 1', linewidth=5.0)
        self.ax.plot(x, y2, label='Channel 2', linewidth=5.0)

        self.mpl_canvas.draw_idle()

        box = self.ids.box
        box.clear_widgets()
        box.add_widget(self.mpl_canvas)

        return self.data

The above crucial line shows how we capture the live calculation & assign them into matplotlib plots & finally assign that figure canvas of matplotlib to a box widget as per our size & display the change content whenever it invokes this method.

Rests of the functions are pretty self-explanatory. So, I’m not going to discuss them.


Run:

Let’s run the app & see the output –

STEP – 1

Triggering the mock IoT App

STEP – 2

Triggering the iOS App

STEP – 3


So, we’ve done it.

You will get the complete codebase in the following Github link.

I’ll bring some more exciting topic in the coming days from the Python verse. Please share & subscribe my post & let me know your feedback.

Till then, Happy Avenging!


Note: All the data & scenario posted here are representational data & scenarios & available over the internet & for educational purpose only. Some of the images (except my photo) that we’ve used are available over the net. We don’t claim the ownership of these images. There is an always room for improvement & especially all the GUI components size & position that will be dynamic in nature by defining self.width along with some constant values.

Projecting real-time KPIs by ingesting streaming events from emulated IoT-device

Today, I am planning to demonstrate an IoT use case implemented in Python. I was waiting for my Raspberry Pi to arrive. However, the product that I received was not working as expected. Perhaps, some hardware malfunction. Hence, I was looking for a way to continue with my installment even without the hardware.

I was looking for an alternative way to use an online Raspberry Pi emulator. Recently, Microsoft has introduced integrated Raspberry Pi, which you can directly integrate with Azure IoT. However, I couldn’t find any API, which I could leverage on my Python application.

So, I explored all the possible options & finally come-up with the idea of creating my own IoT-Emulator, which can integrate with any application. With the help from the online materials, I have customized & enhanced them as per my use case & finally come up with this clean application that will demonstrate this use case with clarity.

We’ll showcase this real-time use case, where we would try to capture the events generated by IoT in a real-time dashboard, where the values in the visual display points will be affected as soon as the source data changes.


However, I would like to share the run before we dig deep into this.

Demo

Isn’t this exciting? How we can use our custom-built IoT emulator & captures real-time events to Ably Queue, then transform those raw events into more meaningful KPIs. Let’s deep dive then.


Architecture:

Let’s explore the architecture –

Fig – 1

As you can see, the green box is a demo IoT application that generates events & pushes them into the Ably Queue. At the same time, Dashboard consumes the events & transforms them into more meaningful metrics.


Package Installation:

Let us understand the sample packages that require for this task.

Step – 1:

Installation

Step – 2:

Installation – Continue

And, here is the command to install those packages –

pip install dash==1.0.0
pip install numpy==1.16.4
pip install pandas==0.24.2
pip install scipy==1.3.0
pip install gunicorn==19.9.0
pip install ably==1.1.1
pip install tkgpio==0.1

Code:

Since this is an extension to our previous post, we’re not going to discuss other scripts, which we’ve already discussed over there. Instead, we will talk about the enhanced scripts & the new scripts that require for this use case.

1. clsConfig.py (This native Python script contains the configuration entries.)


################################################
#### Written By: SATYAKI DE ####
#### Written On: 15-May-2020 ####
#### Modified On: 25-Sep-2021 ####
#### ####
#### Objective: This script is a config ####
#### file, contains all the keys for ####
#### Machine-Learning & streaming dashboard.####
#### ####
################################################
import os
import platform as pl
class clsConfig(object):
Curr_Path = os.path.dirname(os.path.realpath(__file__))
os_det = pl.system()
if os_det == "Windows":
sep = '\\'
else:
sep = '/'
conf = {
'APP_ID': 1,
'ARCH_DIR': Curr_Path + sep + 'arch' + sep,
'PROFILE_PATH': Curr_Path + sep + 'profile' + sep,
'LOG_PATH': Curr_Path + sep + 'log' + sep,
'REPORT_PATH': Curr_Path + sep + 'report',
'FILE_NAME': Curr_Path + sep + 'data' + sep + 'TradeIn.csv',
'SRC_PATH': Curr_Path + sep + 'data' + sep,
'JSONFileNameWithPath': Curr_Path + sep + 'GUI_Config' + sep + 'CircuitConfiguration.json',
'APP_DESC_1': 'Dash Integration with Ably!',
'DEBUG_IND': 'N',
'INIT_PATH': Curr_Path,
'SUBDIR' : 'data',
'ABLY_ID': 'WWP309489.93jfkT:32kkdhdJjdued79e',
"URL":"https://corona-api.com/countries/&quot;,
"appType":"application/json",
"conType":"keep-alive",
"limRec": 50,
"CACHE":"no-cache",
"MAX_RETRY": 3,
"coList": "DE, IN, US, CA, GB, ID, BR",
"FNC": "NewConfirmed",
"TMS": "ReportedDate",
"FND": "NewDeaths",
"FinData": "Cache.csv"
}

view raw

clsConfig.py

hosted with ❤ by GitHub

A few of the new entries, which are essential to this task are -> ABLY_ID, FinData & JSONFileNameWithPath.

2. clsPublishStream.py (This script will publish real-time streaming data coming out from a hosted API sources using another popular third-party service named Ably. Ably mimics pubsub Streaming concept, which might be extremely useful for any start-ups.)


###############################################################
#### ####
#### Written By: Satyaki De ####
#### Written Date: 26-Jul-2021 ####
#### Modified Date: 08-Sep-2021 ####
#### ####
#### Objective: This script will publish real-time ####
#### streaming data coming out from a hosted API ####
#### sources using another popular third-party service ####
#### named Ably. Ably mimics pubsub Streaming concept, ####
#### which might be extremely useful for any start-ups. ####
#### ####
###############################################################
from ably import AblyRest
import logging
import json
from random import seed
from random import random
import json
import math
import random
from clsConfig import clsConfig as cf
seed(1)
# Global Section
logger = logging.getLogger('ably')
logger.addHandler(logging.StreamHandler())
ably_id = str(cf.conf['ABLY_ID'])
ably = AblyRest(ably_id)
channel = ably.channels.get('sd_channel')
# End Of Global Section
class clsPublishStream:
def __init__(self):
self.msgSize = cf.conf['limRec']
def pushEvents(self, srcJSON, debugInd, varVa):
try:
msgSize = self.msgSize
# Capturing the inbound dataframe
jdata_fin = json.dumps(srcJSON)
print('IOT Events: ')
print(str(jdata_fin))
# Publish rest of the messages to the sd_channel channel
channel.publish('event', jdata_fin)
jdata_fin = ''
return 0
except Exception as e:
x = str(e)
print(x)
logging.info(x)
return 1

We’re not going to discuss this as we’ve already discussed in my previous post.

3. clsStreamConsume.py (Consuming Streaming data from Ably channels.)


##############################################
#### Written By: SATYAKI DE ####
#### Written On: 26-Jul-2021 ####
#### Modified On 08-Sep-2021 ####
#### ####
#### Objective: Consuming Streaming data ####
#### from Ably channels published by the ####
#### playIOTDevice.py ####
#### ####
##############################################
import json
from clsConfig import clsConfig as cf
import requests
import logging
import time
import pandas as p
import clsL as cl
from ably import AblyRest
# Initiating Log class
l = cl.clsL()
class clsStreamConsume:
def __init__(self):
self.ably_id = str(cf.conf['ABLY_ID'])
self.fileName = str(cf.conf['FinData'])
def conStream(self, varVa, debugInd):
try:
ably_id = self.ably_id
fileName = self.fileName
var = varVa
debug_ind = debugInd
# Fetching the data
client = AblyRest(ably_id)
channel = client.channels.get('sd_channel')
message_page = channel.history()
# Counter Value
cnt = 0
# Declaring Global Data-Frame
df_conv = p.DataFrame()
for i in message_page.items:
print('Last Msg: {}'.format(i.data))
json_data = json.loads(i.data)
#jdata = json.dumps(json_data)
# Converting String to Dictionary
dict_json = eval(json_data)
# Converting JSON to Dataframe
#df = p.json_normalize(json_data)
#df.columns = df.columns.map(lambda x: x.split(".")[-1])
df = p.DataFrame.from_dict(dict_json, orient='index')
#print('DF Inside:')
#print(df)
if cnt == 0:
df_conv = df
else:
d_frames = [df_conv, df]
df_conv = p.concat(d_frames)
cnt += 1
# Resetting the Index Value
df_conv.reset_index(drop=True, inplace=True)
# This will check whether the current load is happening
# or not. Based on that, it will capture the old events
# from cache.
if df_conv.empty:
df_conv = p.read_csv(fileName, index = True)
else:
l.logr(fileName, debug_ind, df_conv, 'log')
return df_conv
except Exception as e:
x = str(e)
print('Error: ', x)
logging.info(x)
# This will handle the error scenaio as well.
# Based on that, it will capture the old events
# from cache.
try:
df_conv = p.read_csv(fileName, index = True)
except:
df = p.DataFrame()
return df

We’re not going to discuss this as we’ve already discussed in my previous post.

4. CircuitConfiguration.json (Configuration file for GUI Interface for IoT Simulator.)


{
"name":"Analog Device",
"width":700,
"height":350,
"leds":[
{
"x":105,
"y":80,
"name":"LED",
"pin":21
}
],
"motors":[
{
"x":316,
"y":80,
"name":"DC Motor",
"forward_pin":22,
"backward_pin":23
}
],
"servos":[
{
"x":537,
"y":80,
"name":"Servo Motor",
"pin":24,
"min_angle":-180,
"max_angle":180,
"initial_angle":20
}
],
"adc":{
"mcp_chip":3008,
"potenciometers":[
{
"x":40,
"y":200,
"name":"Brightness Potentiometer",
"channel":0
},
{
"x":270,
"y":200,
"name":"Speed Potentiometer",
"channel":2
},
{
"x":500,
"y":200,
"name":"Angle Potentiometer",
"channel":6
}
]
},
"toggles":[
{
"x":270,
"y":270,
"name":"Direction Toggle Switch",
"pin":15,
"off_label":"backward",
"on_label":"forward",
"is_on":false
}
],
"labels":[
{
"x":15,
"y":35,
"width":25,
"height":18,
"borderwidth":2,
"relief":"solid"
},
{
"x":56,
"y":26,
"text":"Brightness Control"
},
{
"x":245,
"y":35,
"width":25,
"height":18,
"borderwidth":2,
"relief":"solid"
},
{
"x":298,
"y":26,
"text":"Speed Control"
},
{
"x":475,
"y":35,
"width":25,
"height":18,
"borderwidth":2,
"relief":"solid"
},
{
"x":531,
"y":26,
"text":"Angle Control"
}
]
}

This json configuration will be used by the next python class.

5. clsBuildCircuit.py (Calling Tk Circuit API.)


##############################################
#### Written By: SATYAKI DE ####
#### Written On: 25-Sep-2021 ####
#### Modified On 25-Sep-2021 ####
#### ####
#### Objective: Calling Tk Circuit API ####
##############################################
from tkgpio import TkCircuit
from json import load
from clsConfig import clsConfig as cf
fileName = str(cf.conf['JSONFileNameWithPath'])
print('File Name: ', str(fileName))
# initialize the circuit inside the GUI
with open(fileName, "r") as file:
config = load(file)
class clsBuildCircuit:
def __init__(self):
self.config = config
def genCir(self, main_function):
try:
config = self.config
circuit = TkCircuit(config)
circuit.run(main_function)
return circuit
except Exception as e:
x = str(e)
print(x)
return ''

Key snippets from the above script –

config = self.config
circuit = TkCircuit(config)
circuit.run(main_function)

The above lines will create an instance of simulated IoT circuits & then it will use the json file to start the GUI class.

6. playIOTDevice.py (Main Circuit GUI script to create an IoT Device to generate the events, which will consumed.)


###############################################
#### Written By: SATYAKI DE ####
#### Written On: 25-Sep-2021 ####
#### Modified On 25-Sep-2021 ####
#### ####
#### Objective: Main Tk Circuit GUI script ####
#### to create an IOT Device to generate ####
#### the events, which will consumed. ####
###############################################
# We keep the setup code in a different class as shown below.
import clsBuildCircuit as csb
import json
import clsPublishStream as cps
import datetime
from clsConfig import clsConfig as cf
import logging
###############################################
### Global Section ###
###############################################
# Initiating Ably class to push events
x1 = cps.clsPublishStream()
# Create the instance of the Tk Circuit API Class.
circuit = csb.clsBuildCircuit()
###############################################
### End of Global Section ###
###############################################
# Invoking the IOT Device Generator.
@circuit.genCir
def main():
from gpiozero import PWMLED, Motor, Servo, MCP3008, Button
from time import sleep
# Circuit Components
ledAlert = PWMLED(21)
dcMotor = Motor(22, 23)
servoMotor = Servo(24)
ioMeter1 = MCP3008(0)
ioMeter2 = MCP3008(2)
ioMeter3 = MCP3008(6)
switch = Button(15)
# End of circuit components
# Other useful variables
cnt = 1
idx = 0
debugInd = 'Y'
var = datetime.datetime.now().strftime("%Y-%m-%d_%H-%M-%S")
# End of useful variables
# Initiating Log Class
general_log_path = str(cf.conf['LOG_PATH'])
msgSize = int(cf.conf['limRec'])
# Enabling Logging Info
logging.basicConfig(filename=general_log_path + 'IOTDevice.log', level=logging.INFO)
while True:
ledAlert.value = ioMeter1.value
if switch.is_pressed:
dcMotor.forward(ioMeter2.value)
xVal = 'Motor Forward'
else:
dcMotor.backward(ioMeter2.value)
xVal = 'Motor Backward'
servoMotor.value = 1 2 * ioMeter3.value
srcJson = {
"LedMeter": ledAlert.value,
"DCMeter": ioMeter2.value,
"ServoMeter": ioMeter3.value,
"SwitchStatus": switch.is_pressed,
"DCMotorPos": xVal,
"ServoMotor": servoMotor.value
}
tmpJson = str(srcJson)
if cnt == 1:
srcJsonMast = '{' + '"' + str(idx) + '":'+ tmpJson
elif cnt == msgSize:
srcJsonMast = srcJsonMast + '}'
print('JSON: ')
print(str(srcJsonMast))
# Pushing both the Historical Confirmed Cases
retVal_1 = x1.pushEvents(srcJsonMast, debugInd, var)
if retVal_1 == 0:
print('Successfully IOT event pushed!')
else:
print('Failed to push IOT events!')
srcJsonMast = ''
tmpJson = ''
cnt = 0
idx = 1
srcJson = {}
retVal_1 = 0
else:
srcJsonMast = srcJsonMast + ',' + '"' + str(idx) + '":'+ tmpJson
cnt += 1
idx += 1
sleep(0.05)

Lets’ explore the key snippets –

ledAlert = PWMLED(21)
dcMotor = Motor(22, 23)
servoMotor = Servo(24)

It defines three motors that include Servo, DC & LED.

Now, we can see the following sets of the critical snippet –

ledAlert.value = ioMeter1.value

if switch.is_pressed:
    dcMotor.forward(ioMeter2.value)
    xVal = 'Motor Forward'
else:
    dcMotor.backward(ioMeter2.value)
    xVal = 'Motor Backward'

servoMotor.value = 1 - 2 * ioMeter3.value

srcJson = {
"LedMeter": ledAlert.value,
"DCMeter": ioMeter2.value,
"ServoMeter": ioMeter3.value,
"SwitchStatus": switch.is_pressed,
"DCMotorPos": xVal,
"ServoMotor": servoMotor.value
}

Following lines will dynamically generates JSON that will be passed into the Ably queue –

tmpJson = str(srcJson)

if cnt == 1:
    srcJsonMast = '{' + '"' + str(idx) + '":'+ tmpJson
elif cnt == msgSize:
    srcJsonMast = srcJsonMast + '}'
    print('JSON: ')
    print(str(srcJsonMast))

Final line from the above script –

# Pushing both the Historical Confirmed Cases
retVal_1 = x1.pushEvents(srcJsonMast, debugInd, var)

This code will now push the events into the Ably Queue.

7. app.py (Consuming Streaming data from Ably channels & captured IOT events from the simulator & publish them in Dashboard through measured KPIs.)


##############################################
#### Updated By: SATYAKI DE ####
#### Updated On: 02-Oct-2021 ####
#### ####
#### Objective: Consuming Streaming data ####
#### from Ably channels & captured IOT ####
#### events from the simulator & publish ####
#### them in Dashboard through measured ####
#### KPIs. ####
#### ####
##############################################
import os
import pathlib
import numpy as np
import datetime as dt
import dash
from dash import dcc
from dash import html
import datetime
import dash_daq as daq
from dash.exceptions import PreventUpdate
from dash.dependencies import Input, Output, State
from scipy.stats import rayleigh
# Consuming data from Ably Queue
from ably import AblyRest
# Main Class to consume streaming
import clsStreamConsume as ca
# Create the instance of the Covid API Class
x1 = ca.clsStreamConsume()
var1 = datetime.datetime.now().strftime("%Y-%m-%d_%H-%M-%S")
print('*' *60)
DInd = 'Y'
GRAPH_INTERVAL = os.environ.get("GRAPH_INTERVAL", 5000)
app = dash.Dash(
__name__,
meta_tags=[{"name": "viewport", "content": "width=device-width, initial-scale=1"}],
)
app.title = "IOT Device Dashboard"
server = app.server
app_color = {"graph_bg": "#082255", "graph_line": "#007ACE"}
app.layout = html.Div(
[
# header
html.Div(
[
html.Div(
[
html.H4("IOT DEVICE STREAMING", className="app__header__title"),
html.P(
"This app continually consumes streaming data from IOT-Device and displays live charts of various metrics & KPI associated with it.",
className="app__header__title–grey",
),
],
className="app__header__desc",
),
html.Div(
[
html.A(
html.Button("SOURCE CODE", className="link-button"),
href="https://github.com/SatyakiDe2019/IOTStream&quot;,
),
html.A(
html.Button("VIEW DEMO", className="link-button"),
href="https://github.com/SatyakiDe2019/IOTStream/blob/main/demo.gif&quot;,
),
html.A(
html.Img(
src=app.get_asset_url("dash-new-logo.png"),
className="app__menu__img",
),
href="https://plotly.com/dash/&quot;,
),
],
className="app__header__logo",
),
],
className="app__header",
),
html.Div(
[
# Motor Speed
html.Div(
[
html.Div(
[html.H6("SERVO METER (IOT)", className="graph__title")]
),
dcc.Graph(
id="iot-measure",
figure=dict(
layout=dict(
plot_bgcolor=app_color["graph_bg"],
paper_bgcolor=app_color["graph_bg"],
)
),
),
dcc.Interval(
id="iot-measure-update",
interval=int(GRAPH_INTERVAL),
n_intervals=0,
),
# Second Panel
html.Div(
[html.H6("DC-MOTOR (IOT)", className="graph__title")]
),
dcc.Graph(
id="iot-measure-1",
figure=dict(
layout=dict(
plot_bgcolor=app_color["graph_bg"],
paper_bgcolor=app_color["graph_bg"],
)
),
),
dcc.Interval(
id="iot-measure-update-1",
interval=int(GRAPH_INTERVAL),
n_intervals=0,
)
],
className="two-thirds column motor__speed__container",
),
html.Div(
[
# histogram
html.Div(
[
html.Div(
[
html.H6(
"MOTOR POWER HISTOGRAM",
className="graph__title",
)
]
),
html.Div(
[
dcc.Slider(
id="bin-slider",
min=1,
max=60,
step=1,
value=20,
updatemode="drag",
marks={
20: {"label": "20"},
40: {"label": "40"},
60: {"label": "60"},
},
)
],
className="slider",
),
html.Div(
[
dcc.Checklist(
id="bin-auto",
options=[
{"label": "Auto", "value": "Auto"}
],
value=["Auto"],
inputClassName="auto__checkbox",
labelClassName="auto__label",
),
html.P(
"# of Bins: Auto",
id="bin-size",
className="auto__p",
),
],
className="auto__container",
),
dcc.Graph(
id="motor-histogram",
figure=dict(
layout=dict(
plot_bgcolor=app_color["graph_bg"],
paper_bgcolor=app_color["graph_bg"],
)
),
),
],
className="graph__container first",
),
# motor direction
html.Div(
[
html.Div(
[
html.H6(
"SERVO MOTOR DIRECTION", className="graph__title"
)
]
),
dcc.Graph(
id="servo-motor-direction",
figure=dict(
layout=dict(
plot_bgcolor=app_color["graph_bg"],
paper_bgcolor=app_color["graph_bg"],
)
),
),
],
className="graph__container second",
),
],
className="one-third column histogram__direction",
),
],
className="app__content",
),
],
className="app__container",
)
def toPositive(row, flag):
try:
if flag == 'ServoMeter':
x_val = abs(float(row['ServoMotor']))
elif flag == 'DCMotor':
x_val = abs(float(row['DCMotor'])) * 0.001
return x_val
except Exception as e:
x = str(e)
print(x)
val = 0
return val
def toPositiveInflated(row, flag):
try:
if flag == 'ServoMeter':
x_val = abs(float(row['ServoMeter'])) * 100
elif flag == 'DCMotor':
x_val = abs(float(row['DCMeter'])) * 100
return x_val
except Exception as e:
x = str(e)
print(x)
val = 0
return val
def getData(var, Ind):
try:
# Let's pass this to our map section
df = x1.conStream(var, Ind)
df['ServoMeterNew'] = df.apply(lambda row: toPositiveInflated(row, 'ServoMeter'), axis=1)
df['ServoMotorNew'] = df.apply(lambda row: toPositive(row, 'ServoMeter'), axis=1)
df['DCMotor'] = df.apply(lambda row: toPositiveInflated(row, 'DCMotor'), axis=1)
df['DCMeterNew'] = df.apply(lambda row: toPositive(row, 'DCMotor'), axis=1)
# Dropping old columns
df.drop(columns=['ServoMeter','ServoMotor','DCMeter'], axis=1, inplace=True)
#Rename New Columns to Old Columns
df.rename(columns={'ServoMeterNew':'ServoMeter'}, inplace=True)
df.rename(columns={'ServoMotorNew':'ServoMotor'}, inplace=True)
df.rename(columns={'DCMeterNew':'DCMeter'}, inplace=True)
return df
except Exception as e:
x = str(e)
print(x)
df = p.DataFrame()
return df
@app.callback(
Output("iot-measure-1", "figure"), [Input("iot-measure-update", "n_intervals")]
)
def gen_iot_speed(interval):
"""
Generate the DC Meter graph.
:params interval: update the graph based on an interval
"""
# Let's pass this to our map section
df = getData(var1, DInd)
trace = dict(
type="scatter",
y=df["DCMotor"],
line={"color": "#42C4F7"},
hoverinfo="skip",
error_y={
"type": "data",
"array": df["DCMeter"],
"thickness": 1.5,
"width": 2,
"color": "#B4E8FC",
},
mode="lines",
)
layout = dict(
plot_bgcolor=app_color["graph_bg"],
paper_bgcolor=app_color["graph_bg"],
font={"color": "#fff"},
height=400,
xaxis={
"range": [0, 200],
"showline": True,
"zeroline": False,
"fixedrange": True,
"tickvals": [0, 50, 100, 150, 200],
"ticktext": ["200", "150", "100", "50", "0"],
"title": "Time Elapsed (sec)",
},
yaxis={
"range": [
min(0, min(df["DCMotor"])),
max(100, max(df["DCMotor"]) + max(df["DCMeter"])),
],
"showgrid": True,
"showline": True,
"fixedrange": True,
"zeroline": False,
"gridcolor": app_color["graph_line"],
"nticks": max(6, round(df["DCMotor"].iloc[1] / 10)),
},
)
return dict(data=[trace], layout=layout)
@app.callback(
Output("iot-measure", "figure"), [Input("iot-measure-update", "n_intervals")]
)
def gen_iot_speed(interval):
"""
Generate the Motor Speed graph.
:params interval: update the graph based on an interval
"""
# Let's pass this to our map section
df = getData(var1, DInd)
trace = dict(
type="scatter",
y=df["ServoMeter"],
line={"color": "#42C4F7"},
hoverinfo="skip",
error_y={
"type": "data",
"array": df["ServoMotor"],
"thickness": 1.5,
"width": 2,
"color": "#B4E8FC",
},
mode="lines",
)
layout = dict(
plot_bgcolor=app_color["graph_bg"],
paper_bgcolor=app_color["graph_bg"],
font={"color": "#fff"},
height=400,
xaxis={
"range": [0, 200],
"showline": True,
"zeroline": False,
"fixedrange": True,
"tickvals": [0, 50, 100, 150, 200],
"ticktext": ["200", "150", "100", "50", "0"],
"title": "Time Elapsed (sec)",
},
yaxis={
"range": [
min(0, min(df["ServoMeter"])),
max(100, max(df["ServoMeter"]) + max(df["ServoMotor"])),
],
"showgrid": True,
"showline": True,
"fixedrange": True,
"zeroline": False,
"gridcolor": app_color["graph_line"],
"nticks": max(6, round(df["ServoMeter"].iloc[1] / 10)),
},
)
return dict(data=[trace], layout=layout)
@app.callback(
Output("servo-motor-direction", "figure"), [Input("iot-measure-update", "n_intervals")]
)
def gen_motor_direction(interval):
"""
Generate the Servo direction graph.
:params interval: update the graph based on an interval
"""
df = getData(var1, DInd)
val = df["ServoMeter"].iloc[1]
direction = [0, (df["ServoMeter"][0]*100 20), (df["ServoMeter"][0]*100 + 20), 0]
traces_scatterpolar = [
{"r": [0, val, val, 0], "fillcolor": "#084E8A"},
{"r": [0, val * 0.65, val * 0.65, 0], "fillcolor": "#B4E1FA"},
{"r": [0, val * 0.3, val * 0.3, 0], "fillcolor": "#EBF5FA"},
]
data = [
dict(
type="scatterpolar",
r=traces["r"],
theta=direction,
mode="lines",
fill="toself",
fillcolor=traces["fillcolor"],
line={"color": "rgba(32, 32, 32, .6)", "width": 1},
)
for traces in traces_scatterpolar
]
layout = dict(
height=350,
plot_bgcolor=app_color["graph_bg"],
paper_bgcolor=app_color["graph_bg"],
font={"color": "#fff"},
autosize=False,
polar={
"bgcolor": app_color["graph_line"],
"radialaxis": {"range": [0, 45], "angle": 45, "dtick": 10},
"angularaxis": {"showline": False, "tickcolor": "white"},
},
showlegend=False,
)
return dict(data=data, layout=layout)
@app.callback(
Output("motor-histogram", "figure"),
[Input("iot-measure-update", "n_intervals")],
[
State("iot-measure", "figure"),
State("bin-slider", "value"),
State("bin-auto", "value"),
],
)
def gen_motor_histogram(interval, iot_speed_figure, slider_value, auto_state):
"""
Genererate iot histogram graph.
:params interval: upadte the graph based on an interval
:params iot_speed_figure: current Motor Speed graph
:params slider_value: current slider value
:params auto_state: current auto state
"""
motor_val = []
try:
print('Inside gen_motor_histogram:')
print('iot_speed_figure::')
print(iot_speed_figure)
# Check to see whether iot-measure has been plotted yet
if iot_speed_figure is not None:
motor_val = iot_speed_figure["data"][0]["y"]
if "Auto" in auto_state:
bin_val = np.histogram(
motor_val,
bins=range(int(round(min(motor_val))), int(round(max(motor_val)))),
)
else:
bin_val = np.histogram(motor_val, bins=slider_value)
except Exception as error:
raise PreventUpdate
avg_val = float(sum(motor_val)) / len(motor_val)
median_val = np.median(motor_val)
pdf_fitted = rayleigh.pdf(
bin_val[1], loc=(avg_val) * 0.55, scale=(bin_val[1][1] bin_val[1][0]) / 3
)
y_val = (pdf_fitted * max(bin_val[0]) * 20,)
y_val_max = max(y_val[0])
bin_val_max = max(bin_val[0])
trace = dict(
type="bar",
x=bin_val[1],
y=bin_val[0],
marker={"color": app_color["graph_line"]},
showlegend=False,
hoverinfo="x+y",
)
traces_scatter = [
{"line_dash": "dash", "line_color": "#2E5266", "name": "Average"},
{"line_dash": "dot", "line_color": "#BD9391", "name": "Median"},
]
scatter_data = [
dict(
type="scatter",
x=[bin_val[int(len(bin_val) / 2)]],
y=[0],
mode="lines",
line={"dash": traces["line_dash"], "color": traces["line_color"]},
marker={"opacity": 0},
visible=True,
name=traces["name"],
)
for traces in traces_scatter
]
trace3 = dict(
type="scatter",
mode="lines",
line={"color": "#42C4F7"},
y=y_val[0],
x=bin_val[1][: len(bin_val[1])],
name="Rayleigh Fit",
)
layout = dict(
height=350,
plot_bgcolor=app_color["graph_bg"],
paper_bgcolor=app_color["graph_bg"],
font={"color": "#fff"},
xaxis={
"title": "Motor Power",
"showgrid": False,
"showline": False,
"fixedrange": True,
},
yaxis={
"showgrid": False,
"showline": False,
"zeroline": False,
"title": "Number of Samples",
"fixedrange": True,
},
autosize=True,
bargap=0.01,
bargroupgap=0,
hovermode="closest",
legend={
"orientation": "h",
"yanchor": "bottom",
"xanchor": "center",
"y": 1,
"x": 0.5,
},
shapes=[
{
"xref": "x",
"yref": "y",
"y1": int(max(bin_val_max, y_val_max)) + 0.5,
"y0": 0,
"x0": avg_val,
"x1": avg_val,
"type": "line",
"line": {"dash": "dash", "color": "#2E5266", "width": 5},
},
{
"xref": "x",
"yref": "y",
"y1": int(max(bin_val_max, y_val_max)) + 0.5,
"y0": 0,
"x0": median_val,
"x1": median_val,
"type": "line",
"line": {"dash": "dot", "color": "#BD9391", "width": 5},
},
],
)
return dict(data=[trace, scatter_data[0], scatter_data[1], trace3], layout=layout)
@app.callback(
Output("bin-auto", "value"),
[Input("bin-slider", "value")],
[State("iot-measure", "figure")],
)
def deselect_auto(slider_value, iot_speed_figure):
""" Toggle the auto checkbox. """
# prevent update if graph has no data
if "data" not in iot_speed_figure:
raise PreventUpdate
if not len(iot_speed_figure["data"]):
raise PreventUpdate
if iot_speed_figure is not None and len(iot_speed_figure["data"][0]["y"]) > 5:
return [""]
return ["Auto"]
@app.callback(
Output("bin-size", "children"),
[Input("bin-auto", "value")],
[State("bin-slider", "value")],
)
def show_num_bins(autoValue, slider_value):
""" Display the number of bins. """
if "Auto" in autoValue:
return "# of Bins: Auto"
return "# of Bins: " + str(int(slider_value))
if __name__ == "__main__":
app.run_server(debug=True)

view raw

app.py

hosted with ❤ by GitHub

Here are the key snippets –

html.Div(
        [
            html.Div(
                [html.H6("SERVO METER (IOT)", className="graph__title")]
            ),
            dcc.Graph(
                id="iot-measure",
                figure=dict(
                    layout=dict(
                        plot_bgcolor=app_color["graph_bg"],
                        paper_bgcolor=app_color["graph_bg"],
                    )
                ),
            ),
            dcc.Interval(
                id="iot-measure-update",
                interval=int(GRAPH_INTERVAL),
                n_intervals=0,
            ),
            # Second Panel
            html.Div(
                [html.H6("DC-MOTOR (IOT)", className="graph__title")]
            ),
            dcc.Graph(
                id="iot-measure-1",
                figure=dict(
                    layout=dict(
                        plot_bgcolor=app_color["graph_bg"],
                        paper_bgcolor=app_color["graph_bg"],
                    )
                ),
            ),
            dcc.Interval(
                id="iot-measure-update-1",
                interval=int(GRAPH_INTERVAL),
                n_intervals=0,
            )
        ],
        className="two-thirds column motor__speed__container",

The following line creates two panels, where the application will consume the streaming data by the app’s call-back feature & refresh the data & graphs as & when the application receives the streaming data.

A similar approach was adopted for other vital aspects/components inside the dashboard.

def getData(var, Ind):
    try:
        # Let's pass this to our map section
        df = x1.conStream(var, Ind)

        df['ServoMeterNew'] = df.apply(lambda row: toPositiveInflated(row, 'ServoMeter'), axis=1)
        df['ServoMotorNew'] = df.apply(lambda row: toPositive(row, 'ServoMeter'), axis=1)
        df['DCMotor'] = df.apply(lambda row: toPositiveInflated(row, 'DCMotor'), axis=1)
        df['DCMeterNew'] = df.apply(lambda row: toPositive(row, 'DCMotor'), axis=1)

        # Dropping old columns
        df.drop(columns=['ServoMeter','ServoMotor','DCMeter'], axis=1, inplace=True)

        #Rename New Columns to Old Columns
        df.rename(columns={'ServoMeterNew':'ServoMeter'}, inplace=True)
        df.rename(columns={'ServoMotorNew':'ServoMotor'}, inplace=True)
        df.rename(columns={'DCMeterNew':'DCMeter'}, inplace=True)

        return df
    except Exception as e:
        x = str(e)
        print(x)

        df = p.DataFrame()

        return df

The application is extracting streaming data & consuming it from the Ably queue.

@app.callback(
    Output("iot-measure", "figure"), [Input("iot-measure-update", "n_intervals")]
)
def gen_iot_speed(interval):
    """
    Generate the Motor Speed graph.

    :params interval: update the graph based on an interval
    """

    # Let's pass this to our map section
    df = getData(var1, DInd)

    trace = dict(
        type="scatter",
        y=df["ServoMeter"],
        line={"color": "#42C4F7"},
        hoverinfo="skip",
        error_y={
            "type": "data",
            "array": df["ServoMotor"],
            "thickness": 1.5,
            "width": 2,
            "color": "#B4E8FC",
        },
        mode="lines",
    )

    layout = dict(
        plot_bgcolor=app_color["graph_bg"],
        paper_bgcolor=app_color["graph_bg"],
        font={"color": "#fff"},
        height=400,
        xaxis={
            "range": [0, 200],
            "showline": True,
            "zeroline": False,
            "fixedrange": True,
            "tickvals": [0, 50, 100, 150, 200],
            "ticktext": ["200", "150", "100", "50", "0"],
            "title": "Time Elapsed (sec)",
        },
        yaxis={
            "range": [
                min(0, min(df["ServoMeter"])),
                max(100, max(df["ServoMeter"]) + max(df["ServoMotor"])),
            ],
            "showgrid": True,
            "showline": True,
            "fixedrange": True,
            "zeroline": False,
            "gridcolor": app_color["graph_line"],
            "nticks": max(6, round(df["ServoMeter"].iloc[-1] / 10)),
        },
    )

    return dict(data=[trace], layout=layout)

Capturing all the relevant columns & transform them into a graph, where the application will consume data into both the axis (x-axis & y-axis).

There are many other useful snippets, which creates separate useful widgets inside the dashboard.


Run:

Let us run the application –

Dashboard-View

So, we’ve done it.

You will get the complete codebase in the following Github link.

There is an excellent resource from the dash framework, which you should explore. The following link would be handy for developers who want to get some meaningful pre-built dashboard template, which you can customize as per your need through Python or R. Please find the link here.


I’ll bring some more exciting topic in the coming days from the Python verse.

Till then, Happy Avenging! 😀


Note: All the data & scenario posted here are representational data & scenarios & available over the internet & for educational purpose only.

One more thing you need to understand is that this prediction based on limited data points. The actual event may happen differently. Ideally, countries are taking a cue from this kind of analysis & are initiating appropriate measures to avoid the high-curve. And, that is one of the main objective of time series analysis.

There is always a room for improvement of this kind of models & the solution associated with it. I’ve shown the basic ways to achieve the same for the education purpose only.