Projecting real-time KPIs by ingesting streaming events from emulated IoT-device

Today, I am planning to demonstrate an IoT use case implemented in Python. I was waiting for my Raspberry Pi to arrive. However, the product that I received was not working as expected. Perhaps, some hardware malfunction. Hence, I was looking for a way to continue with my installment even without the hardware.

I was looking for an alternative way to use an online Raspberry Pi emulator. Recently, Microsoft has introduced integrated Raspberry Pi, which you can directly integrate with Azure IoT. However, I couldn’t find any API, which I could leverage on my Python application.

So, I explored all the possible options & finally come-up with the idea of creating my own IoT-Emulator, which can integrate with any application. With the help from the online materials, I have customized & enhanced them as per my use case & finally come up with this clean application that will demonstrate this use case with clarity.

We’ll showcase this real-time use case, where we would try to capture the events generated by IoT in a real-time dashboard, where the values in the visual display points will be affected as soon as the source data changes.


However, I would like to share the run before we dig deep into this.

Demo

Isn’t this exciting? How we can use our custom-built IoT emulator & captures real-time events to Ably Queue, then transform those raw events into more meaningful KPIs. Let’s deep dive then.


Architecture:

Let’s explore the architecture –

Fig – 1

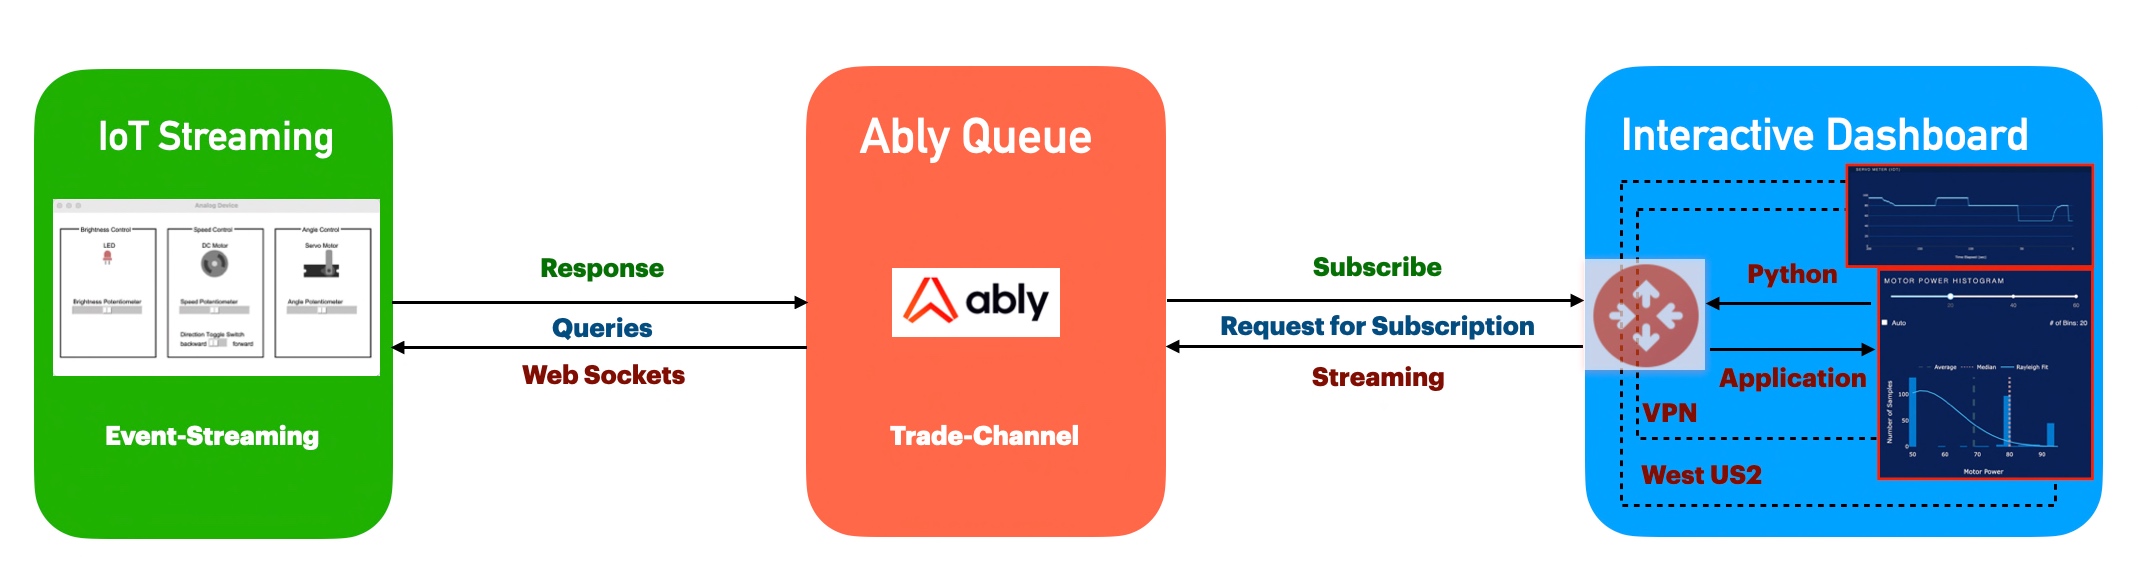
As you can see, the green box is a demo IoT application that generates events & pushes them into the Ably Queue. At the same time, Dashboard consumes the events & transforms them into more meaningful metrics.


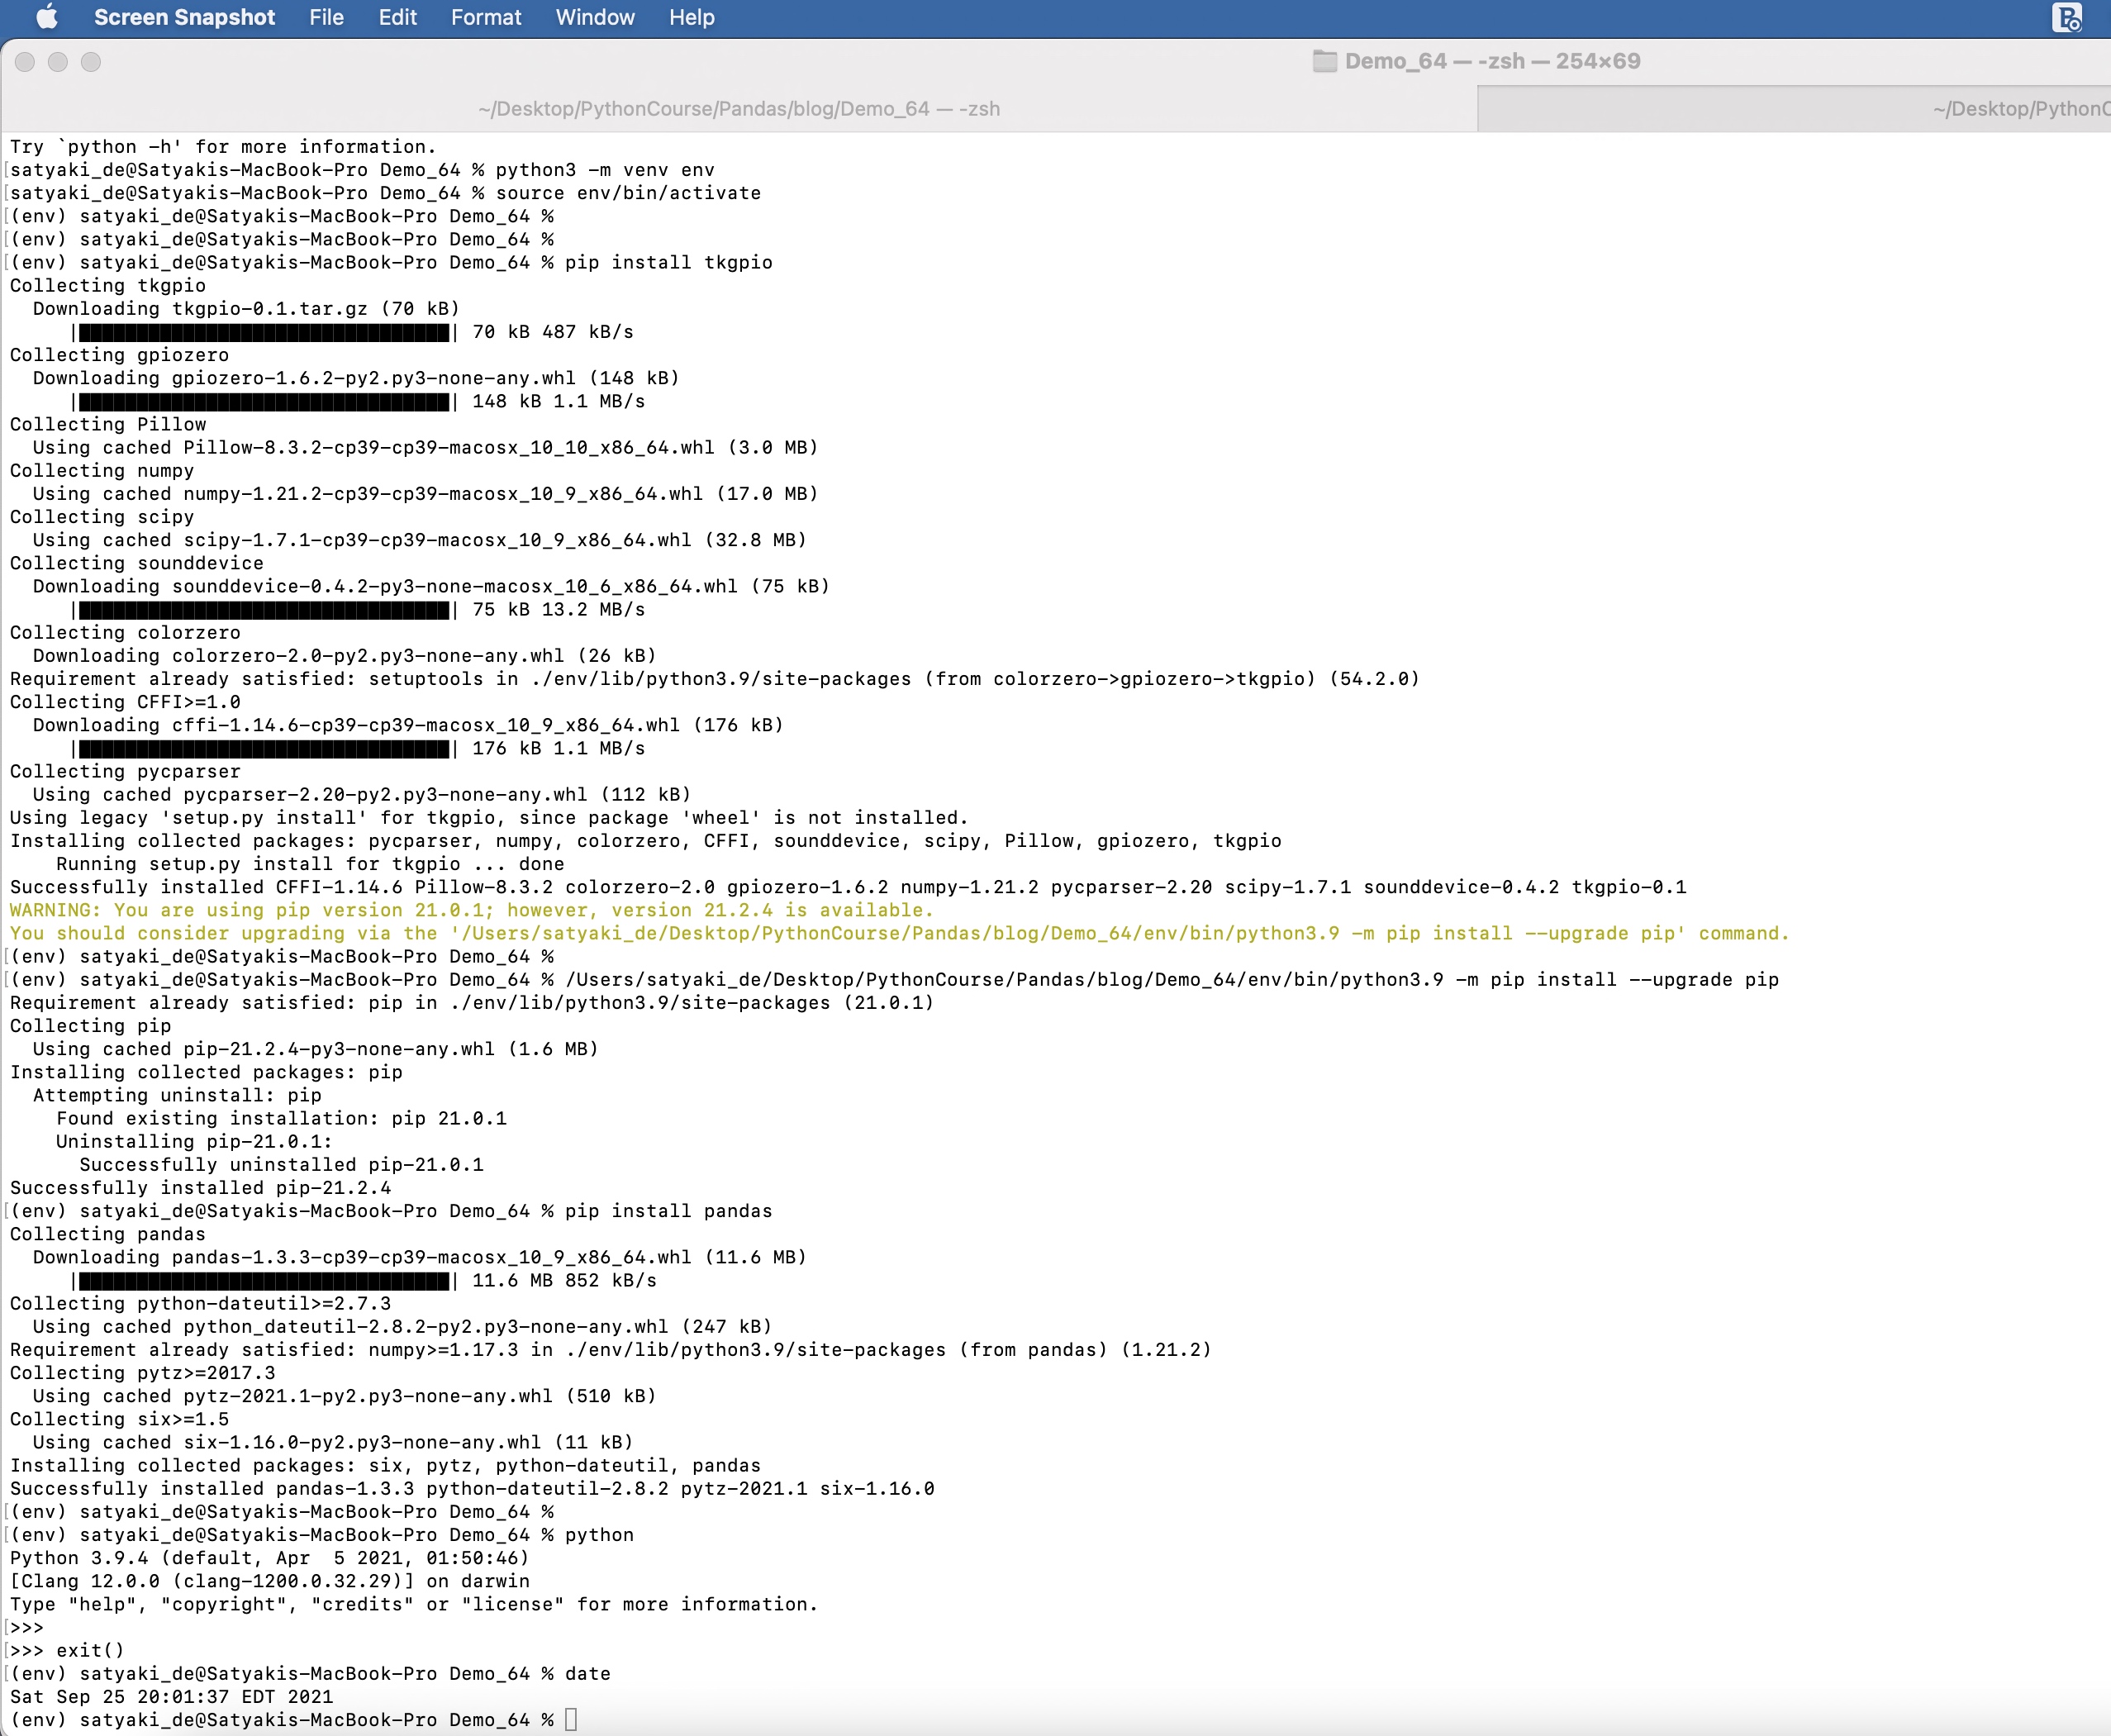
Package Installation:

Let us understand the sample packages that require for this task.

Step – 1:

Installation

Step – 2:

Installation – Continue

And, here is the command to install those packages –

pip install dash==1.0.0
pip install numpy==1.16.4
pip install pandas==0.24.2
pip install scipy==1.3.0
pip install gunicorn==19.9.0
pip install ably==1.1.1
pip install tkgpio==0.1

Code:

Since this is an extension to our previous post, we’re not going to discuss other scripts, which we’ve already discussed over there. Instead, we will talk about the enhanced scripts & the new scripts that require for this use case.

1. clsConfig.py (This native Python script contains the configuration entries.)


################################################
#### Written By: SATYAKI DE ####
#### Written On: 15-May-2020 ####
#### Modified On: 25-Sep-2021 ####
#### ####
#### Objective: This script is a config ####
#### file, contains all the keys for ####
#### Machine-Learning & streaming dashboard.####
#### ####
################################################
import os
import platform as pl
class clsConfig(object):
Curr_Path = os.path.dirname(os.path.realpath(__file__))
os_det = pl.system()
if os_det == "Windows":
sep = '\\'
else:
sep = '/'
conf = {
'APP_ID': 1,
'ARCH_DIR': Curr_Path + sep + 'arch' + sep,
'PROFILE_PATH': Curr_Path + sep + 'profile' + sep,
'LOG_PATH': Curr_Path + sep + 'log' + sep,
'REPORT_PATH': Curr_Path + sep + 'report',
'FILE_NAME': Curr_Path + sep + 'data' + sep + 'TradeIn.csv',
'SRC_PATH': Curr_Path + sep + 'data' + sep,
'JSONFileNameWithPath': Curr_Path + sep + 'GUI_Config' + sep + 'CircuitConfiguration.json',
'APP_DESC_1': 'Dash Integration with Ably!',
'DEBUG_IND': 'N',
'INIT_PATH': Curr_Path,
'SUBDIR' : 'data',
'ABLY_ID': 'WWP309489.93jfkT:32kkdhdJjdued79e',
"URL":"https://corona-api.com/countries/",
"appType":"application/json",
"conType":"keep-alive",
"limRec": 50,
"CACHE":"no-cache",
"MAX_RETRY": 3,
"coList": "DE, IN, US, CA, GB, ID, BR",
"FNC": "NewConfirmed",
"TMS": "ReportedDate",
"FND": "NewDeaths",
"FinData": "Cache.csv"
}

view raw

clsConfig.py

hosted with ❤ by GitHub

A few of the new entries, which are essential to this task are -> ABLY_ID, FinData & JSONFileNameWithPath.

2. clsPublishStream.py (This script will publish real-time streaming data coming out from a hosted API sources using another popular third-party service named Ably. Ably mimics pubsub Streaming concept, which might be extremely useful for any start-ups.)


###############################################################
#### ####
#### Written By: Satyaki De ####
#### Written Date: 26-Jul-2021 ####
#### Modified Date: 08-Sep-2021 ####
#### ####
#### Objective: This script will publish real-time ####
#### streaming data coming out from a hosted API ####
#### sources using another popular third-party service ####
#### named Ably. Ably mimics pubsub Streaming concept, ####
#### which might be extremely useful for any start-ups. ####
#### ####
###############################################################
from ably import AblyRest
import logging
import json
from random import seed
from random import random
import json
import math
import random
from clsConfig import clsConfig as cf
seed(1)
# Global Section
logger = logging.getLogger('ably')
logger.addHandler(logging.StreamHandler())
ably_id = str(cf.conf['ABLY_ID'])
ably = AblyRest(ably_id)
channel = ably.channels.get('sd_channel')
# End Of Global Section
class clsPublishStream:
def __init__(self):
self.msgSize = cf.conf['limRec']
def pushEvents(self, srcJSON, debugInd, varVa):
try:
msgSize = self.msgSize
# Capturing the inbound dataframe
jdata_fin = json.dumps(srcJSON)
print('IOT Events: ')
print(str(jdata_fin))
# Publish rest of the messages to the sd_channel channel
channel.publish('event', jdata_fin)
jdata_fin = ''
return 0
except Exception as e:
x = str(e)
print(x)
logging.info(x)
return 1

We’re not going to discuss this as we’ve already discussed in my previous post.

3. clsStreamConsume.py (Consuming Streaming data from Ably channels.)


##############################################
#### Written By: SATYAKI DE ####
#### Written On: 26-Jul-2021 ####
#### Modified On 08-Sep-2021 ####
#### ####
#### Objective: Consuming Streaming data ####
#### from Ably channels published by the ####
#### playIOTDevice.py ####
#### ####
##############################################
import json
from clsConfig import clsConfig as cf
import requests
import logging
import time
import pandas as p
import clsL as cl
from ably import AblyRest
# Initiating Log class
l = cl.clsL()
class clsStreamConsume:
def __init__(self):
self.ably_id = str(cf.conf['ABLY_ID'])
self.fileName = str(cf.conf['FinData'])
def conStream(self, varVa, debugInd):
try:
ably_id = self.ably_id
fileName = self.fileName
var = varVa
debug_ind = debugInd
# Fetching the data
client = AblyRest(ably_id)
channel = client.channels.get('sd_channel')
message_page = channel.history()
# Counter Value
cnt = 0
# Declaring Global Data-Frame
df_conv = p.DataFrame()
for i in message_page.items:
print('Last Msg: {}'.format(i.data))
json_data = json.loads(i.data)
#jdata = json.dumps(json_data)
# Converting String to Dictionary
dict_json = eval(json_data)
# Converting JSON to Dataframe
#df = p.json_normalize(json_data)
#df.columns = df.columns.map(lambda x: x.split(".")[-1])
df = p.DataFrame.from_dict(dict_json, orient='index')
#print('DF Inside:')
#print(df)
if cnt == 0:
df_conv = df
else:
d_frames = [df_conv, df]
df_conv = p.concat(d_frames)
cnt += 1
# Resetting the Index Value
df_conv.reset_index(drop=True, inplace=True)
# This will check whether the current load is happening
# or not. Based on that, it will capture the old events
# from cache.
if df_conv.empty:
df_conv = p.read_csv(fileName, index = True)
else:
l.logr(fileName, debug_ind, df_conv, 'log')
return df_conv
except Exception as e:
x = str(e)
print('Error: ', x)
logging.info(x)
# This will handle the error scenaio as well.
# Based on that, it will capture the old events
# from cache.
try:
df_conv = p.read_csv(fileName, index = True)
except:
df = p.DataFrame()
return df

We’re not going to discuss this as we’ve already discussed in my previous post.

4. CircuitConfiguration.json (Configuration file for GUI Interface for IoT Simulator.)


{
"name":"Analog Device",
"width":700,
"height":350,
"leds":[
{
"x":105,
"y":80,
"name":"LED",
"pin":21
}
],
"motors":[
{
"x":316,
"y":80,
"name":"DC Motor",
"forward_pin":22,
"backward_pin":23
}
],
"servos":[
{
"x":537,
"y":80,
"name":"Servo Motor",
"pin":24,
"min_angle":-180,
"max_angle":180,
"initial_angle":20
}
],
"adc":{
"mcp_chip":3008,
"potenciometers":[
{
"x":40,
"y":200,
"name":"Brightness Potentiometer",
"channel":0
},
{
"x":270,
"y":200,
"name":"Speed Potentiometer",
"channel":2
},
{
"x":500,
"y":200,
"name":"Angle Potentiometer",
"channel":6
}
]
},
"toggles":[
{
"x":270,
"y":270,
"name":"Direction Toggle Switch",
"pin":15,
"off_label":"backward",
"on_label":"forward",
"is_on":false
}
],
"labels":[
{
"x":15,
"y":35,
"width":25,
"height":18,
"borderwidth":2,
"relief":"solid"
},
{
"x":56,
"y":26,
"text":"Brightness Control"
},
{
"x":245,
"y":35,
"width":25,
"height":18,
"borderwidth":2,
"relief":"solid"
},
{
"x":298,
"y":26,
"text":"Speed Control"
},
{
"x":475,
"y":35,
"width":25,
"height":18,
"borderwidth":2,
"relief":"solid"
},
{
"x":531,
"y":26,
"text":"Angle Control"
}
]
}

This json configuration will be used by the next python class.

5. clsBuildCircuit.py (Calling Tk Circuit API.)


##############################################
#### Written By: SATYAKI DE ####
#### Written On: 25-Sep-2021 ####
#### Modified On 25-Sep-2021 ####
#### ####
#### Objective: Calling Tk Circuit API ####
##############################################
from tkgpio import TkCircuit
from json import load
from clsConfig import clsConfig as cf
fileName = str(cf.conf['JSONFileNameWithPath'])
print('File Name: ', str(fileName))
# initialize the circuit inside the GUI
with open(fileName, "r") as file:
config = load(file)
class clsBuildCircuit:
def __init__(self):
self.config = config
def genCir(self, main_function):
try:
config = self.config
circuit = TkCircuit(config)
circuit.run(main_function)
return circuit
except Exception as e:
x = str(e)
print(x)
return ''

Key snippets from the above script –

config = self.config
circuit = TkCircuit(config)
circuit.run(main_function)

The above lines will create an instance of simulated IoT circuits & then it will use the json file to start the GUI class.

6. playIOTDevice.py (Main Circuit GUI script to create an IoT Device to generate the events, which will consumed.)


###############################################
#### Written By: SATYAKI DE ####
#### Written On: 25-Sep-2021 ####
#### Modified On 25-Sep-2021 ####
#### ####
#### Objective: Main Tk Circuit GUI script ####
#### to create an IOT Device to generate ####
#### the events, which will consumed. ####
###############################################
# We keep the setup code in a different class as shown below.
import clsBuildCircuit as csb
import json
import clsPublishStream as cps
import datetime
from clsConfig import clsConfig as cf
import logging
###############################################
### Global Section ###
###############################################
# Initiating Ably class to push events
x1 = cps.clsPublishStream()
# Create the instance of the Tk Circuit API Class.
circuit = csb.clsBuildCircuit()
###############################################
### End of Global Section ###
###############################################
# Invoking the IOT Device Generator.
@circuit.genCir
def main():
from gpiozero import PWMLED, Motor, Servo, MCP3008, Button
from time import sleep
# Circuit Components
ledAlert = PWMLED(21)
dcMotor = Motor(22, 23)
servoMotor = Servo(24)
ioMeter1 = MCP3008(0)
ioMeter2 = MCP3008(2)
ioMeter3 = MCP3008(6)
switch = Button(15)
# End of circuit components
# Other useful variables
cnt = 1
idx = 0
debugInd = 'Y'
var = datetime.datetime.now().strftime("%Y-%m-%d_%H-%M-%S")
# End of useful variables
# Initiating Log Class
general_log_path = str(cf.conf['LOG_PATH'])
msgSize = int(cf.conf['limRec'])
# Enabling Logging Info
logging.basicConfig(filename=general_log_path + 'IOTDevice.log', level=logging.INFO)
while True:
ledAlert.value = ioMeter1.value
if switch.is_pressed:
dcMotor.forward(ioMeter2.value)
xVal = 'Motor Forward'
else:
dcMotor.backward(ioMeter2.value)
xVal = 'Motor Backward'
servoMotor.value = 1 2 * ioMeter3.value
srcJson = {
"LedMeter": ledAlert.value,
"DCMeter": ioMeter2.value,
"ServoMeter": ioMeter3.value,
"SwitchStatus": switch.is_pressed,
"DCMotorPos": xVal,
"ServoMotor": servoMotor.value
}
tmpJson = str(srcJson)
if cnt == 1:
srcJsonMast = '{' + '"' + str(idx) + '":'+ tmpJson
elif cnt == msgSize:
srcJsonMast = srcJsonMast + '}'
print('JSON: ')
print(str(srcJsonMast))
# Pushing both the Historical Confirmed Cases
retVal_1 = x1.pushEvents(srcJsonMast, debugInd, var)
if retVal_1 == 0:
print('Successfully IOT event pushed!')
else:
print('Failed to push IOT events!')
srcJsonMast = ''
tmpJson = ''
cnt = 0
idx = 1
srcJson = {}
retVal_1 = 0
else:
srcJsonMast = srcJsonMast + ',' + '"' + str(idx) + '":'+ tmpJson
cnt += 1
idx += 1
sleep(0.05)

Lets’ explore the key snippets –

ledAlert = PWMLED(21)
dcMotor = Motor(22, 23)
servoMotor = Servo(24)

It defines three motors that include Servo, DC & LED.

Now, we can see the following sets of the critical snippet –

ledAlert.value = ioMeter1.value

if switch.is_pressed:
    dcMotor.forward(ioMeter2.value)
    xVal = 'Motor Forward'
else:
    dcMotor.backward(ioMeter2.value)
    xVal = 'Motor Backward'

servoMotor.value = 1 - 2 * ioMeter3.value

srcJson = {
"LedMeter": ledAlert.value,
"DCMeter": ioMeter2.value,
"ServoMeter": ioMeter3.value,
"SwitchStatus": switch.is_pressed,
"DCMotorPos": xVal,
"ServoMotor": servoMotor.value
}

Following lines will dynamically generates JSON that will be passed into the Ably queue –

tmpJson = str(srcJson)

if cnt == 1:
    srcJsonMast = '{' + '"' + str(idx) + '":'+ tmpJson
elif cnt == msgSize:
    srcJsonMast = srcJsonMast + '}'
    print('JSON: ')
    print(str(srcJsonMast))

Final line from the above script –

# Pushing both the Historical Confirmed Cases
retVal_1 = x1.pushEvents(srcJsonMast, debugInd, var)

This code will now push the events into the Ably Queue.

7. app.py (Consuming Streaming data from Ably channels & captured IOT events from the simulator & publish them in Dashboard through measured KPIs.)


##############################################
#### Updated By: SATYAKI DE ####
#### Updated On: 02-Oct-2021 ####
#### ####
#### Objective: Consuming Streaming data ####
#### from Ably channels & captured IOT ####
#### events from the simulator & publish ####
#### them in Dashboard through measured ####
#### KPIs. ####
#### ####
##############################################
import os
import pathlib
import numpy as np
import datetime as dt
import dash
from dash import dcc
from dash import html
import datetime
import dash_daq as daq
from dash.exceptions import PreventUpdate
from dash.dependencies import Input, Output, State
from scipy.stats import rayleigh
# Consuming data from Ably Queue
from ably import AblyRest
# Main Class to consume streaming
import clsStreamConsume as ca
# Create the instance of the Covid API Class
x1 = ca.clsStreamConsume()
var1 = datetime.datetime.now().strftime("%Y-%m-%d_%H-%M-%S")
print('*' *60)
DInd = 'Y'
GRAPH_INTERVAL = os.environ.get("GRAPH_INTERVAL", 5000)
app = dash.Dash(
__name__,
meta_tags=[{"name": "viewport", "content": "width=device-width, initial-scale=1"}],
)
app.title = "IOT Device Dashboard"
server = app.server
app_color = {"graph_bg": "#082255", "graph_line": "#007ACE"}
app.layout = html.Div(
[
# header
html.Div(
[
html.Div(
[
html.H4("IOT DEVICE STREAMING", className="app__header__title"),
html.P(
"This app continually consumes streaming data from IOT-Device and displays live charts of various metrics & KPI associated with it.",
className="app__header__title–grey",
),
],
className="app__header__desc",
),
html.Div(
[
html.A(
html.Button("SOURCE CODE", className="link-button"),
href="https://github.com/SatyakiDe2019/IOTStream",
),
html.A(
html.Button("VIEW DEMO", className="link-button"),
href="https://github.com/SatyakiDe2019/IOTStream/blob/main/demo.gif",
),
html.A(
html.Img(
src=app.get_asset_url("dash-new-logo.png"),
className="app__menu__img",
),
href="https://plotly.com/dash/",
),
],
className="app__header__logo",
),
],
className="app__header",
),
html.Div(
[
# Motor Speed
html.Div(
[
html.Div(
[html.H6("SERVO METER (IOT)", className="graph__title")]
),
dcc.Graph(
id="iot-measure",
figure=dict(
layout=dict(
plot_bgcolor=app_color["graph_bg"],
paper_bgcolor=app_color["graph_bg"],
)
),
),
dcc.Interval(
id="iot-measure-update",
interval=int(GRAPH_INTERVAL),
n_intervals=0,
),
# Second Panel
html.Div(
[html.H6("DC-MOTOR (IOT)", className="graph__title")]
),
dcc.Graph(
id="iot-measure-1",
figure=dict(
layout=dict(
plot_bgcolor=app_color["graph_bg"],
paper_bgcolor=app_color["graph_bg"],
)
),
),
dcc.Interval(
id="iot-measure-update-1",
interval=int(GRAPH_INTERVAL),
n_intervals=0,
)
],
className="two-thirds column motor__speed__container",
),
html.Div(
[
# histogram
html.Div(
[
html.Div(
[
html.H6(
"MOTOR POWER HISTOGRAM",
className="graph__title",
)
]
),
html.Div(
[
dcc.Slider(
id="bin-slider",
min=1,
max=60,
step=1,
value=20,
updatemode="drag",
marks={
20: {"label": "20"},
40: {"label": "40"},
60: {"label": "60"},
},
)
],
className="slider",
),
html.Div(
[
dcc.Checklist(
id="bin-auto",
options=[
{"label": "Auto", "value": "Auto"}
],
value=["Auto"],
inputClassName="auto__checkbox",
labelClassName="auto__label",
),
html.P(
"# of Bins: Auto",
id="bin-size",
className="auto__p",
),
],
className="auto__container",
),
dcc.Graph(
id="motor-histogram",
figure=dict(
layout=dict(
plot_bgcolor=app_color["graph_bg"],
paper_bgcolor=app_color["graph_bg"],
)
),
),
],
className="graph__container first",
),
# motor direction
html.Div(
[
html.Div(
[
html.H6(
"SERVO MOTOR DIRECTION", className="graph__title"
)
]
),
dcc.Graph(
id="servo-motor-direction",
figure=dict(
layout=dict(
plot_bgcolor=app_color["graph_bg"],
paper_bgcolor=app_color["graph_bg"],
)
),
),
],
className="graph__container second",
),
],
className="one-third column histogram__direction",
),
],
className="app__content",
),
],
className="app__container",
)
def toPositive(row, flag):
try:
if flag == 'ServoMeter':
x_val = abs(float(row['ServoMotor']))
elif flag == 'DCMotor':
x_val = abs(float(row['DCMotor'])) * 0.001
return x_val
except Exception as e:
x = str(e)
print(x)
val = 0
return val
def toPositiveInflated(row, flag):
try:
if flag == 'ServoMeter':
x_val = abs(float(row['ServoMeter'])) * 100
elif flag == 'DCMotor':
x_val = abs(float(row['DCMeter'])) * 100
return x_val
except Exception as e:
x = str(e)
print(x)
val = 0
return val
def getData(var, Ind):
try:
# Let's pass this to our map section
df = x1.conStream(var, Ind)
df['ServoMeterNew'] = df.apply(lambda row: toPositiveInflated(row, 'ServoMeter'), axis=1)
df['ServoMotorNew'] = df.apply(lambda row: toPositive(row, 'ServoMeter'), axis=1)
df['DCMotor'] = df.apply(lambda row: toPositiveInflated(row, 'DCMotor'), axis=1)
df['DCMeterNew'] = df.apply(lambda row: toPositive(row, 'DCMotor'), axis=1)
# Dropping old columns
df.drop(columns=['ServoMeter','ServoMotor','DCMeter'], axis=1, inplace=True)
#Rename New Columns to Old Columns
df.rename(columns={'ServoMeterNew':'ServoMeter'}, inplace=True)
df.rename(columns={'ServoMotorNew':'ServoMotor'}, inplace=True)
df.rename(columns={'DCMeterNew':'DCMeter'}, inplace=True)
return df
except Exception as e:
x = str(e)
print(x)
df = p.DataFrame()
return df
@app.callback(
Output("iot-measure-1", "figure"), [Input("iot-measure-update", "n_intervals")]
)
def gen_iot_speed(interval):
"""
Generate the DC Meter graph.
:params interval: update the graph based on an interval
"""
# Let's pass this to our map section
df = getData(var1, DInd)
trace = dict(
type="scatter",
y=df["DCMotor"],
line={"color": "#42C4F7"},
hoverinfo="skip",
error_y={
"type": "data",
"array": df["DCMeter"],
"thickness": 1.5,
"width": 2,
"color": "#B4E8FC",
},
mode="lines",
)
layout = dict(
plot_bgcolor=app_color["graph_bg"],
paper_bgcolor=app_color["graph_bg"],
font={"color": "#fff"},
height=400,
xaxis={
"range": [0, 200],
"showline": True,
"zeroline": False,
"fixedrange": True,
"tickvals": [0, 50, 100, 150, 200],
"ticktext": ["200", "150", "100", "50", "0"],
"title": "Time Elapsed (sec)",
},
yaxis={
"range": [
min(0, min(df["DCMotor"])),
max(100, max(df["DCMotor"]) + max(df["DCMeter"])),
],
"showgrid": True,
"showline": True,
"fixedrange": True,
"zeroline": False,
"gridcolor": app_color["graph_line"],
"nticks": max(6, round(df["DCMotor"].iloc[1] / 10)),
},
)
return dict(data=[trace], layout=layout)
@app.callback(
Output("iot-measure", "figure"), [Input("iot-measure-update", "n_intervals")]
)
def gen_iot_speed(interval):
"""
Generate the Motor Speed graph.
:params interval: update the graph based on an interval
"""
# Let's pass this to our map section
df = getData(var1, DInd)
trace = dict(
type="scatter",
y=df["ServoMeter"],
line={"color": "#42C4F7"},
hoverinfo="skip",
error_y={
"type": "data",
"array": df["ServoMotor"],
"thickness": 1.5,
"width": 2,
"color": "#B4E8FC",
},
mode="lines",
)
layout = dict(
plot_bgcolor=app_color["graph_bg"],
paper_bgcolor=app_color["graph_bg"],
font={"color": "#fff"},
height=400,
xaxis={
"range": [0, 200],
"showline": True,
"zeroline": False,
"fixedrange": True,
"tickvals": [0, 50, 100, 150, 200],
"ticktext": ["200", "150", "100", "50", "0"],
"title": "Time Elapsed (sec)",
},
yaxis={
"range": [
min(0, min(df["ServoMeter"])),
max(100, max(df["ServoMeter"]) + max(df["ServoMotor"])),
],
"showgrid": True,
"showline": True,
"fixedrange": True,
"zeroline": False,
"gridcolor": app_color["graph_line"],
"nticks": max(6, round(df["ServoMeter"].iloc[1] / 10)),
},
)
return dict(data=[trace], layout=layout)
@app.callback(
Output("servo-motor-direction", "figure"), [Input("iot-measure-update", "n_intervals")]
)
def gen_motor_direction(interval):
"""
Generate the Servo direction graph.
:params interval: update the graph based on an interval
"""
df = getData(var1, DInd)
val = df["ServoMeter"].iloc[1]
direction = [0, (df["ServoMeter"][0]*100 20), (df["ServoMeter"][0]*100 + 20), 0]
traces_scatterpolar = [
{"r": [0, val, val, 0], "fillcolor": "#084E8A"},
{"r": [0, val * 0.65, val * 0.65, 0], "fillcolor": "#B4E1FA"},
{"r": [0, val * 0.3, val * 0.3, 0], "fillcolor": "#EBF5FA"},
]
data = [
dict(
type="scatterpolar",
r=traces["r"],
theta=direction,
mode="lines",
fill="toself",
fillcolor=traces["fillcolor"],
line={"color": "rgba(32, 32, 32, .6)", "width": 1},
)
for traces in traces_scatterpolar
]
layout = dict(
height=350,
plot_bgcolor=app_color["graph_bg"],
paper_bgcolor=app_color["graph_bg"],
font={"color": "#fff"},
autosize=False,
polar={
"bgcolor": app_color["graph_line"],
"radialaxis": {"range": [0, 45], "angle": 45, "dtick": 10},
"angularaxis": {"showline": False, "tickcolor": "white"},
},
showlegend=False,
)
return dict(data=data, layout=layout)
@app.callback(
Output("motor-histogram", "figure"),
[Input("iot-measure-update", "n_intervals")],
[
State("iot-measure", "figure"),
State("bin-slider", "value"),
State("bin-auto", "value"),
],
)
def gen_motor_histogram(interval, iot_speed_figure, slider_value, auto_state):
"""
Genererate iot histogram graph.
:params interval: upadte the graph based on an interval
:params iot_speed_figure: current Motor Speed graph
:params slider_value: current slider value
:params auto_state: current auto state
"""
motor_val = []
try:
print('Inside gen_motor_histogram:')
print('iot_speed_figure::')
print(iot_speed_figure)
# Check to see whether iot-measure has been plotted yet
if iot_speed_figure is not None:
motor_val = iot_speed_figure["data"][0]["y"]
if "Auto" in auto_state:
bin_val = np.histogram(
motor_val,
bins=range(int(round(min(motor_val))), int(round(max(motor_val)))),
)
else:
bin_val = np.histogram(motor_val, bins=slider_value)
except Exception as error:
raise PreventUpdate
avg_val = float(sum(motor_val)) / len(motor_val)
median_val = np.median(motor_val)
pdf_fitted = rayleigh.pdf(
bin_val[1], loc=(avg_val) * 0.55, scale=(bin_val[1][1] bin_val[1][0]) / 3
)
y_val = (pdf_fitted * max(bin_val[0]) * 20,)
y_val_max = max(y_val[0])
bin_val_max = max(bin_val[0])
trace = dict(
type="bar",
x=bin_val[1],
y=bin_val[0],
marker={"color": app_color["graph_line"]},
showlegend=False,
hoverinfo="x+y",
)
traces_scatter = [
{"line_dash": "dash", "line_color": "#2E5266", "name": "Average"},
{"line_dash": "dot", "line_color": "#BD9391", "name": "Median"},
]
scatter_data = [
dict(
type="scatter",
x=[bin_val[int(len(bin_val) / 2)]],
y=[0],
mode="lines",
line={"dash": traces["line_dash"], "color": traces["line_color"]},
marker={"opacity": 0},
visible=True,
name=traces["name"],
)
for traces in traces_scatter
]
trace3 = dict(
type="scatter",
mode="lines",
line={"color": "#42C4F7"},
y=y_val[0],
x=bin_val[1][: len(bin_val[1])],
name="Rayleigh Fit",
)
layout = dict(
height=350,
plot_bgcolor=app_color["graph_bg"],
paper_bgcolor=app_color["graph_bg"],
font={"color": "#fff"},
xaxis={
"title": "Motor Power",
"showgrid": False,
"showline": False,
"fixedrange": True,
},
yaxis={
"showgrid": False,
"showline": False,
"zeroline": False,
"title": "Number of Samples",
"fixedrange": True,
},
autosize=True,
bargap=0.01,
bargroupgap=0,
hovermode="closest",
legend={
"orientation": "h",
"yanchor": "bottom",
"xanchor": "center",
"y": 1,
"x": 0.5,
},
shapes=[
{
"xref": "x",
"yref": "y",
"y1": int(max(bin_val_max, y_val_max)) + 0.5,
"y0": 0,
"x0": avg_val,
"x1": avg_val,
"type": "line",
"line": {"dash": "dash", "color": "#2E5266", "width": 5},
},
{
"xref": "x",
"yref": "y",
"y1": int(max(bin_val_max, y_val_max)) + 0.5,
"y0": 0,
"x0": median_val,
"x1": median_val,
"type": "line",
"line": {"dash": "dot", "color": "#BD9391", "width": 5},
},
],
)
return dict(data=[trace, scatter_data[0], scatter_data[1], trace3], layout=layout)
@app.callback(
Output("bin-auto", "value"),
[Input("bin-slider", "value")],
[State("iot-measure", "figure")],
)
def deselect_auto(slider_value, iot_speed_figure):
""" Toggle the auto checkbox. """
# prevent update if graph has no data
if "data" not in iot_speed_figure:
raise PreventUpdate
if not len(iot_speed_figure["data"]):
raise PreventUpdate
if iot_speed_figure is not None and len(iot_speed_figure["data"][0]["y"]) > 5:
return [""]
return ["Auto"]
@app.callback(
Output("bin-size", "children"),
[Input("bin-auto", "value")],
[State("bin-slider", "value")],
)
def show_num_bins(autoValue, slider_value):
""" Display the number of bins. """
if "Auto" in autoValue:
return "# of Bins: Auto"
return "# of Bins: " + str(int(slider_value))
if __name__ == "__main__":
app.run_server(debug=True)

view raw

app.py

hosted with ❤ by GitHub

Here are the key snippets –

html.Div(
        [
            html.Div(
                [html.H6("SERVO METER (IOT)", className="graph__title")]
            ),
            dcc.Graph(
                id="iot-measure",
                figure=dict(
                    layout=dict(
                        plot_bgcolor=app_color["graph_bg"],
                        paper_bgcolor=app_color["graph_bg"],
                    )
                ),
            ),
            dcc.Interval(
                id="iot-measure-update",
                interval=int(GRAPH_INTERVAL),
                n_intervals=0,
            ),
            # Second Panel
            html.Div(
                [html.H6("DC-MOTOR (IOT)", className="graph__title")]
            ),
            dcc.Graph(
                id="iot-measure-1",
                figure=dict(
                    layout=dict(
                        plot_bgcolor=app_color["graph_bg"],
                        paper_bgcolor=app_color["graph_bg"],
                    )
                ),
            ),
            dcc.Interval(
                id="iot-measure-update-1",
                interval=int(GRAPH_INTERVAL),
                n_intervals=0,
            )
        ],
        className="two-thirds column motor__speed__container",

The following line creates two panels, where the application will consume the streaming data by the app’s call-back feature & refresh the data & graphs as & when the application receives the streaming data.

A similar approach was adopted for other vital aspects/components inside the dashboard.

def getData(var, Ind):
    try:
        # Let's pass this to our map section
        df = x1.conStream(var, Ind)

        df['ServoMeterNew'] = df.apply(lambda row: toPositiveInflated(row, 'ServoMeter'), axis=1)
        df['ServoMotorNew'] = df.apply(lambda row: toPositive(row, 'ServoMeter'), axis=1)
        df['DCMotor'] = df.apply(lambda row: toPositiveInflated(row, 'DCMotor'), axis=1)
        df['DCMeterNew'] = df.apply(lambda row: toPositive(row, 'DCMotor'), axis=1)

        # Dropping old columns
        df.drop(columns=['ServoMeter','ServoMotor','DCMeter'], axis=1, inplace=True)

        #Rename New Columns to Old Columns
        df.rename(columns={'ServoMeterNew':'ServoMeter'}, inplace=True)
        df.rename(columns={'ServoMotorNew':'ServoMotor'}, inplace=True)
        df.rename(columns={'DCMeterNew':'DCMeter'}, inplace=True)

        return df
    except Exception as e:
        x = str(e)
        print(x)

        df = p.DataFrame()

        return df

The application is extracting streaming data & consuming it from the Ably queue.

@app.callback(
    Output("iot-measure", "figure"), [Input("iot-measure-update", "n_intervals")]
)
def gen_iot_speed(interval):
    """
    Generate the Motor Speed graph.

    :params interval: update the graph based on an interval
    """

    # Let's pass this to our map section
    df = getData(var1, DInd)

    trace = dict(
        type="scatter",
        y=df["ServoMeter"],
        line={"color": "#42C4F7"},
        hoverinfo="skip",
        error_y={
            "type": "data",
            "array": df["ServoMotor"],
            "thickness": 1.5,
            "width": 2,
            "color": "#B4E8FC",
        },
        mode="lines",
    )

    layout = dict(
        plot_bgcolor=app_color["graph_bg"],
        paper_bgcolor=app_color["graph_bg"],
        font={"color": "#fff"},
        height=400,
        xaxis={
            "range": [0, 200],
            "showline": True,
            "zeroline": False,
            "fixedrange": True,
            "tickvals": [0, 50, 100, 150, 200],
            "ticktext": ["200", "150", "100", "50", "0"],
            "title": "Time Elapsed (sec)",
        },
        yaxis={
            "range": [
                min(0, min(df["ServoMeter"])),
                max(100, max(df["ServoMeter"]) + max(df["ServoMotor"])),
            ],
            "showgrid": True,
            "showline": True,
            "fixedrange": True,
            "zeroline": False,
            "gridcolor": app_color["graph_line"],
            "nticks": max(6, round(df["ServoMeter"].iloc[-1] / 10)),
        },
    )

    return dict(data=[trace], layout=layout)

Capturing all the relevant columns & transform them into a graph, where the application will consume data into both the axis (x-axis & y-axis).

There are many other useful snippets, which creates separate useful widgets inside the dashboard.


Run:

Let us run the application –
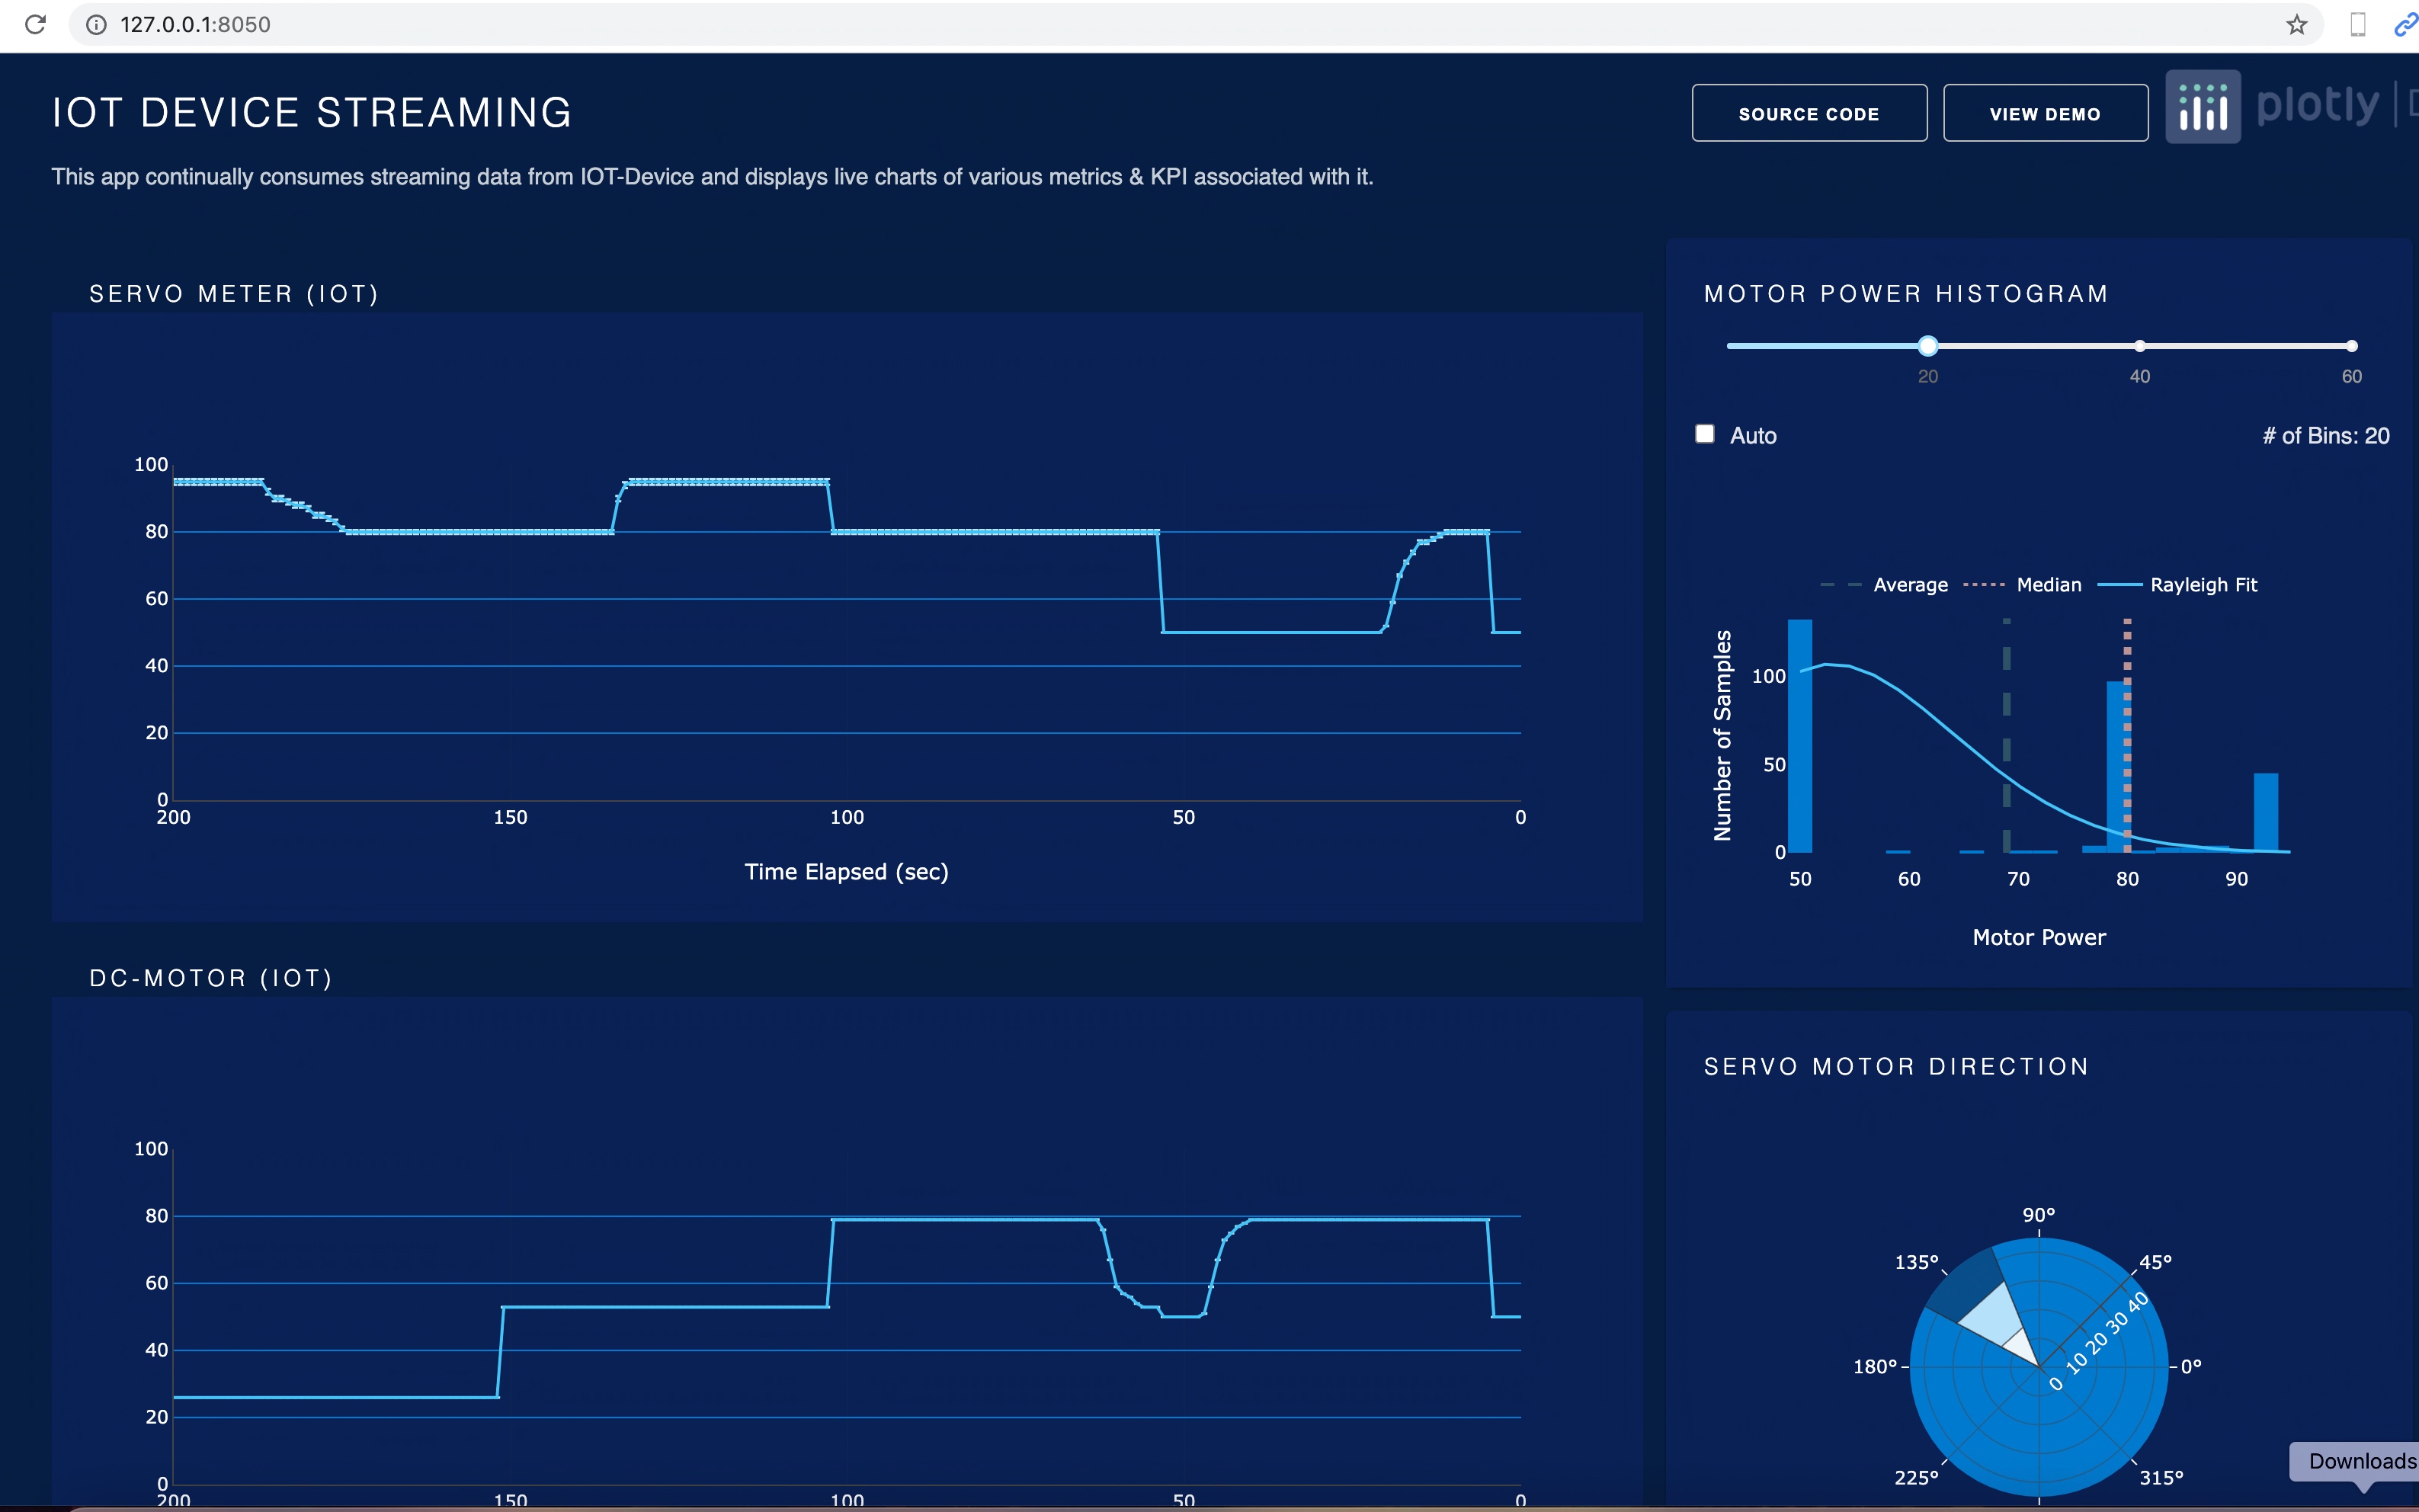
Dashboard-View

So, we’ve done it.

You will get the complete codebase in the following Github link.

There is an excellent resource from the dash framework, which you should explore. The following link would be handy for developers who want to get some meaningful pre-built dashboard template, which you can customize as per your need through Python or R. Please find the link here.


I’ll bring some more exciting topic in the coming days from the Python verse.

Till then, Happy Avenging! 😀


Note: All the data & scenario posted here are representational data & scenarios & available over the internet & for educational purpose only.

One more thing you need to understand is that this prediction based on limited data points. The actual event may happen differently. Ideally, countries are taking a cue from this kind of analysis & are initiating appropriate measures to avoid the high-curve. And, that is one of the main objective of time series analysis.

There is always a room for improvement of this kind of models & the solution associated with it. I’ve shown the basic ways to achieve the same for the education purpose only.

Displaying real-time trade data in a dashboard using Python & third-party API & Streaming

Today, We want to make our use case a little bit harder & more realistic. We want to consume real-time live trade-data consuming through FinnHub API & displaying them into our dashboard using another brilliant H2O-Wave API with the help of native Python.

The use-case mentioned above is extremely useful & for that, we’ll be using the following Third-Party APIs to achieve the same –

  1. FinnHub: For more information, please click the following link.
  2. Ably: For more information, please click the following link.
  3. H2O-Wave: For more information, please click the following link.

I’m not going to discuss these topics more, as I’ve already discussed them in separate earlier posts. Please refer to the following threads for detailed level information –

creating-a-real-time-dashboard-from-streaming-data-using-python


In this post, we will address the advanced concept compared to the previous post mentioned above. Let us first look at how the run looks before we start exploring the details –

Real-time trade dashboard

Let us explore the architecture of this implementation –

Architecture Diagram

This application will talk to the FinnHub websocket & consume real-time trade data from it. And this will be temporarily stored in our Ably channels. The dashboard will pick the message & display that as soon as there is new data for that trading company.


For this use case, you need to install the following packages –

STEP – 1:

Main Packages

STEP – 2:

Main Packages – Continue

STEP – 3:

Main Packages – Continue

STEP – 4:

Main Packages – End

You can copy the following commands to install the above-mentioned packages –

pip install ably 
pip install h2o-wave
pip install pandas
pip install websocket
pip install websocket-client

Let’s explore the important data-point that you need to capture from the FinnHub portal to consume the real-time trade data –

FinnHub Portal

We’ve two main scripts. The first script will consume the streaming data into a message queue & the other one will be extracting the data from the queue & transform the data & publish it into the real-time dashboard.

1. dashboard_finnhub.py ( This native Python script will consume streaming data & create the live trade dashboard. )


###############################################################
#### Template Written By: H2O Wave ####
#### Enhanced with Streaming Data By: Satyaki De ####
#### Base Version Enhancement On: 20-Dec-2020 ####
#### Modified On 27-Jun-2021 ####
#### ####
#### Objective: This script will consume real-time ####
#### streaming data coming out from a hosted API ####
#### sources (Finnhub) using another popular third-party ####
#### service named Ably. Ably mimics pubsub Streaming ####
#### concept, which might be extremely useful for ####
#### any start-ups. ####
#### ####
#### Note: This is an enhancement of my previous post of ####
#### H2O Wave. In this case, the application will consume ####
#### streaming trade data from a live host & not generated ####
#### out of the mock data. Thus, it is more useful for the ####
#### start-ups. ####
###############################################################
import time
from h2o_wave import site, data, ui
from ably import AblyRest
import pandas as p
import json
import datetime
import logging
import platform as pl
from clsConfig import clsConfig as cf
import clsL as cl
# Disbling Warning
def warn(*args, **kwargs):
pass
import warnings
warnings.warn = warn
# Lookup functions from
# Azure cloud SQL DB
var = datetime.datetime.now().strftime("%Y-%m-%d_%H-%M-%S")
# Global Area
## Global Class
# Initiating Log Class
l = cl.clsL()
# Global Variables
# Moving previous day log files to archive directory
log_dir = cf.config['LOG_PATH']
path = cf.config['INIT_PATH']
subdir = cf.config['SUBDIR']
## End Of Global Part
class DaSeries:
def __init__(self, inputDf):
self.Df = inputDf
self.count_row = inputDf.shape[0]
self.start_pos = 0
self.end_pos = 0
self.interval = 1
def next(self):
try:
# Getting Individual Element & convert them to Series
if ((self.start_pos + self.interval) <= self.count_row):
self.end_pos = self.start_pos + self.interval
else:
self.end_pos = self.start_pos + (self.count_row self.start_pos)
split_df = self.Df.iloc[self.start_pos:self.end_pos]
if ((self.start_pos > self.count_row) | (self.start_pos == self.count_row)):
pass
else:
self.start_pos = self.start_pos + self.interval
x = float(split_df.iloc[0]['CurrentExchange'])
dx = float(split_df.iloc[0]['Change'])
# Emptying the exisitng dataframe
split_df = p.DataFrame(None)
return x, dx
except:
x = 0
dx = 0
return x, dx
class CategoricalSeries:
def __init__(self, sourceDf):
self.series = DaSeries(sourceDf)
self.i = 0
def next(self):
x, dx = self.series.next()
self.i += 1
return f'C{self.i}', x, dx
light_theme_colors = '$red $pink $purple $violet $indigo $blue $azure $cyan $teal $mint $green $amber $orange $tangerine'.split()
dark_theme_colors = '$red $pink $blue $azure $cyan $teal $mint $green $lime $yellow $amber $orange $tangerine'.split()
_color_index = 1
colors = dark_theme_colors
def next_color():
global _color_index
_color_index += 1
return colors[_color_index % len(colors)]
_curve_index = 1
curves = 'linear smooth step step-after step-before'.split()
def next_curve():
global _curve_index
_curve_index += 1
return curves[_curve_index % len(curves)]
def calc_p(row):
try:
str_calc_s1 = str(row['s_x'])
str_calc_s2 = str(row['s_y'])
if str_calc_s1 == str_calc_s2:
calc_p_val = float(row['p_y'])
else:
calc_p_val = float(row['p_x'])
return calc_p_val
except:
return 0.0
def calc_v(row):
try:
str_calc_s1 = str(row['s_x'])
str_calc_s2 = str(row['s_y'])
if str_calc_s1 == str_calc_s2:
calc_v_val = float(row['v_y'])
else:
calc_v_val = float(row['v_x'])
return calc_v_val
except:
return 0.0
def process_DF(inputDF, inputDFUnq):
try:
# Core Business logic
# The application will show default value to any
# trade-in stock in case that data doesn't consume
# from the source.
df_conv = inputDF
df_unique_fin = inputDFUnq
df_conv['max_count'] = df_conv.groupby('default_rank')['default_rank'].transform('count')
l.logr('3. max_df.csv', 'Y', df_conv, subdir)
# Sorting the output
sorted_df = df_conv.sort_values(by=['default_rank','s'], ascending=True)
# New Column List Orders
column_order = ['s', 'default_rank', 'max_count', 'p', 't', 'v']
df_fin = sorted_df.reindex(column_order, axis=1)
l.logr('4. sorted_df.csv', 'Y', df_fin, subdir)
# Now splitting the sorted df into two sets
lkp_max_count = 4
df_fin_na = df_fin[(df_fin['max_count'] == lkp_max_count)]
l.logr('5. df_fin_na.csv', 'Y', df_fin_na, subdir)
df_fin_req = df_fin[(df_fin['max_count'] != lkp_max_count)]
l.logr('6. df_fin_req.csv', 'Y', df_fin_req, subdir)
# Now to perform cross join, we will create
# a key column in both the DataFrames to
# merge on that key.
df_unique_fin['key'] = 1
df_fin_req['key'] = 1
# Dropping unwanted columns
df_unique_fin.drop(columns=['t'], axis=1, inplace=True)
l.logr('7. df_unique_slim.csv', 'Y', df_unique_fin, subdir)
# Padding with dummy key values
#merge_df = p.merge(df_unique_fin,df_fin_req,on=['s'],how='left')
merge_df = p.merge(df_unique_fin,df_fin_req,on=['key']).drop("key", 1)
l.logr('8. merge_df.csv', 'Y', merge_df, subdir)
# Sorting the output
sorted_merge_df = merge_df.sort_values(by=['default_rank_y','s_x'], ascending=True)
l.logr('9. sorted_merge_df.csv', 'Y', sorted_merge_df, subdir)
# Calling new derived logic
sorted_merge_df['derived_p'] = sorted_merge_df.apply(lambda row: calc_p(row), axis=1)
sorted_merge_df['derived_v'] = sorted_merge_df.apply(lambda row: calc_v(row), axis=1)
l.logr('10. sorted_merge_derived.csv', 'Y', sorted_merge_df, subdir)
# Dropping unwanted columns
sorted_merge_df.drop(columns=['default_rank_x', 'p_x', 'v_x', 's_y', 'p_y', 'v_y'], axis=1, inplace=True)
#Renaming the columns
sorted_merge_df.rename(columns={'s_x':'s'}, inplace=True)
sorted_merge_df.rename(columns={'default_rank_y':'default_rank'}, inplace=True)
sorted_merge_df.rename(columns={'derived_p':'p'}, inplace=True)
sorted_merge_df.rename(columns={'derived_v':'v'}, inplace=True)
l.logr('11. org_merge_derived.csv', 'Y', sorted_merge_df, subdir)
# Aligning columns
column_order = ['s', 'default_rank', 'max_count', 'p', 't', 'v']
merge_fin_df = sorted_merge_df.reindex(column_order, axis=1)
l.logr('12. merge_fin_df.csv', 'Y', merge_fin_df, subdir)
# Finally, appending these two DataFrame (df_fin_na & merge_fin_df)
frames = [df_fin_na, merge_fin_df]
fin_df = p.concat(frames, keys=["s", "default_rank", "max_count"])
l.logr('13. fin_df.csv', 'Y', fin_df, subdir)
# Final clearance & organization
fin_df.drop(columns=['default_rank', 'max_count'], axis=1, inplace=True)
l.logr('14. Final.csv', 'Y', fin_df, subdir)
# Adjusting key columns
fin_df.rename(columns={'s':'Company'}, inplace=True)
fin_df.rename(columns={'p':'CurrentExchange'}, inplace=True)
fin_df.rename(columns={'v':'Change'}, inplace=True)
l.logr('15. TransormedFinal.csv', 'Y', fin_df, subdir)
return fin_df
except Exception as e:
print('$' * 120)
x = str(e)
print(x)
print('$' * 120)
df = p.DataFrame()
return df
def create_dashboard(update_freq=0.0):
page = site['/dashboard_finnhub']
general_log_path = str(cf.config['LOG_PATH'])
ably_id = str(cf.config['ABLY_ID'])
# Enabling Logging Info
logging.basicConfig(filename=general_log_path + 'Realtime_Stock.log', level=logging.INFO)
os_det = pl.system()
if os_det == "Windows":
src_path = path + '\\' + 'data\\'
else:
src_path = path + '/' + 'data/'
# Fetching the data
client = AblyRest(ably_id)
channel = client.channels.get('sd_channel')
message_page = channel.history()
# Counter Value
cnt = 0
# Declaring Global Data-Frame
df_conv = p.DataFrame()
for i in message_page.items:
print('Last Msg: {}'.format(i.data))
json_data = json.loads(i.data)
# Converting JSON to Dataframe
df = p.json_normalize(json_data)
df.columns = df.columns.map(lambda x: x.split(".")[1])
if cnt == 0:
df_conv = df
else:
d_frames = [df_conv, df]
df_conv = p.concat(d_frames)
cnt += 1
# Resetting the Index Value
df_conv.reset_index(drop=True, inplace=True)
print('DF:')
print(df_conv)
# Writing to the file
l.logr('1. DF_modified.csv', 'Y', df_conv, subdir)
# Dropping unwanted columns
df_conv.drop(columns=['c'], axis=1, inplace=True)
df_conv['default_rank'] = df_conv.groupby(['s']).cumcount() + 1
lkp_rank = 1
df_unique = df_conv[(df_conv['default_rank'] == lkp_rank)]
# New Column List Orders
column_order = ['s', 'default_rank', 'p', 't', 'v']
df_unique_fin = df_unique.reindex(column_order, axis=1)
print('Rank DF Unique:')
print(df_unique_fin)
l.logr('2. df_unique.csv', 'Y', df_unique_fin, subdir)
# Capturing transformed values into a DataFrame
# Depending on your logic, you'll implement that inside
# the process_DF functions
fin_df = process_DF(df_conv, df_unique_fin)
df_unq_fin = df_unique_fin.copy()
df_unq_fin.rename(columns={'s':'Company'}, inplace=True)
df_unq_fin.rename(columns={'p':'CurrentExchange'}, inplace=True)
df_unq_fin.rename(columns={'v':'Change'}, inplace=True)
df_unq_fin.drop(columns=['default_rank','key'], axis=1, inplace=True)
l.logr('16. df_unq_fin.csv', 'Y', df_unq_fin, subdir)
df_unq_finale = df_unq_fin.sort_values(by=['Company'], ascending=True)
l.logr('17. df_unq_finale.csv', 'Y', df_unq_finale, subdir)
# Final clearance for better understanding of data
fin_df.drop(columns=['t'], axis=1, inplace=True)
l.logr('18. CleanFinal.csv', 'Y', fin_df, subdir)
count_row = df_unq_finale.shape[0]
large_lines = []
start_pos = 0
end_pos = 0
interval = 1
# Converting dataframe to a desired Series
f = CategoricalSeries(fin_df)
for j in range(count_row):
# Getting the series values from above
cat, val, pc = f.next()
# Getting Individual Element & convert them to Series
if ((start_pos + interval) <= count_row):
end_pos = start_pos + interval
else:
end_pos = start_pos + (count_row start_pos)
split_df = df_unq_finale.iloc[start_pos:end_pos]
if ((start_pos > count_row) | (start_pos == count_row)):
pass
else:
start_pos = start_pos + interval
x_currency = str(split_df.iloc[0]['Company'])
####################################################
##### Debug Purpose #########
####################################################
print('Company: ', x_currency)
print('J: ', str(j))
print('Cat: ', cat)
####################################################
##### End Of Debug #######
####################################################
c = page.add(f'e{j+1}', ui.tall_series_stat_card(
box=f'{j+1} 1 1 2',
title=x_currency,
value='=${{intl qux minimum_fraction_digits=2 maximum_fraction_digits=2}}',
aux_value='={{intl quux style="percent" minimum_fraction_digits=1 maximum_fraction_digits=1}}',
data=dict(qux=val, quux=pc),
plot_type='area',
plot_category='foo',
plot_value='qux',
plot_color=next_color(),
plot_data=data('foo qux', 15),
plot_zero_value=0,
plot_curve=next_curve(),
))
large_lines.append((f, c))
page.save()
while update_freq > 0:
time.sleep(update_freq)
for f, c in large_lines:
cat, val, pc = f.next()
print('Update Cat: ', cat)
print('Update Val: ', val)
print('Update pc: ', pc)
print('*' * 160)
c.data.qux = val
c.data.quux = pc / 100
c.plot_data[1] = [cat, val]
page.save()
if __name__ == "__main__":
try:
# Main Calling script
create_dashboard(update_freq=0.25)
except Exception as e:
x = str(e)
print(x)

Let’s explore the key snippets from the above script –

def process_DF(inputDF, inputDFUnq):
    try:
        # Core Business logic
        # The application will show default value to any
        # trade-in stock in case that data doesn't consume
        # from the source.
        
        # Getting block count
        #df_conv['block_count'] = df_conv.groupby(['default_rank']).cumcount()
        #l.logr('3. block_df.csv', 'Y', df_conv, subdir)

        # Getting block count
        #df_conv['max_count'] = df_conv.groupby(['default_rank']).size()
        #df_conv_fin = df_conv.groupby(['default_rank']).agg(['count'])
        #df_conv_fin = df_conv.value_counts(['default_rank']).reset_index(name='max_count')
        #df_conv_fin = df_conv.value_counts(['default_rank'])
        df_conv = inputDF
        df_unique_fin = inputDFUnq

        df_conv['max_count'] = df_conv.groupby('default_rank')['default_rank'].transform('count')
        l.logr('3. max_df.csv', 'Y', df_conv, subdir)


        # Sorting the output
        sorted_df = df_conv.sort_values(by=['default_rank','s'], ascending=True)

        # New Column List Orders
        column_order = ['s', 'default_rank', 'max_count', 'p', 't', 'v']
        df_fin = sorted_df.reindex(column_order, axis=1)

        l.logr('4. sorted_df.csv', 'Y', df_fin, subdir)

        # Now splitting the sorted df into two sets
        lkp_max_count = 4
        df_fin_na = df_fin[(df_fin['max_count'] == lkp_max_count)]

        l.logr('5. df_fin_na.csv', 'Y', df_fin_na, subdir)

        df_fin_req = df_fin[(df_fin['max_count'] != lkp_max_count)]
        l.logr('6. df_fin_req.csv', 'Y', df_fin_req, subdir)

        # Now to perform cross join, we will create
        # a key column in both the DataFrames to
        # merge on that key.
        df_unique_fin['key'] = 1
        df_fin_req['key'] = 1

        # Dropping unwanted columns
        df_unique_fin.drop(columns=['t'], axis=1, inplace=True)
        l.logr('7. df_unique_slim.csv', 'Y', df_unique_fin, subdir)

        # Padding with dummy key values
        #merge_df = p.merge(df_unique_fin,df_fin_req,on=['s'],how='left')
        merge_df = p.merge(df_unique_fin,df_fin_req,on=['key']).drop("key", 1)

        l.logr('8. merge_df.csv', 'Y', merge_df, subdir)

        # Sorting the output
        sorted_merge_df = merge_df.sort_values(by=['default_rank_y','s_x'], ascending=True)

        l.logr('9. sorted_merge_df.csv', 'Y', sorted_merge_df, subdir)

        # Calling new derived logic
        sorted_merge_df['derived_p'] = sorted_merge_df.apply(lambda row: calc_p(row), axis=1)
        sorted_merge_df['derived_v'] = sorted_merge_df.apply(lambda row: calc_v(row), axis=1)

        l.logr('10. sorted_merge_derived.csv', 'Y', sorted_merge_df, subdir)

        # Dropping unwanted columns
        sorted_merge_df.drop(columns=['default_rank_x', 'p_x', 'v_x', 's_y', 'p_y', 'v_y'], axis=1, inplace=True)

        #Renaming the columns
        sorted_merge_df.rename(columns={'s_x':'s'}, inplace=True)
        sorted_merge_df.rename(columns={'default_rank_y':'default_rank'}, inplace=True)
        sorted_merge_df.rename(columns={'derived_p':'p'}, inplace=True)
        sorted_merge_df.rename(columns={'derived_v':'v'}, inplace=True)

        l.logr('11. org_merge_derived.csv', 'Y', sorted_merge_df, subdir)

        # Aligning columns
        column_order = ['s', 'default_rank', 'max_count', 'p', 't', 'v']
        merge_fin_df = sorted_merge_df.reindex(column_order, axis=1)

        l.logr('12. merge_fin_df.csv', 'Y', merge_fin_df, subdir)

        # Finally, appending these two DataFrame (df_fin_na & merge_fin_df)
        frames = [df_fin_na, merge_fin_df]
        fin_df = p.concat(frames, keys=["s", "default_rank", "max_count"])

        l.logr('13. fin_df.csv', 'Y', fin_df, subdir)

        # Final clearance & organization
        fin_df.drop(columns=['default_rank', 'max_count'], axis=1, inplace=True)

        l.logr('14. Final.csv', 'Y', fin_df, subdir)

        # Adjusting key columns
        fin_df.rename(columns={'s':'Company'}, inplace=True)
        fin_df.rename(columns={'p':'CurrentExchange'}, inplace=True)
        fin_df.rename(columns={'v':'Change'}, inplace=True)

        l.logr('15. TransormedFinal.csv', 'Y', fin_df, subdir)

        return fin_df
    except Exception as e:
        print('$' * 120)

        x = str(e)
        print(x)

        print('$' * 120)

        df = p.DataFrame()

        return df

The above function will check if the queue is sending all the key trade-in data for all the companies. In our use case, we’re testing with the four companies & they are as follows –

a. AAPL
b. AMZN
c. BINANCE:BTCUSDT
d. IC MARKETS:1

Every message is containing data from all of these four companies together. If any of the company’s data is missing, this transformation will add a dummy record of that missing company to make the uniform number of entries in each message bouquet. And dummy trade-in values added for all the missing information.

def calc_p(row):
    try:
        str_calc_s1 = str(row['s_x'])
        str_calc_s2 = str(row['s_y'])

        if str_calc_s1 == str_calc_s2:
            calc_p_val = float(row['p_y'])
        else:
            calc_p_val = float(row['p_x'])

        return calc_p_val
    except:
        return 0.0

def calc_v(row):
    try:
        str_calc_s1 = str(row['s_x'])
        str_calc_s2 = str(row['s_y'])

        if str_calc_s1 == str_calc_s2:
            calc_v_val = float(row['v_y'])
        else:
            calc_v_val = float(row['v_x'])

        return calc_v_val
    except:
        return 0.0

The above snippet will capture the default values for those missing records.

    client = AblyRest(ably_id)
    channel = client.channels.get('sd_channel')

    message_page = channel.history()

In the above snippet, the application will consume the streaming data from the Ably queue.

for i in message_page.items:
        print('Last Msg: {}'.format(i.data))
        json_data = json.loads(i.data)

        # Converting JSON to Dataframe
        df = p.json_normalize(json_data)
        df.columns = df.columns.map(lambda x: x.split(".")[-1])

        if cnt == 0:
            df_conv = df
        else:
            d_frames = [df_conv, df]
            df_conv = p.concat(d_frames)

        cnt += 1

The above snippet will convert the streaming messages to a more meaningful pandas data-frame, which we can use for a wide variety of analytics.

    # Converting dataframe to a desired Series
    f = CategoricalSeries(fin_df)

    for j in range(count_row):
        # Getting the series values from above
        cat, val, pc = f.next()

        # Getting Individual Element & convert them to Series
        if ((start_pos + interval) <= count_row):
            end_pos = start_pos + interval
        else:
            end_pos = start_pos + (count_row - start_pos)

        split_df = df_unq_finale.iloc[start_pos:end_pos]

        if ((start_pos > count_row) | (start_pos == count_row)):
            pass
        else:
            start_pos = start_pos + interval

        x_currency = str(split_df.iloc[0]['Company'])

        ####################################################
        ##### Debug Purpose                        #########
        ####################################################
        print('Company: ', x_currency)
        print('J: ', str(j))
        print('Cat: ', cat)
        ####################################################
        #####   End Of Debug                         #######
        ####################################################

        c = page.add(f'e{j+1}', ui.tall_series_stat_card(
            box=f'{j+1} 1 1 2',
            title=x_currency,
            value='=${{intl qux minimum_fraction_digits=2 maximum_fraction_digits=2}}',
            aux_value='={{intl quux style="percent" minimum_fraction_digits=1 maximum_fraction_digits=1}}',
            data=dict(qux=val, quux=pc),
            plot_type='area',
            plot_category='foo',
            plot_value='qux',
            plot_color=next_color(),
            plot_data=data('foo qux', -15),
            plot_zero_value=0,
            plot_curve=next_curve(),
        ))
        large_lines.append((f, c))

    page.save()

    while update_freq > 0:

        time.sleep(update_freq)

        for f, c in large_lines:
            cat, val, pc = f.next()

            print('Update Cat: ', cat)
            print('Update Val: ', val)
            print('Update pc: ', pc)
            print('*' * 160)

            c.data.qux = val
            c.data.quux = pc / 100
            c.plot_data[-1] = [cat, val]

        page.save()

The above snippet will consume the data into H2O-Wave driven framework, which will expose this data into beautiful & easily representable GUI-based solutions through an interactive dashboard.


2. publish_ably_mod.py ( This native Python script will consume streaming data into Ably message Queue )


###############################################################
#### ####
#### Written By: Satyaki De ####
#### Written Date: 26-Jun-2021 ####
#### ####
#### Objective: This script will consume real-time ####
#### streaming data coming out from a hosted API ####
#### sources (Finnhub) using another popular third-party ####
#### service named Ably. Ably mimics pubsub Streaming ####
#### concept, which might be extremely useful for ####
#### any start-ups. ####
#### ####
###############################################################
from ably import AblyRest
import logging
import json
# generate random floating point values
from random import seed
from random import random
# seed random number generator
import websocket
import json
from clsConfig import clsConfig as cf
seed(1)
# Global Section
logger = logging.getLogger('ably')
logger.addHandler(logging.StreamHandler())
ably_id = str(cf.config['ABLY_ID'])
ably = AblyRest(ably_id)
channel = ably.channels.get('sd_channel')
# End Of Global Section
def on_message(ws, message):
print("*" * 60)
res = json.loads(message)
jsBody = res["data"]
jdata_dyn = json.dumps(jsBody)
print(jdata_dyn)
# JSON data
# This is the default data for all the identified category
# we've prepared. You can extract this dynamically. Or, By
# default you can set their base trade details.
json_data = [{
"c": "null",
"p": 0.01,
"s": "AAPL",
"t": 1624715406407,
"v": 0.01
},{
"c": "null",
"p": 0.01,
"s": "AMZN",
"t": 1624715406408,
"v": 0.01
},{
"c": "null",
"p": 0.01,
"s": "BINANCE:BTCUSDT",
"t": 1624715406409,
"v": 0.01
},
{
"c": "null",
"p": 0.01,
"s": "IC MARKETS:1",
"t": 1624715406410,
"v": 0.01
}]
jdata = json.dumps(json_data)
# Publish a message to the sd_channel channel
channel.publish('event', jdata)
# Publish rest of the messages to the sd_channel channel
channel.publish('event', jdata_dyn)
jsBody = []
jdata_dyn = ''
def on_error(ws, error):
print(error)
def on_close(ws):
print("### closed ###")
def on_open(ws):
# Invoking Individual Company Trade Queries
ws.send('{"type":"subscribe","symbol":"AAPL"}')
ws.send('{"type":"subscribe","symbol":"AMZN"}')
ws.send('{"type":"subscribe","symbol":"BINANCE:BTCUSDT"}')
ws.send('{"type":"subscribe","symbol":"IC MARKETS:1"}')
if __name__ == "__main__":
websocket.enableTrace(True)
ws = websocket.WebSocketApp("wss://ws.finnhub.io?token=jfhfyr8474rpv6av0",
on_message = on_message,
on_error = on_error,
on_close = on_close)
ws.on_open = on_open
ws.run_forever()

The key snippet from the above script –

    json_data = [{
        "c": "null",
        "p": 0.01,
        "s": "AAPL",
        "t": 1624715406407,
        "v": 0.01
    },{
        "c": "null",
        "p": 0.01,
        "s": "AMZN",
        "t": 1624715406408,
        "v": 0.01
    },{
        "c": "null",
        "p": 0.01,
        "s": "BINANCE:BTCUSDT",
        "t": 1624715406409,
        "v": 0.01
    },
        {
        "c": "null",
        "p": 0.01,
        "s": "IC MARKETS:1",
        "t": 1624715406410,
        "v": 0.01
        }]

As we already discussed, we’ll pass a default set of data for all the candidate companies.

    # Publish a message to the sd_channel channel
    channel.publish('event', jdata)

    # Publish rest of the messages to the sd_channel channel
    channel.publish('event', jdata_dyn)

Publish the messages to the created channel.

def on_open(ws):
    # Invoking Individual Company Trade Queries
    ws.send('{"type":"subscribe","symbol":"AAPL"}')
    ws.send('{"type":"subscribe","symbol":"AMZN"}')
    ws.send('{"type":"subscribe","symbol":"BINANCE:BTCUSDT"}')
    ws.send('{"type":"subscribe","symbol":"IC MARKETS:1"}')

if __name__ == "__main__":
    websocket.enableTrace(True)
    ws = websocket.WebSocketApp("wss://ws.finnhub.io?token=hdhdjdj9494ld934v6av0",
                              on_message = on_message,
                              on_error = on_error,
                              on_close = on_close)

Send the company-specific trade queries through websocket apps to submit that to FinnHub.

3. clsConfig.py ( This file contains the configuration details. )


################################################
#### Written By: SATYAKI DE ####
#### Written On: 15-May-2020 ####
#### ####
#### Objective: This script is a config ####
#### file, contains all the keys for ####
#### Machine-Learning. Application will ####
#### process these information & perform ####
#### various analysis on Linear-Regression. ####
################################################
import os
import platform as pl
class clsConfig(object):
Curr_Path = os.path.dirname(os.path.realpath(__file__))
os_det = pl.system()
if os_det == "Windows":
sep = '\\'
else:
sep = '/'
config = {
'APP_ID': 1,
'ARCH_DIR': Curr_Path + sep + 'arch' + sep,
'PROFILE_PATH': Curr_Path + sep + 'profile' + sep,
'LOG_PATH': Curr_Path + sep + 'log' + sep,
'REPORT_PATH': Curr_Path + sep + 'report',
'FILE_NAME': Curr_Path + sep + 'Data' + sep + 'TradeIn.csv',
'SRC_PATH': Curr_Path + sep + 'Data' + sep,
'APP_DESC_1': 'H2O Wave Integration with FinHubb!',
'DEBUG_IND': 'N',
'INIT_PATH': Curr_Path,
'SUBDIR' : 'data',
'ABLY_ID': 'WWP309489.93jfkT:32kkdhdJjdued79e'
}

view raw

clsConfig.py

hosted with ❤ by GitHub


Let’s explore the directory structure –

MAC Directory

Let’s run the application –

Step 1:

Starting of Wave Server

Step 2:

Triggering message consumption job

Step 3:

Triggering the main application

You can monitor the message consumption from your Ably portal as follows –

Message Consumption

If you want to know more detail, then you need to scroll down the page, where you will get this additional information –

Message spike during consumption

And, the final output in the interactive dashboard will be look like the below screenshot –

Interactive Real-time Dashboard

So, we’ve done it.

You will get the complete codebase in the following Github link.

I’ll bring some more exciting topic in the coming days from the Python verse.

Till then, Happy Avenging! 😀

Note: All the data & scenario posted here are representational data & scenarios & available over the internet & for educational purpose only.

Building a Python-based airline solution using Amadeus API

Hi Guys,

Today, I’ll share a little different topic in Python compared to my last couple of posts, where I have demonstrated the use of Python in the field of machine learning & forecast modeling.

We’ll explore to create meaningful sample data points for Airlines & hotel reservations. At this moment, this industry is the hard-hit due to the pandemic. And I personally wish a speedy recovery to all employees who risked their lives to maintain the operation or might have lost their jobs due to this time.

I’ll be providing only major scripts & will show how you can extract critical data from their API.

However, to create the API, you need to register in Amadeus as a developer & follow specific steps to get the API details. You will need to register using the following link.

Step 1:

1. Generating API - Step 1

Once you provide the necessary details, you need to activate your account by clicking the email validation.

Step 2:

As part of the next step, you will be clicking the “Self-Service Workspace” option as marked in the green box shown above.

Now, you have to click My apps & under that, you need to click – Create new appshown below –

2. Generating API - Step 2

Step 3:

You need to provide the following details before creating the API. Note that once you create – it will take 30 minutes to activate the API-link.

3. Generating API - Step 3

Step 4:

You will come to the next page once you click the “Create” button in the previous step.

4. Generating API - Step 4

For production, you need to create a separate key shown above.

You need to install the following packages –

pip install amadeus

And, the installation process is shown as –

5. Installing Packages

pip install flatten_json

And, this installation process is shown as –

6. Installing Packages - Continuation

1. clsAmedeus (This is the API script, which will send the API requests & return JSON if successful.)

##############################################
#### Written By: SATYAKI DE               ####
#### Written On: 05-Jul-2020              ####
#### Modified On 05-Jul-2020              ####
####                                      ####
#### Objective: Main calling scripts.     ####
##############################################

from amadeus import Client, ResponseError
import json
from clsConfig import clsConfig as cf

class clsAmedeus:
    def __init__(self):
        self.client_id = cf.config['CLIENT_ID']
        self.client_secret = cf.config['CLIENT_SECRET']
        self.type = cf.config['API_TYPE']

    def flightOffers(self, origLocn, destLocn, departDate, noOfAdult):
        try:
            cnt = 0

            # Setting Clients
            amadeus = Client(
                                client_id=str(self.client_id),
                                client_secret=str(self.client_secret)
                            )

            # Flight Offers
            response = amadeus.shopping.flight_offers_search.get(
                originLocationCode=origLocn,
                destinationLocationCode=destLocn,
                departureDate=departDate,
                adults=noOfAdult)

            ResJson = response.data

            return ResJson
        except Exception as e:
            print(e)
            x = str(e)
            ResJson = {'errorDetails': x}

            return ResJson

    def cheapestDate(self, origLocn, destLocn):
        try:
            # Setting Clients
            amadeus = Client(
                client_id=self.client_id,
                client_secret=self.client_secret
            )

            # Flight Offers
            # Flight Cheapest Date Search
            response = amadeus.shopping.flight_dates.get(origin=origLocn, destination=destLocn)

            ResJson = response.data

            return ResJson
        except Exception as e:
            print(e)
            x = str(e)
            ResJson = {'errorDetails': x}

            return ResJson

    def listOfHotelsByCity(self, origLocn):
        try:
            # Setting Clients
            amadeus = Client(
                client_id=self.client_id,
                client_secret=self.client_secret
            )

            # Hotel Search
            # Get list of Hotels by city code
            response = amadeus.shopping.hotel_offers.get(cityCode=origLocn)

            ResJson = response.data

            return ResJson
        except Exception as e:
            print(e)
            x = str(e)
            ResJson = {'errorDetails': x}

            return ResJson

    def listOfOffersBySpecificHotels(self, hotelID):
        try:
            # Setting Clients
            amadeus = Client(
                client_id=self.client_id,
                client_secret=self.client_secret
            )

            # Get list of offers for a specific hotel
            response = amadeus.shopping.hotel_offers_by_hotel.get(hotelId=hotelID)

            ResJson = response.data

            return ResJson
        except Exception as e:
            print(e)
            x = str(e)
            ResJson = {'errorDetails': x}

            return ResJson

    def hotelReview(self, hotelID):
        try:
            # Setting Clients
            amadeus = Client(
                client_id=self.client_id,
                client_secret=self.client_secret
            )

            # Hotel Ratings
            # What travelers think about this hotel?
            response = amadeus.e_reputation.hotel_sentiments.get(hotelIds=hotelID)

            ResJson = response.data

            return ResJson
        except Exception as e:
            print(e)
            x = str(e)
            ResJson = {'errorDetails': x}

            return ResJson

    def process(self, choice, origLocn, destLocn, departDate, noOfAdult, hotelID):
        try:
            # Main Area to call apropriate choice
            if choice == 1:
                resJson = self.flightOffers(origLocn, destLocn, departDate, noOfAdult)
            elif choice == 2:
                resJson = self.cheapestDate(origLocn, destLocn)
            elif choice == 3:
                resJson = self.listOfHotelsByCity(origLocn)
            elif choice == 4:
                resJson = self.listOfOffersBySpecificHotels(hotelID)
            elif choice == 5:
                resJson = self.hotelReview(hotelID)
            else:
                resJson = {'errorDetails': 'Invalid Options!'}

            # Converting back to JSON
            jdata = json.dumps(resJson)

            # Checking the begining character
            # for the new package
            # As that requires dictionary array
            # Hence, We'll be adding '[' if this
            # is missing from the return payload
            SYM = jdata[:1]
            if SYM != '[':
                rdata = '[' + jdata + ']'
            else:
                rdata = jdata

            ResJson = json.loads(rdata)

            return ResJson

        except ResponseError as error:
            x = str(error)
            resJson = {'errorDetails': x}

            return resJson

Let’s explore the key lines –

Creating an instance of the client by providing the recently acquired API Key & API-Secret.

# Setting Clients
amadeus = Client(
                    client_id=str(self.client_id),
                    client_secret=str(self.client_secret)
                )

The following lines are used to fetch the API response for specific business cases. Different invocation of API retrieve different data –

# Flight Offers
# Flight Cheapest Date Search
response = amadeus.shopping.flight_dates.get(origin=origLocn, destination=destLocn)

The program will navigate to particular methods to invoke certain features –

# Main Area to call apropriate choice
if choice == 1:
    resJson = self.flightOffers(origLocn, destLocn, departDate, noOfAdult)
elif choice == 2:
    resJson = self.cheapestDate(origLocn, destLocn)
elif choice == 3:
    resJson = self.listOfHotelsByCity(origLocn)
elif choice == 4:
    resJson = self.listOfOffersBySpecificHotels(hotelID)
elif choice == 5:
    resJson = self.hotelReview(hotelID)
else:
    resJson = {'errorDetails': 'Invalid Options!'}

2. callAmedeusAPI (This is the main script, which will invoke the Amadeus API & return dataframe if successful.)

##############################################
#### Written By: SATYAKI DE               ####
#### Written On: 05-Jul-2020              ####
#### Modified On 05-Jul-2020              ####
####                                      ####
#### Objective: Main calling scripts.     ####
##############################################

from clsConfig import clsConfig as cf
import clsL as cl
import logging
import datetime
import clsAmedeus as cw
import pandas as p
import json

# Newly added package
from flatten_json import flatten

# Disbling Warning
def warn(*args, **kwargs):
    pass

import warnings
warnings.warn = warn

# Lookup functions from
# Azure cloud SQL DB

var = datetime.datetime.now().strftime("%Y-%m-%d_%H-%M-%S")

def main():
    try:
        # Declared Variable
        ret_1 = 0
        textOrig = ''
        textDest = ''
        textDate = ''
        intAdult = 0
        textHotelID = ''
        debug_ind = 'Y'
        res_2 = ''

        # Defining Generic Log File
        general_log_path = str(cf.config['LOG_PATH'])

        # Enabling Logging Info
        logging.basicConfig(filename=general_log_path + 'AmadeusAPI.log', level=logging.INFO)

        # Initiating Log Class
        l = cl.clsL()

        # Moving previous day log files to archive directory
        log_dir = cf.config['LOG_PATH']
        curr_ver =datetime.datetime.now().strftime("%Y-%m-%d")

        tmpR0 = "*" * 157

        logging.info(tmpR0)
        tmpR9 = 'Start Time: ' + str(var)
        logging.info(tmpR9)
        logging.info(tmpR0)

        print("Log Directory::", log_dir)
        tmpR1 = 'Log Directory::' + log_dir
        logging.info(tmpR1)

        print('Welcome to Amadeus Calling Program: ')
        print('-' * 60)
        print('Please Press 1 for flight offers.')
        print('Please Press 2 for cheapest date.')
        print('Please Press 3 for list of hotels by city.')
        print('Please Press 4 for list of offers by specific hotel.')
        print('Please Press 5 for specific hotel review.')
        input_choice = int(input('Please provide your choice:'))

        # Create the instance of the Amadeus Class
        x2 = cw.clsAmedeus()

        # Let's pass this to our map section
        if input_choice == 1:
            textOrig = str(input('Please provide the Origin:'))
            textDest = str(input('Please provide the Destination:'))
            textDate = str(input('Please provide the Depart Date:'))
            intAdult = int(input('Please provide the No Of Adult:'))

            retJson = x2.process(input_choice, textOrig, textDest, textDate, intAdult, textHotelID)
        elif input_choice == 2:
            textOrig = str(input('Please provide the Origin:'))
            textDest = str(input('Please provide the Destination:'))

            retJson = x2.process(input_choice, textOrig, textDest, textDate, intAdult, textHotelID)
        elif input_choice == 3:
            textOrig = str(input('Please provide the Origin:'))

            retJson = x2.process(input_choice, textOrig, textDest, textDate, intAdult, textHotelID)
        elif input_choice == 4:
            textHotelID = str(input('Please provide the Hotel Id:'))

            retJson = x2.process(input_choice, textOrig, textDest, textDate, intAdult, textHotelID)
        elif input_choice == 5:
            textHotelID = str(input('Please provide the Hotel Id:'))

            retJson = x2.process(input_choice, textOrig, textDest, textDate, intAdult, textHotelID)
        else:
            print('Invalid options!')
            retJson = {'errorDetails': 'Invalid Options!'}

        #print('JSON::')
        #print(retJson)

        # Converting JSon to Pandas Dataframe for better readability
        # Capturing the JSON Payload
        res_1 = json.dumps(retJson)
        res = json.loads(res_1)

        # Newly added JSON Parse package
        dic_flattened = (flatten(d) for d in res)
        df_ret = p.DataFrame(dic_flattened)

        # Removing any duplicate columns
        df_ret = df_ret.loc[:, ~df_ret.columns.duplicated()]

        print('Publishing sample result: ')
        print(df_ret.head())

        # Logging Final Output
        l.logr('1.df_ret' + var + '.csv', debug_ind, df_ret, 'log')

        print("-" * 60)
        print()

        print('Finding Analysis points..')
        print("*" * 157)
        logging.info('Finding Analysis points..')
        logging.info(tmpR0)

        tmpR10 = 'End Time: ' + str(var)
        logging.info(tmpR10)
        logging.info(tmpR0)

    except ValueError as e:
        print(str(e))
        print("Invalid option!")
        logging.info("Invalid option!")

    except Exception as e:
        print("Top level Error: args:{0}, message{1}".format(e.args, e.message))

if __name__ == "__main__":
    main()

Key lines from the above script –

# Create the instance of the Amadeus Class
x2 = cw.clsAmedeus()

The above line will instantiate the newly written Amadeus class.

# Let's pass this to our map section
if input_choice == 1:
    textOrig = str(input('Please provide the Origin:'))
    textDest = str(input('Please provide the Destination:'))
    textDate = str(input('Please provide the Depart Date:'))
    intAdult = int(input('Please provide the No Of Adult:'))

    retJson = x2.process(input_choice, textOrig, textDest, textDate, intAdult, textHotelID)
elif input_choice == 2:
    textOrig = str(input('Please provide the Origin:'))
    textDest = str(input('Please provide the Destination:'))

    retJson = x2.process(input_choice, textOrig, textDest, textDate, intAdult, textHotelID)
elif input_choice == 3:
    textOrig = str(input('Please provide the Origin:'))

    retJson = x2.process(input_choice, textOrig, textDest, textDate, intAdult, textHotelID)
elif input_choice == 4:
    textHotelID = str(input('Please provide the Hotel Id:'))

    retJson = x2.process(input_choice, textOrig, textDest, textDate, intAdult, textHotelID)
elif input_choice == 5:
    textHotelID = str(input('Please provide the Hotel Id:'))

    retJson = x2.process(input_choice, textOrig, textDest, textDate, intAdult, textHotelID)
else:
    print('Invalid options!')
    retJson = {'errorDetails': 'Invalid Options!'}

The above lines will fetch the response based on the supplied inputs in the form of JSON.

# Converting JSon to Pandas Dataframe for better readability
# Capturing the JSON Payload
res_1 = json.dumps(retJson)
res = json.loads(res_1)

Now, the above line will convert the return payload to JSON.

Sample JSON should look something like this –

20. Sample_JASON_Option_4_1

Now, using this new package, our application will flatten the complex nested JSON.

# Newly added JSON Parse package
dic_flattened = (flatten(d) for d in res)
df_ret = p.DataFrame(dic_flattened)

The given lines will remove any duplicate column if it exists.

# Removing any duplicate columns
df_ret = df_ret.loc[:, ~df_ret.columns.duplicated()]

Let’s explore the directory structure –

13. Win_Dir

Let’s run our application –

We’ll invoke five different API’s (API related to different functionalities) & their business cases –

Run – Option 1:

7. Win_Run_Op_1

So, if we want to explore some of the key columns, below is the screenshot for a few sample data –

21. Key_Columns

Run – Option 2:

8. Win_Run_Op_2

Some of the vital sample data –

15. Option_2_Sample_Data

Run – Option 3:

9. Win_Run_Op_3

Sample relevant data for our analysis –

16. Option_3_Sample_Data

Run – Option 4:

10. Win_Run_Op_4

Few relevant essential information –

17. Option_4_Sample_Data

Run – Option 5:

11. Win_Run_Op_5

Finally, few sample records from the last option –

18. Option_5_Sample_Data

So, finally, we’ve done it. You will find that JSON package from this link.

During this challenging time, I would request you to follow strict health guidelines & stay healthy.

N.B.: All the data that are used here can be found in the public domain. We use this solely for educational purposes.

Canada’s Covid19 analysis based on Logistic Regression

Hi Guys,

Today, I’ll be demonstrating some scenarios based on open-source data from Canada. In this post, I will only explain some of the significant parts of the code. Not the entire range of scripts here.

Let’s explore a couple of sample source data –

2. Sample Input Data

I would like to explore how much this disease caused an impact on the elderly in Canada.

Let’s explore the source directory structure –

3. Source Directory Structures

For this, you need to install the following packages –

pip install pandas

pip install seaborn

Please find the PyPi link given below –

In this case, we’ve downloaded the data from Canada’s site. However, they have created API. So, you can consume the data through that way as well. Since the volume is a little large. I decided to download that in CSV & then use that for my analysis.

Before I start, let me explain a couple of critical assumptions that I had to make due to data impurities or availabilities.

  • If there is no data available for a specific case, my application will consider that patient as COVID-Active.
  • We will consider the patient is affected through Community-spreading until we have data to find it otherwise.
  • If there is no data available for gender, we’re marking these records as “Other.” So, that way, we’re making it into that category, where the patient doesn’t want to disclose their sexual orientation.
  • If we don’t have any data, then by default, the application is considering the patient is alive.
  • Lastly, my application considers the middle point of the age range data for all the categories, i.e., the patient’s age between 20 & 30 will be considered as 25.

1. clsCovidAnalysisByCountryAdv (This is the main script, which will invoke the Machine-Learning API & return 0 if successful.)

##############################################
#### Written By: SATYAKI DE               ####
#### Written On: 01-Jun-2020              ####
#### Modified On 01-Jun-2020              ####
####                                      ####
#### Objective: Main scripts for Logistic ####
#### Regression.                          ####
##############################################

import pandas as p
import clsL as log
import datetime

import matplotlib.pyplot as plt
import seaborn as sns
from clsConfig import clsConfig as cf

# %matplotlib inline -- for Jupyter Notebook
class clsCovidAnalysisByCountryAdv:
    def __init__(self):
        self.fileName_1 = cf.config['FILE_NAME_1']
        self.fileName_2 = cf.config['FILE_NAME_2']
        self.Ind = cf.config['DEBUG_IND']
        self.subdir = str(cf.config['LOG_DIR_NAME'])

    def setDefaultActiveCases(self, row):
        try:
            str_status = str(row['case_status'])

            if str_status == 'Not Reported':
                return 'Active'
            else:
                return str_status
        except:
            return 'Active'

    def setDefaultExposure(self, row):
        try:
            str_exposure = str(row['exposure'])

            if str_exposure == 'Not Reported':
                return 'Community'
            else:
                return str_exposure
        except:
            return 'Community'

    def setGender(self, row):
        try:
            str_gender = str(row['gender'])

            if str_gender == 'Not Reported':
                return 'Other'
            else:
                return str_gender
        except:
            return 'Other'

    def setSurviveStatus(self, row):
        try:
            # 0 - Deceased
            # 1 - Alive
            str_active = str(row['ActiveCases'])

            if str_active == 'Deceased':
                return 0
            else:
                return 1
        except:
            return 1

    def getAgeFromGroup(self, row):
        try:
            # We'll take the middle of the Age group
            # If a age range falls with 20, we'll
            # consider this as 10.
            # Similarly, a age group between 20 & 30,
            # should reflect by 25.
            # Anything above 80 will be considered as
            # 85

            str_age_group = str(row['AgeGroup'])

            if str_age_group == '<20':
                return 10
            elif str_age_group == '20-29':
                return 25
            elif str_age_group == '30-39':
                return 35
            elif str_age_group == '40-49':
                return 45
            elif str_age_group == '50-59':
                return 55
            elif str_age_group == '60-69':
                return 65
            elif str_age_group == '70-79':
                return 75
            else:
                return 85
        except:
            return 100

    def predictResult(self):
        try:
            
            # Initiating Logging Instances
            clog = log.clsL()

            # Important variables
            var = datetime.datetime.now().strftime(".%H.%M.%S")
            print('Target File Extension will contain the following:: ', var)
            Ind = self.Ind
            subdir = self.subdir

            #######################################
            #                                     #
            # Using Logistic Regression to        #
            # Idenitfy the following scenarios -  #
            #                                     #
            # Age wise Infection Vs Deaths        #
            #                                     #
            #######################################
            inputFileName_2 = self.fileName_2

            # Reading from Input File
            df_2 = p.read_csv(inputFileName_2)

            # Fetching only relevant columns
            df_2_Mod = df_2[['date_reported','age_group','gender','exposure','case_status']]
            df_2_Mod['State'] = df_2['province_abbr']

            print()
            print('Projecting 2nd file sample rows: ')
            print(df_2_Mod.head())

            print()
            x_row_1 = df_2_Mod.shape[0]
            x_col_1 = df_2_Mod.shape[1]

            print('Total Number of Rows: ', x_row_1)
            print('Total Number of columns: ', x_col_1)

            #########################################################################################
            # Few Assumptions                                                                       #
            #########################################################################################
            # By default, if there is no data on exposure - We'll treat that as community spreading #
            # By default, if there is no data on case_status - We'll consider this as active        #
            # By default, if there is no data on gender - We'll put that under a separate Gender    #
            # category marked as the "Other". This includes someone who doesn't want to identify    #
            # his/her gender or wants to be part of LGBT community in a generic term.               #
            #                                                                                       #
            # We'll transform our data accordingly based on the above logic.                        #
            #########################################################################################
            df_2_Mod['ActiveCases'] = df_2_Mod.apply(lambda row: self.setDefaultActiveCases(row), axis=1)
            df_2_Mod['ExposureStatus'] = df_2_Mod.apply(lambda row: self.setDefaultExposure(row), axis=1)
            df_2_Mod['Gender'] = df_2_Mod.apply(lambda row: self.setGender(row), axis=1)

            # Filtering all other records where we don't get any relevant information
            # Fetching Data for
            df_3 = df_2_Mod[(df_2_Mod['age_group'] != 'Not Reported')]

            # Dropping unwanted columns
            df_3.drop(columns=['exposure'], inplace=True)
            df_3.drop(columns=['case_status'], inplace=True)
            df_3.drop(columns=['date_reported'], inplace=True)
            df_3.drop(columns=['gender'], inplace=True)

            # Renaming one existing column
            df_3.rename(columns={"age_group": "AgeGroup"}, inplace=True)

            # Creating important feature
            # 0 - Deceased
            # 1 - Alive
            df_3['Survived'] = df_3.apply(lambda row: self.setSurviveStatus(row), axis=1)

            clog.logr('2.df_3' + var + '.csv', Ind, df_3, subdir)

            print()
            print('Projecting Filter sample rows: ')
            print(df_3.head())

            print()
            x_row_2 = df_3.shape[0]
            x_col_2 = df_3.shape[1]

            print('Total Number of Rows: ', x_row_2)
            print('Total Number of columns: ', x_col_2)

            # Let's do some basic checkings
            sns.set_style('whitegrid')
            #sns.countplot(x='Survived', hue='Gender', data=df_3, palette='RdBu_r')

            # Fixing Gender Column
            # This will check & indicate yellow for missing entries
            #sns.heatmap(df_3.isnull(), yticklabels=False, cbar=False, cmap='viridis')

            #sex = p.get_dummies(df_3['Gender'], drop_first=True)
            sex = p.get_dummies(df_3['Gender'])
            df_4 = p.concat([df_3, sex], axis=1)

            print('After New addition of columns: ')
            print(df_4.head())

            clog.logr('3.df_4' + var + '.csv', Ind, df_4, subdir)

            # Dropping unwanted columns for our Machine Learning
            df_4.drop(columns=['Gender'], inplace=True)
            df_4.drop(columns=['ActiveCases'], inplace=True)
            df_4.drop(columns=['Male','Other','Transgender'], inplace=True)

            clog.logr('4.df_4_Mod' + var + '.csv', Ind, df_4, subdir)

            # Fixing Spread Columns
            spread = p.get_dummies(df_4['ExposureStatus'], drop_first=True)
            df_5 = p.concat([df_4, spread], axis=1)

            print('After Spread columns:')
            print(df_5.head())

            clog.logr('5.df_5' + var + '.csv', Ind, df_5, subdir)

            # Dropping unwanted columns for our Machine Learning
            df_5.drop(columns=['ExposureStatus'], inplace=True)

            clog.logr('6.df_5_Mod' + var + '.csv', Ind, df_5, subdir)

            # Fixing Age Columns
            df_5['Age'] = df_5.apply(lambda row: self.getAgeFromGroup(row), axis=1)
            df_5.drop(columns=["AgeGroup"], inplace=True)

            clog.logr('7.df_6' + var + '.csv', Ind, df_5, subdir)

            # Fixing Dummy Columns Name
            # Renaming one existing column Travel-Related with Travel_Related
            df_5.rename(columns={"Travel-Related": "TravelRelated"}, inplace=True)

            clog.logr('8.df_7' + var + '.csv', Ind, df_5, subdir)

            # Removing state for temporary basis
            df_5.drop(columns=['State'], inplace=True)
            # df_5.drop(columns=['State','Other','Transgender','Pending','TravelRelated','Male'], inplace=True)

            # Casting this entire dataframe into Integer
            # df_5_temp.apply(p.to_numeric)

            print('Info::')
            print(df_5.info())
            print("*" * 60)
            print(df_5.describe())
            print("*" * 60)

            clog.logr('9.df_8' + var + '.csv', Ind, df_5, subdir)

            print('Intermediate Sample Dataframe for Age::')
            print(df_5.head())

            # Plotting it to Graph
            sns.jointplot(x="Age", y='Survived', data=df_5)
            sns.jointplot(x="Age", y='Survived', data=df_5, kind='kde', color='red')
            plt.xlabel("Age")
            plt.ylabel("Data Point (0 - Died   Vs    1 - Alive)")

            # Another check with Age Group
            sns.countplot(x='Survived', hue='Age', data=df_5, palette='RdBu_r')
            plt.xlabel("Survived(0 - Died   Vs    1 - Alive)")
            plt.ylabel("Total No Of Patient")

            df_6 = df_5.drop(columns=['Survived'], axis=1)

            clog.logr('10.df_9' + var + '.csv', Ind, df_6, subdir)

            # Train & Split Data
            x_1 = df_6
            y_1 = df_5['Survived']

            # Now Train-Test Split of your source data
            from sklearn.model_selection import train_test_split

            # test_size => % of allocated data for your test cases
            # random_state => A specific set of random split on your data
            X_train_1, X_test_1, Y_train_1, Y_test_1 = train_test_split(x_1, y_1, test_size=0.3, random_state=101)

            # Importing Model
            from sklearn.linear_model import LogisticRegression

            logmodel = LogisticRegression()
            logmodel.fit(X_train_1, Y_train_1)

            # Adding Predictions to it
            predictions_1 = logmodel.predict(X_test_1)

            from sklearn.metrics import classification_report

            print('Classification Report:: ')
            print(classification_report(Y_test_1, predictions_1))

            from sklearn.metrics import confusion_matrix

            print('Confusion Matrix:: ')
            print(confusion_matrix(Y_test_1, predictions_1))

            # This is require when you are trying to print from conventional
            # front & not using Jupyter notebook.
            plt.show()

            return 0

        except Exception  as e:
            x = str(e)
            print('Error : ', x)

            return 1

Key snippets from the above script –

df_2_Mod['ActiveCases'] = df_2_Mod.apply(lambda row: self.setDefaultActiveCases(row), axis=1)
df_2_Mod['ExposureStatus'] = df_2_Mod.apply(lambda row: self.setDefaultExposure(row), axis=1)
df_2_Mod['Gender'] = df_2_Mod.apply(lambda row: self.setGender(row), axis=1)

# Filtering all other records where we don't get any relevant information
# Fetching Data for
df_3 = df_2_Mod[(df_2_Mod['age_group'] != 'Not Reported')]

# Dropping unwanted columns
df_3.drop(columns=['exposure'], inplace=True)
df_3.drop(columns=['case_status'], inplace=True)
df_3.drop(columns=['date_reported'], inplace=True)
df_3.drop(columns=['gender'], inplace=True)

# Renaming one existing column
df_3.rename(columns={"age_group": "AgeGroup"}, inplace=True)

# Creating important feature
# 0 - Deceased
# 1 - Alive
df_3['Survived'] = df_3.apply(lambda row: self.setSurviveStatus(row), axis=1)

The above lines point to the critical transformation areas, where the application is invoking various essential business logic.

Let’s see at this moment our sample data –

6. 4_4_mod

Let’s look into the following part –

# Fixing Spread Columns
spread = p.get_dummies(df_4['ExposureStatus'], drop_first=True)
df_5 = p.concat([df_4, spread], axis=1)

The above lines will transform the data into this –

7. 5_5_Mod

As you can see, we’ve transformed the row values into columns with binary values. This kind of transformation is beneficial.

# Plotting it to Graph
sns.jointplot(x="Age", y='Survived', data=df_5)
sns.jointplot(x="Age", y='Survived', data=df_5, kind='kde', color='red')
plt.xlabel("Age")
plt.ylabel("Data Point (0 - Died   Vs    1 - Alive)")

# Another check with Age Group
sns.countplot(x='Survived', hue='Age', data=df_5, palette='RdBu_r')
plt.xlabel("Survived(0 - Died   Vs    1 - Alive)")
plt.ylabel("Total No Of Patient")

The above lines will process the data & visualize based on that.

x_1 = df_6
y_1 = df_5['Survived']

In the above snippet, we’ve assigned the features & target variable for our final logistic regression model.

# Now Train-Test Split of your source data
from sklearn.model_selection import train_test_split

# test_size => % of allocated data for your test cases
# random_state => A specific set of random split on your data
X_train_1, X_test_1, Y_train_1, Y_test_1 = train_test_split(x_1, y_1, test_size=0.3, random_state=101)

# Importing Model
from sklearn.linear_model import LogisticRegression

logmodel = LogisticRegression()
logmodel.fit(X_train_1, Y_train_1)

In the above snippet, we’re splitting the primary data & create a set of test & train data. Once we have the collection, the application will put the logistic regression model. And, finally, we’ll fit the training data.

# Adding Predictions to it
predictions_1 = logmodel.predict(X_test_1)

from sklearn.metrics import classification_report

print('Classification Report:: ')
print(classification_report(Y_test_1, predictions_1))

The above lines, finally use the model & then we feed our test data.

Let’s see how it runs –

5.1.Run_Windows
5.2. Run_Windows

And, here is the log directory –

4. Logs

For better understanding, I’m just clubbing both the diagram at one place & the final outcome is showing as follows –

1. MergeReport

So, from the above picture, we can see that the maximum vulnerable patients are patients who are 80+. The next two categories that also suffered are 70+ & 60+.

Also, We’ve checked the Female Vs. Male in the following code –

sns.countplot(x='Survived', hue='Female', data=df_5, palette='RdBu_r')
plt.xlabel("Survived(0 - Died   Vs    1 - Alive)")
plt.ylabel("Female Vs Male (Including Other Genders)")

And, the analysis represents through this –

8. Female_Male

In this case, you have to consider that the Male part includes all the other genders apart from the actual Male. Hence, I believe death for females would be more compared to people who identified themselves as males.

So, finally, we’ve done it.

During this challenging time, I would request you to follow strict health guidelines & stay healthy.

N.B.: All the data that are used here can be found in the public domain. We use this solely for educational purposes. You can find the details here.

Predicting Flipkart business growth factor using Linear-Regression Machine Learning Model

Hi Guys,

Today, We’ll be exploring the potential business growth factor using the “Linear-Regression Machine Learning” model. We’ve prepared a set of dummy data & based on that, we’ll predict.

Let’s explore a few sample data –

1. Sample Data

So, based on these data, we would like to predict YearlyAmountSpent dependent on any one of the following features, i.e. [ Time On App / Time On Website / Flipkart Membership Duration (In Year) ].

You need to install the following packages –

pip install pandas

pip install matplotlib

pip install sklearn

We’ll be discussing only the main calling script & class script. However, we’ll be posting the parameters without discussing it. And, we won’t discuss clsL.py as we’ve already discussed that in our previous post.

1. clsConfig.py (This script contains all the parameter details.)

################################################
#### Written By: SATYAKI DE                 ####
#### Written On: 15-May-2020                ####
####                                        ####
#### Objective: This script is a config     ####
#### file, contains all the keys for        ####
#### Machine-Learning. Application will     ####
#### process these information & perform    ####
#### various analysis on Linear-Regression. ####
################################################

import os
import platform as pl

class clsConfig(object):
    Curr_Path = os.path.dirname(os.path.realpath(__file__))

    os_det = pl.system()
    if os_det == "Windows":
        sep = '\\'
    else:
        sep = '/'

    config = {
        'APP_ID': 1,
        'ARCH_DIR': Curr_Path + sep + 'arch' + sep,
        'PROFILE_PATH': Curr_Path + sep + 'profile' + sep,
        'LOG_PATH': Curr_Path + sep + 'log' + sep,
        'REPORT_PATH': Curr_Path + sep + 'report',
        'FILE_NAME': Curr_Path + sep + 'Data' + sep + 'FlipkartCustomers.csv',
        'SRC_PATH': Curr_Path + sep + 'Data' + sep,
        'APP_DESC_1': 'IBM Watson Language Understand!',
        'DEBUG_IND': 'N',
        'INIT_PATH': Curr_Path
    }

2. clsLinearRegression.py (This is the main script, which will invoke the Machine-Learning API & return 0 if successful.)

##############################################
#### Written By: SATYAKI DE               ####
#### Written On: 15-May-2020              ####
#### Modified On 15-May-2020              ####
####                                      ####
#### Objective: Main scripts for Linear   ####
#### Regression.                          ####
##############################################

import pandas as p
import numpy as np
import regex as re

import matplotlib.pyplot as plt
from clsConfig import clsConfig as cf

# %matplotlib inline -- for Jupyter Notebook
class clsLinearRegression:
    def __init__(self):
        self.fileName =  cf.config['FILE_NAME']

    def predictResult(self):
        try:

            inputFileName = self.fileName

            # Reading from Input File
            df = p.read_csv(inputFileName)

            print()
            print('Projecting sample rows: ')
            print(df.head())

            print()
            x_row = df.shape[0]
            x_col = df.shape[1]

            print('Total Number of Rows: ', x_row)
            print('Total Number of columns: ', x_col)

            # Adding Features
            x = df[['TimeOnApp', 'TimeOnWebsite', 'FlipkartMembershipInYear']]

            # Target Variable - Trying to predict
            y = df['YearlyAmountSpent']

            # Now Train-Test Split of your source data
            from sklearn.model_selection import train_test_split

            # test_size => % of allocated data for your test cases
            # random_state => A specific set of random split on your data
            X_train, X_test, Y_train, Y_test = train_test_split(x, y, test_size=0.4, random_state=101)

            # Importing Model
            from sklearn.linear_model import LinearRegression

            # Creating an Instance
            lm = LinearRegression()

            # Train or Fit my model on Training Data
            lm.fit(X_train, Y_train)

            # Creating a prediction value
            flipKartSalePrediction = lm.predict(X_test)

            # Creating a scatter plot based on Actual Value & Predicted Value
            plt.scatter(Y_test, flipKartSalePrediction)

            # Adding meaningful Label
            plt.xlabel('Actual Values')
            plt.ylabel('Predicted Values')

            # Checking Individual Metrics
            from sklearn import metrics

            print()
            mea_val = metrics.mean_absolute_error(Y_test, flipKartSalePrediction)
            print('Mean Absolute Error (MEA): ', mea_val)

            mse_val = metrics.mean_squared_error(Y_test, flipKartSalePrediction)
            print('Mean Square Error (MSE): ', mse_val)

            rmse_val = np.sqrt(metrics.mean_squared_error(Y_test, flipKartSalePrediction))
            print('Square root Mean Square Error (RMSE): ', rmse_val)

            print()

            # Check Variance Score - R^2 Value
            print('Variance Score:')
            var_score = str(round(metrics.explained_variance_score(Y_test, flipKartSalePrediction) * 100, 2)).strip()
            print('Our Model is', var_score, '% accurate. ')
            print()

            # Finding Coeficent on X_train.columns
            print()
            print('Finding Coeficent: ')

            cedf = p.DataFrame(lm.coef_, x.columns, columns=['Coefficient'])
            print('Printing the All the Factors: ')
            print(cedf)

            print()

            # Getting the Max Value from it
            cedf['MaxFactorForBusiness'] = cedf['Coefficient'].max()

            # Filtering the max Value to identify the biggest Business factor
            dfMax = cedf[(cedf['MaxFactorForBusiness'] == cedf['Coefficient'])]

            # Dropping the derived column
            dfMax.drop(columns=['MaxFactorForBusiness'], inplace=True)
            dfMax = dfMax.reset_index()

            print(dfMax)

            # Extracting Actual Business Factor from Pandas dataframe
            str_factor_temp = str(dfMax.iloc[0]['index'])
            str_factor = re.sub("([a-z])([A-Z])", "\g<1> \g<2>", str_factor_temp)
            str_value = str(round(float(dfMax.iloc[0]['Coefficient']),2))

            print()
            print('*' * 80)
            print('Major Busienss Activity - (', str_factor, ') - ', str_value, '%')
            print('*' * 80)
            print()

            # This is require when you are trying to print from conventional
            # front & not using Jupyter notebook.
            plt.show()

            return 0

        except Exception  as e:
            x = str(e)
            print('Error : ', x)

            return 1

Key lines from the above snippet –

# Adding Features
x = df[['TimeOnApp', 'TimeOnWebsite', 'FlipkartMembershipInYear']]

Our application creating a subset of the main datagram, which contains all the features.

# Target Variable - Trying to predict
y = df['YearlyAmountSpent']

Now, the application is setting the target variable into ‘Y.’

# Now Train-Test Split of your source data
from sklearn.model_selection import train_test_split

# test_size => % of allocated data for your test cases
# random_state => A specific set of random split on your data
X_train, X_test, Y_train, Y_test = train_test_split(x, y, test_size=0.4, random_state=101)

As per “Supervised Learning,” our application is splitting the dataset into two subsets. One is to train the model & another segment is to test your final model. However, you can divide the data into three sets that include the performance statistics for a large dataset. In our case, we don’t need that as this data is significantly less.

# Train or Fit my model on Training Data
lm.fit(X_train, Y_train)

Our application is now training/fit the data into the model.

# Creating a scatter plot based on Actual Value & Predicted Value
plt.scatter(Y_test, flipKartSalePrediction)

Our application projected the outcome based on the predicted data in a scatterplot graph.

Also, the following concepts captured by using our program. For more details, I’ve provided the external link for your reference –

  1. Mean Absolute Error (MEA)
  2. Mean Square Error (MSE)
  3. Square Root Mean Square Error (RMSE)

And, the implementation has shown as –

mea_val = metrics.mean_absolute_error(Y_test, flipKartSalePrediction)
print('Mean Absolute Error (MEA): ', mea_val)

mse_val = metrics.mean_squared_error(Y_test, flipKartSalePrediction)
print('Mean Square Error (MSE): ', mse_val)

rmse_val = np.sqrt(metrics.mean_squared_error(Y_test, flipKartSalePrediction))
print('Square Root Mean Square Error (RMSE): ', rmse_val)

At this moment, we would like to check the credibility of our model by using the variance score are as follows –

var_score = str(round(metrics.explained_variance_score(Y_test, flipKartSalePrediction) * 100, 2)).strip()
print('Our Model is', var_score, '% accurate. ')

Finally, extracting the coefficient to find out, which particular feature will lead Flikkart for better sale & growth by taking the maximum of coefficient value month the all features are as shown below –

cedf = p.DataFrame(lm.coef_, x.columns, columns=['Coefficient'])

# Getting the Max Value from it
cedf['MaxFactorForBusiness'] = cedf['Coefficient'].max()

# Filtering the max Value to identify the biggest Business factor
dfMax = cedf[(cedf['MaxFactorForBusiness'] == cedf['Coefficient'])]

# Dropping the derived column
dfMax.drop(columns=['MaxFactorForBusiness'], inplace=True)
dfMax = dfMax.reset_index()

Note that we’ve used a regular expression to split the camel-case column name from our feature & represent that with a much more meaningful name without changing the column name.

# Extracting Actual Business Factor from Pandas dataframe
str_factor_temp = str(dfMax.iloc[0]['index'])
str_factor = re.sub("([a-z])([A-Z])", "\g<1> \g<2>", str_factor_temp)
str_value = str(round(float(dfMax.iloc[0]['Coefficient']),2))

print('Major Busienss Activity - (', str_factor, ') - ', str_value, '%')

3. callLinear.py (This is the first calling script.)

##############################################
#### Written By: SATYAKI DE               ####
#### Written On: 15-May-2020              ####
#### Modified On 15-May-2020              ####
####                                      ####
#### Objective: Main calling scripts.     ####
##############################################

from clsConfig import clsConfig as cf
import clsL as cl
import logging
import datetime
import clsLinearRegression as cw

# Disbling Warning
def warn(*args, **kwargs):
    pass

import warnings
warnings.warn = warn

# Lookup functions from
# Azure cloud SQL DB

var = datetime.datetime.now().strftime("%Y-%m-%d_%H-%M-%S")

def main():
    try:
        ret_1 = 0
        general_log_path = str(cf.config['LOG_PATH'])

        # Enabling Logging Info
        logging.basicConfig(filename=general_log_path + 'MachineLearning_LinearRegression.log', level=logging.INFO)

        # Initiating Log Class
        l = cl.clsL()

        # Moving previous day log files to archive directory
        log_dir = cf.config['LOG_PATH']
        curr_ver =datetime.datetime.now().strftime("%Y-%m-%d")

        tmpR0 = "*" * 157

        logging.info(tmpR0)
        tmpR9 = 'Start Time: ' + str(var)
        logging.info(tmpR9)
        logging.info(tmpR0)

        print("Log Directory::", log_dir)
        tmpR1 = 'Log Directory::' + log_dir
        logging.info(tmpR1)

        print('Machine Learning - Linear Regression Prediction : ')
        print('-' * 200)

        # Create the instance of the Linear-Regression Class
        x2 = cw.clsLinearRegression()

        ret = x2.predictResult()

        if ret == 0:
            print('Successful Linear-Regression Prediction Generated!')
        else:
            print('Failed to generate Linear-Regression Prediction!')

        print("-" * 200)
        print()

        print('Finding Analysis points..')
        print("*" * 200)
        logging.info('Finding Analysis points..')
        logging.info(tmpR0)


        tmpR10 = 'End Time: ' + str(var)
        logging.info(tmpR10)
        logging.info(tmpR0)

    except ValueError as e:
        print(str(e))
        logging.info(str(e))

    except Exception as e:
        print("Top level Error: args:{0}, message{1}".format(e.args, e.message))

if __name__ == "__main__":
    main()

Key snippet from the above script –

# Create the instance of the Linear-Regression
x2 = cw.clsLinearRegression()

ret = x2.predictResult()

In the above snippet, our application initially creating an instance of the main class & finally invokes the “predictResult” method.

Let’s run our application –

Step 1:

First, the application will fetch the following sample rows from our source file – if it is successful.

2. Run_1

Step 2:

Then, It will create the following scatterplot by executing the following snippet –

# Creating a scatter plot based on Actual Value & Predicted Value
plt.scatter(Y_test, flipKartSalePrediction)
3. Run_2

Note that our model is pretty accurate & it has a balanced success rate compared to our predicted numbers.

Step 3:

Finally, it is successfully able to project the critical feature are shown below –

4. Run_3

From the above picture, you can see that our model is pretty accurate (89% approx).

Also, highlighted red square identifying the key-features & their confidence score & finally, the projecting the winner feature marked in green.

So, as per that, we’ve come to one conclusion that Flipkart’s business growth depends on the tenure of their subscriber, i.e., old members are prone to buy more than newer members.

Let’s look into our directory structure –

5. Win_Dir

So, we’ve done it.

I’ll be posting another new post in the coming days. Till then, Happy Avenging! 😀

Note: All the data posted here are representational data & available over the internet & for educational purpose only.

Analyzing Language using IBM Watson using Python

Hi Guys,

Today, I’ll be discussing the following topic – “How to analyze text using IBM Watson implementing through Python.”

IBM has significantly improved in the field of Visual Image Analysis or Text language analysis using its IBM Watson cloud platform. In this particular topic, we’ll be exploring the natural languages only.

To access IBM API, we need to first create an IBM Cloud account from this site.

Let us quickly go through the steps to create the IBM Language Understanding service. Click the Catalog on top of your browser menu as shown in the below picture –

6. Creating an Instance for Watson

After that, click the AI option on your left-hand side of the panel marked in RED.

Click the Watson-Studio & later choose the plan. In our case, We’ll select the “Lite” option as IBM provided this platform for all the developers to explore their cloud for free.

7. Choosing AI
8. Choosing Plan

Clicking the create option will lead to a blank page of Watson Studio as shown below –

9. Choosing Watson Studio

And, now, we need to click the Get Started button to launch it. This will lead to Create Project page, which can be done using the following steps –

10. Create Project Initial Screen

Now, clicking the create a project will lead you to the next screen –

11. Create Project - Continue

You can choose either an empty project, or you can create it from a sample file. In this case, we’ll be selecting the first option & this will lead us to the below page –

12. Creating a Project

And, then you will click the “Create” option, which will lead you to the next screen –

13. Adding to project

Now, you need to click “Add to Project.” This will give you a variety of services that you want to explore/use from the list. If you want to create your own natural language classifier, which you can do that as follows –

14. Adding Natural Language Components from IBM Cloud

Once, you click it – you need to select the associate service –

15. Adding Associte Service - Sound

Here, you need to click the hyperlink, which prompts to the next screen –

16. Choosing Associate Service - Sound

You need to check the price for both the Visual & Natural Language Classifier. They are pretty expensive. The visual classifier has the Lite plan. However, it has limitations of output.

Clicking the “Create” will prompt to the next screen –

18. Selecting Region - Sound

After successful creation, you will be redirected to the following page –

19. Landing Page - Sound

Now, We’ll be adding our “Natural Language Understand” for our test –

29. Choosing Natural Language Understanding

This will prompt the next screen –

7. Choosing AI - Natural Language Understanding

Once, it is successful. You will see the service registered as shown below –

3. Watson Services - Sound

If you click the service marked in RED, it will lead you to another page, where you will get the API Key & Url. You need both of this information in Python application to access this API as shown below –

4. Watson API Details - Sound

Now, we’re ready with the necessary cloud set-up. After this, we need to install the Python package for IBM Cloud as shown below –

1. Installing_Packages

We’ve noticed that, recently, IBM has launched one upgraded package. Hence, we installed that one as well. I would recommend you to install this second package directly instead of the first one shown above –

2. Installing Latest IBM_Watson Package

Now, we’re done with our set-up.

Let’s see the directory structure –

31. Directory Structure

We’ll be discussing only the main calling script & class script. However, we’ll be posting the parameters without discussing it. And, we won’t discuss clsL.py as we’ve already discussed that in our previous post.

1. clsConfig.py (This script contains all the parameter details.)

##############################################
#### Written By: SATYAKI DE               ####
#### Written On: 04-Apr-2020              ####
####                                      ####
#### Objective: This script is a config   ####
#### file, contains all the keys for      ####
#### IBM Cloud API.   Application will    ####
#### process these information & perform  ####
#### various analysis on IBM Watson cloud.####
##############################################

import os
import platform as pl

class clsConfig(object):
    Curr_Path = os.path.dirname(os.path.realpath(__file__))

    os_det = pl.system()
    if os_det == "Windows":
        sep = '\\'
    else:
        sep = '/'

    config = {
        'APP_ID': 1,
        'SERVICE_URL': "https://api.eu-gb.natural-language-understanding.watson.cloud.ibm.com/instances/xxxxxxxxxxxxxxXXXXXXXXXXxxxxxxxxxxxxxxxx",
        'API_KEY': "Xxxxxxxxxxxxxkdkdfifd984djddkkdkdkdsSSdkdkdd",
        'API_TYPE': "application/json",
        'CACHE': "no-cache",
        'CON': "keep-alive",
        'ARCH_DIR': Curr_Path + sep + 'arch' + sep,
        'PROFILE_PATH': Curr_Path + sep + 'profile' + sep,
        'LOG_PATH': Curr_Path + sep + 'log' + sep,
        'REPORT_PATH': Curr_Path + sep + 'report',
        'SRC_PATH': Curr_Path + sep + 'Src_File' + sep,
        'APP_DESC_1': 'IBM Watson Language Understand!',
        'DEBUG_IND': 'N',
        'INIT_PATH': Curr_Path
    }

Note that you will be placing your API_KEY & URL here, as shown in the configuration file.

2. clsIBMWatson.py (This is the main script, which will invoke the IBM Watson API based on the input from the user & return 0 if successful.)

##############################################
#### Written By: SATYAKI DE               ####
#### Written On: 04-Apr-2020              ####
#### Modified On 04-Apr-2020              ####
####                                      ####
#### Objective: Main scripts to invoke    ####
#### IBM Watson Language Understand API.  ####
##############################################

import logging
from clsConfig import clsConfig as cf
import clsL as cl
import json
from ibm_watson import NaturalLanguageUnderstandingV1
from ibm_cloud_sdk_core.authenticators import IAMAuthenticator
from ibm_watson.natural_language_understanding_v1 import Features, EntitiesOptions, KeywordsOptions, SentimentOptions, CategoriesOptions, ConceptsOptions
from ibm_watson import ApiException

class clsIBMWatson:
    def __init__(self):
        self.api_key =  cf.config['API_KEY']
        self.service_url = cf.config['SERVICE_URL']

    def calculateExpressionFromUrl(self, inputUrl, inputVersion):
        try:
            api_key = self.api_key
            service_url = self.service_url
            print('-' * 60)
            print('Beginning of the IBM Watson for Input Url.')
            print('-' * 60)

            authenticator = IAMAuthenticator(api_key)

            # Authentication via service credentials provided in our config files
            service = NaturalLanguageUnderstandingV1(version=inputVersion, authenticator=authenticator)
            service.set_service_url(service_url)

            response = service.analyze(
                url=inputUrl,
                features=Features(entities=EntitiesOptions(),
                                  sentiment=SentimentOptions(),
                                  concepts=ConceptsOptions())).get_result()

            print(json.dumps(response, indent=2))

            return 0

        except ApiException as ex:
            print('-' * 60)
            print("Method failed for Url with status code " + str(ex.code) + ": " + ex.message)
            print('-' * 60)

            return 1

    def calculateExpressionFromText(self, inputText, inputVersion):
        try:
            api_key = self.api_key
            service_url = self.service_url
            print('-' * 60)
            print('Beginning of the IBM Watson for Input Url.')
            print('-' * 60)

            authenticator = IAMAuthenticator(api_key)

            # Authentication via service credentials provided in our config files
            service = NaturalLanguageUnderstandingV1(version=inputVersion, authenticator=authenticator)
            service.set_service_url(service_url)

            response = service.analyze(
                text=inputText,
                features=Features(entities=EntitiesOptions(),
                                  sentiment=SentimentOptions(),
                                  concepts=ConceptsOptions())).get_result()

            print(json.dumps(response, indent=2))

            return 0

        except ApiException as ex:
            print('-' * 60)
            print("Method failed for Url with status code " + str(ex.code) + ": " + ex.message)
            print('-' * 60)

            return 1

Some of the key lines from the above snippet –

authenticator = IAMAuthenticator(api_key)

# Authentication via service credentials provided in our config files
service = NaturalLanguageUnderstandingV1(version=inputVersion, authenticator=authenticator)
service.set_service_url(service_url)

By providing the API Key & Url, the application is initiating the service for Watson.

response = service.analyze(
    url=inputUrl,
    features=Features(entities=EntitiesOptions(),
                      sentiment=SentimentOptions(),
                      concepts=ConceptsOptions())).get_result()

Based on your type of input, it will bring the features of entities, sentiment & concepts here. Apart from that, you can additionally check the following features as well – Keywords & Categories.

3. callIBMWatsonAPI.py (This is the first calling script. Based on user choice, it will receive input either as Url or as the plain text & then analyze it.)

##############################################
#### Written By: SATYAKI DE               ####
#### Written On: 04-Apr-2020              ####
#### Modified On 04-Apr-2020              ####
####                                      ####
#### Objective: Main calling scripts.     ####
##############################################

from clsConfig import clsConfig as cf
import clsL as cl
import logging
import datetime
import clsIBMWatson as cw

# Disbling Warning
def warn(*args, **kwargs):
    pass

import warnings
warnings.warn = warn

# Lookup functions from
# Azure cloud SQL DB

var = datetime.datetime.now().strftime("%Y-%m-%d_%H-%M-%S")

def main():
    try:
        ret_1 = 0
        general_log_path = str(cf.config['LOG_PATH'])

        # Enabling Logging Info
        logging.basicConfig(filename=general_log_path + 'IBMWatson_NaturalLanguageAnalysis.log', level=logging.INFO)

        # Initiating Log Class
        l = cl.clsL()

        # Moving previous day log files to archive directory
        log_dir = cf.config['LOG_PATH']
        curr_ver =datetime.datetime.now().strftime("%Y-%m-%d")

        tmpR0 = "*" * 157

        logging.info(tmpR0)
        tmpR9 = 'Start Time: ' + str(var)
        logging.info(tmpR9)
        logging.info(tmpR0)

        print("Log Directory::", log_dir)
        tmpR1 = 'Log Directory::' + log_dir
        logging.info(tmpR1)

        print('Welcome to IBM Wantson Language Understanding Calling Program: ')
        print('-' * 60)
        print('Please Press 1 for Understand the language from Url.')
        print('Please Press 2 for Understand the language from your input-text.')
        input_choice = int(input('Please provide your choice:'))

        # Create the instance of the IBM Watson Class
        x2 = cw.clsIBMWatson()

        # Let's pass this to our map section
        if input_choice == 1:
            textUrl = str(input('Please provide the complete input url:'))
            ret_1 = x2.calculateExpressionFromUrl(textUrl, curr_ver)
        elif input_choice == 2:
            inputText = str(input('Please provide the input text:'))
            ret_1 = x2.calculateExpressionFromText(inputText, curr_ver)
        else:
            print('Invalid options!')

        if ret_1 == 0:
            print('Successful IBM Watson Language Understanding Generated!')
        else:
            print('Failed to generate IBM Watson Language Understanding!')

        print("-" * 60)
        print()

        print('Finding Analysis points..')
        print("*" * 157)
        logging.info('Finding Analysis points..')
        logging.info(tmpR0)


        tmpR10 = 'End Time: ' + str(var)
        logging.info(tmpR10)
        logging.info(tmpR0)

    except ValueError as e:
        print(str(e))
        print("Invalid option!")
        logging.info("Invalid option!")

    except Exception as e:
        print("Top level Error: args:{0}, message{1}".format(e.args, e.message))

if __name__ == "__main__":
    main()

This script is pretty straight forward as it is first creating an instance of the main class & then based on the user input, it is calling the respective functions here.

As of now, IBM Watson can work on a list of languages, which are available here.

If you want to start from scratch, please refer to the following link.

Please find the screenshot of our application run –

Case 1 (With Url): 

21. Win_Run_1_Url
23. Win_Run_3_Url

Case 2 (With Plain text):

25. Win_Run_1_InputText
26. Win_Run_2_InputText
27. Win_Run_3_InputText

Now, Don’t forget to delete all the services from your IBM Cloud.

32. Delete Service

As you can see, from the service, you need to delete all the services one-by-one as shown in the figure.

So, we’ve done it.

To explore my photography, you can visit the following link.

I’ll be posting another new post in the coming days. Till then, Happy Avenging! 😀

Note: All the data posted here are representational data & available over the internet & for educational purpose only.

Creating a Cross-platform GUI based application using native Python using PyQt5

Hi Guys!

Today, We’ll be discussing one more graphical package in Python, which is also known as PyQt. To faster design the GUI, we’ll be exploring another tool called Qt Designer, which is available for multiple OS platforms.

Please find the QT Designer here.

This is similar to any other GUI based IDE like Microsoft Visual Studio, where you can quickly generate your GUI template.

The majority of the internet post talks about using PyQt5 or PyQt4 packages. But, when speaking about using the .ui file inside your Python code – they either demonstrate fundamental options without any event or, they convert & generate the .ui file into .py file & then they use it. This certainly not making it very useful for many of the developers who are trying to use it for the first time. Hence, My main goal is to use the .ui file inside my Python script as it is & use all the components out of it & assign various working events.

In this post, we’ll discuss only with one script & then we’ll showcase the output in the form of video (No audio). You can verify the output for both MAC & Windows.

Before we start, let us check the directory structure between Windows & MAC –

2. MAC & Win Directory Structure

Let us explore how the GUI should look like ->

3. GUI Design

So, as you can see that this tool is like any other GUI based tool, basically you can create anything by simply drag & drop method.

Before we start discussing our code, here is the sample basicAdv.ui file for your reference.

You need to install the following framework –

pip install PyQt5

1. GUIPyQt5.py (This script contains all the GUI details & it will invoke the instance along with the logic.)

##############################################
#### Written By: SATYAKI DE               ####
#### Written On: 12-Mar-2020              ####
#### Modified On 12-Mar-2020              ####
####                                      ####
#### Objective: Main calling scripts.     ####
##############################################

from PyQt5 import QtWidgets, uic, QtGui, QtCore
from PyQt5.QtWidgets import *
import sys

class Ui(QtWidgets.QMainWindow):
    def __init__(self):
        # Instantiating the main class
        super(Ui, self).__init__()

        # Loading the Graphical Design without
        # converting it to any kind of Python code
        uic.loadUi('basicAdv.ui', self)

        # Adding all the essential buttons
        self.prtBtn = self.findChild(QtWidgets.QPushButton, 'prtBtn') # Find the button
        self.prtBtn.clicked.connect(self.printButtonClick) # Remember to pass the definition/method, not the return value!

        self.clrBtn = self.findChild(QtWidgets.QPushButton, 'clrBtn')  # Find the button
        self.clrBtn.clicked.connect(self.clearButtonClick)  # Remember to pass the definition/method, not the return value!

        self.addBtn = self.findChild(QtWidgets.QPushButton, 'addBtn')  # Find the button
        self.addBtn.clicked.connect(self.addItem)  # Remember to pass the definition/method, not the return value!

        self.selectImgBtn = self.findChild(QtWidgets.QPushButton, 'selectImgBtn')  # Find the button
        self.selectImgBtn.clicked.connect(self.setImage)  # Remember to pass the definition/method, not the return value!

        self.cnfBtn = self.findChild(QtWidgets.QPushButton, 'cnfBtn')  # Find the button
        self.cnfBtn.clicked.connect(self.showDialog)  # Remember to pass the definition/method, not the return value!

        # Adding other static input/output elements
        self.input = self.findChild(QtWidgets.QLineEdit, 'input')
        self.qlabel = self.findChild(QtWidgets.QLabel, 'qlabel')
        self.lineEdit = self.findChild(QtWidgets.QLineEdit, 'lineEdit')
        self.listWidget = self.findChild(QtWidgets.QListWidget, 'listWidget')
        self.imageLbl = self.findChild(QtWidgets.QLabel, 'imageLbl')

        # Adding Combobox
        self.combo = self.findChild(QtWidgets.QComboBox, 'sComboBox')  # Find the ComboBox

        # Adding static element to it
        self.combo.addItem("Sourav Ganguly")
        self.combo.addItem("Kapil Dev")
        self.combo.addItem("Sunil Gavaskar")
        self.combo.addItem("M. S. Dhoni")

        # Click Event
        self.combo.activated[str].connect(self.onChanged)  # Remember to pass the definition/method, not the return value!

        # Adding list Box
        self.listwidget2 = self.findChild(QtWidgets.QListWidget, 'listwidget2')  # Find the List

        # Adding static element to it
        self.listwidget2.insertItem(0, "Aamir Khan")
        self.listwidget2.insertItem(1, "Shahruk Khan")
        self.listwidget2.insertItem(2, "Salman Khan")
        self.listwidget2.insertItem(3, "Hrittik Roshon")
        self.listwidget2.insertItem(4, "Amitabh Bachhan")

        # Click Event
        self.listwidget2.clicked.connect(self.showIndividualElement)

        # Adding Group Box
        self.groupBox = self.findChild(QtWidgets.QGroupBox, 'groupBox')  # Find the ComboBox
        self.groupBox.setCheckable(True)

        # Adding Individual Radio Button
        self.rdButton1 = self.findChild(QtWidgets.QRadioButton, 'rdButton1')  # Find the button
        self.rdButton1.setChecked(True)
        self.rdButton1.toggled.connect(lambda: self.printRadioButtonClick(self.rdButton1))  # Remember to pass the definition/method, not the return value!

        self.rdButton2 = self.findChild(QtWidgets.QRadioButton, 'rdButton2')  # Find the button
        self.rdButton2.toggled.connect(lambda: self.printRadioButtonClick(self.rdButton2))  # Remember to pass the definition/method, not the return value!

        self.rdButton3 = self.findChild(QtWidgets.QRadioButton, 'rdButton3')  # Find the button
        self.rdButton3.toggled.connect(lambda: self.printRadioButtonClick(self.rdButton3))  # Remember to pass the definition/method, not the return value!

        self.rdButton4 = self.findChild(QtWidgets.QRadioButton, 'rdButton4')  # Find the button
        self.rdButton4.toggled.connect(lambda: self.printRadioButtonClick(self.rdButton4))  # Remember to pass the definition/method, not the return value!

        self.show()

    def printRadioButtonClick(self, radioOption):

        if radioOption.text() == 'China':
            if radioOption.isChecked() == True:
                print(radioOption.text() + ' is selected')
            else:
                print(radioOption.text() + ' is deselected')

        if radioOption.text() == 'India':
            if radioOption.isChecked() == True:
                print(radioOption.text() + ' is selected')
            else:
                print(radioOption.text() + ' is deselected')

        if radioOption.text() == 'Japan':
            if radioOption.isChecked() == True:
                print(radioOption.text() + ' is selected')
            else:
                print(radioOption.text() + ' is deselected')

        if radioOption.text() == 'France':
            if radioOption.isChecked() == True:
                print(radioOption.text() + ' is selected')
            else:
                print(radioOption.text() + ' is deselected')

    def printButtonClick(self):
        # This is executed when the button is pressed
        print('Input text:' + self.input.text())

    def clearButtonClick(self):
        # This is executed when the button is pressed
        self.input.clear()

    def onChanged(self, text):
        self.qlabel.setText(text)
        self.qlabel.adjustSize()
        self.lineEdit.clear()  # Clear the text

    def addItem(self):
        value = self.lineEdit.text() # Get the value of the lineEdit
        self.lineEdit.clear() # Clear the text
        self.listWidget.addItem(value) # Add the value we got to the list

    def setImage(self):
        fileName, _ = QtWidgets.QFileDialog.getOpenFileName(None, "Select Image", "", "Image Files (*.png *.jpg *jpeg *.bmp);;All Files (*)") # Ask for file
        if fileName: # If the user gives a file
            pixmap = QtGui.QPixmap(fileName) # Setup pixmap with the provided image
            pixmap = pixmap.scaled(self.imageLbl.width(), self.imageLbl.height(), QtCore.Qt.KeepAspectRatio) # Scale pixmap
            self.imageLbl.setPixmap(pixmap) # Set the pixmap onto the label
            self.imageLbl.setAlignment(QtCore.Qt.AlignCenter) # Align the label to center

    def showDialog(self):
        msgBox = QMessageBox()
        msgBox.setIcon(QMessageBox.Information)
        msgBox.setText("Message box pop up window")
        msgBox.setWindowTitle("MessageBox Example")
        msgBox.setStandardButtons(QMessageBox.Ok | QMessageBox.Cancel)
        msgBox.buttonClicked.connect(self.msgButtonClick)

        returnValue = msgBox.exec()
        if returnValue == QMessageBox.Ok:
            print('OK clicked')

    def msgButtonClick(self, i):
        print("Button clicked is:", i.text())

    def showIndividualElement(self, qmodelindex):
        item = self.listwidget2.currentItem()
        print(item.text())

if __name__ == "__main__":

    import sys
    app = QtWidgets.QApplication(sys.argv)
    window = Ui()
    window.show()
    sys.exit(app.exec_())

Let us explore a few key lines from this script. Rests are almost identical.

# Loading the Graphical Design without
# converting it to any kind of Python code
uic.loadUi('basicAdv.ui', self)

Loading the GUI created using Qt Designer into the Python environment.

# Adding all the essential buttons
self.prtBtn = self.findChild(QtWidgets.QPushButton, 'prtBtn') # Find the button
self.prtBtn.clicked.connect(self.printButtonClick) # Remember to pass the definition/method, not the return value!

In this case, we’re dynamically binding the component from the GUI by using the findChild method & then on the next line, we’re invoking the appropriate event associated with that. In this case, it is – self.printButtonClick.

The printButtonClick as mentioned earlier is a method & that contains the following snippet –

def printButtonClick(self):
    # This is executed when the button is pressed
    print('Input text:' + self.input.text())

As you can see, this event will capture the text from the input textbox & print it on our terminal.

Here is the snippet for those widgets, which is part of only input/output & they generally don’t have an event of their own. But, we need to bind them with our Python application.

# Adding other static input/output elements
self.input = self.findChild(QtWidgets.QLineEdit, 'input')
self.qlabel = self.findChild(QtWidgets.QLabel, 'qlabel')
self.lineEdit = self.findChild(QtWidgets.QLineEdit, 'lineEdit')
self.listWidget = self.findChild(QtWidgets.QListWidget, 'listWidget')

This application has drop-down list & hence, we’ve added some static value during our load of this application & that can be seen here –

# Adding list Box
self.listwidget2 = self.findChild(QtWidgets.QListWidget, 'listwidget2')  # Find the List

# Adding static element to it
self.listwidget2.insertItem(0, "Aamir Khan")
self.listwidget2.insertItem(1, "Shahruk Khan")
self.listwidget2.insertItem(2, "Salman Khan")
self.listwidget2.insertItem(3, "Hrittik Roshon")
self.listwidget2.insertItem(4, "Amitabh Bachhan")

Once, the user will select a specific value from this list, the app will execute the following event as shown below –

# Click Event
self.listwidget2.clicked.connect(self.showIndividualElement)

Again, to explore the method, you need to view the given logic –

def showIndividualElement(self, qmodelindex):
    item = self.listwidget2.currentItem()
    print(item.text())

Group Box, along with the radio button, works slightly different than our drop-down list.

For each radio button, we’ll have a dedicated text value that represents a different country in this context.

And, our application will bind all the radio button & then they will use one standard method for all of these four options as shown below –

# Adding Individual Radio Button
self.rdButton1 = self.findChild(QtWidgets.QRadioButton, 'rdButton1')  # Find the button
self.rdButton1.setChecked(True)
self.rdButton1.toggled.connect(lambda: self.printRadioButtonClick(self.rdButton1))  # Remember to pass the definition/method, not the return value!

self.rdButton2 = self.findChild(QtWidgets.QRadioButton, 'rdButton2')  # Find the button
self.rdButton2.toggled.connect(lambda: self.printRadioButtonClick(self.rdButton2))  # Remember to pass the definition/method, not the return value!

self.rdButton3 = self.findChild(QtWidgets.QRadioButton, 'rdButton3')  # Find the button
self.rdButton3.toggled.connect(lambda: self.printRadioButtonClick(self.rdButton3))  # Remember to pass the definition/method, not the return value!

self.rdButton4 = self.findChild(QtWidgets.QRadioButton, 'rdButton4')  # Find the button
self.rdButton4.toggled.connect(lambda: self.printRadioButtonClick(self.rdButton4))  # Remember to pass the definition/method, not the return value!

Also, note that, by default, rdButton1 is set to True i.e., it will be selected when the form load initially.

Let’s explore the printRadioButtonClick event.

def printRadioButtonClick(self, radioOption):

    if radioOption.text() == 'China':
        if radioOption.isChecked() == True:
            print(radioOption.text() + ' is selected')
        else:
            print(radioOption.text() + ' is deselected')

    if radioOption.text() == 'India':
        if radioOption.isChecked() == True:
            print(radioOption.text() + ' is selected')
        else:
            print(radioOption.text() + ' is deselected')

    if radioOption.text() == 'Japan':
        if radioOption.isChecked() == True:
            print(radioOption.text() + ' is selected')
        else:
            print(radioOption.text() + ' is deselected')

    if radioOption.text() == 'France':
        if radioOption.isChecked() == True:
            print(radioOption.text() + ' is selected')
        else:
            print(radioOption.text() + ' is deselected')

This will capture the radio button option & based on the currently clicked button, it will fetch the text out of it. Finally, that will match with the logic here & based on that, our application will display the output.

Finally, the Image process is slightly different.

Initially, our application will load the component from the .ui file & bind them with the Python environment –

self.imageLbl = self.findChild(QtWidgets.QLabel, 'imageLbl')

Image load option will only work when the user clicks the button that triggers the following sets of actions –

self.selectImgBtn = self.findChild(QtWidgets.QPushButton, 'selectImgBtn')  # Find the button
self.selectImgBtn.clicked.connect(self.setImage)  # Remember to pass the definition/method, not the return value!

Let’s explore the setImage method –

def setImage(self):
    fileName, _ = QtWidgets.QFileDialog.getOpenFileName(None, "Select Image", "", "Image Files (*.png *.jpg *jpeg *.bmp);;All Files (*)") # Ask for file
    if fileName: # If the user gives a file
        pixmap = QtGui.QPixmap(fileName) # Setup pixmap with the provided image
        pixmap = pixmap.scaled(self.imageLbl.width(), self.imageLbl.height(), QtCore.Qt.KeepAspectRatio) # Scale pixmap
        self.imageLbl.setPixmap(pixmap) # Set the pixmap onto the label
        self.imageLbl.setAlignment(QtCore.Qt.AlignCenter) # Align the label to center

This will prompt the corresponding dialogue box for choosing the right images out of the respective O/S.

Last but not least, the use of MsgBox, which can be extremely useful for many GUI based programming.

This msgbox doesn’t exist in the form. However, we’re creating it on the event of the “Confirm Button” as shown below –

self.cnfBtn = self.findChild(QtWidgets.QPushButton, 'cnfBtn')  # Find the button
self.cnfBtn.clicked.connect(self.showDialog)  # Remember to pass the definition/method, not the return value!

This will prompt the showDialog method to trigger –

def showDialog(self):
    msgBox = QMessageBox()
    msgBox.setIcon(QMessageBox.Information)
    msgBox.setText("Message box pop up window")
    msgBox.setWindowTitle("MessageBox Example")
    msgBox.setStandardButtons(QMessageBox.Ok | QMessageBox.Cancel)
    msgBox.buttonClicked.connect(self.msgButtonClick)

    returnValue = msgBox.exec()
    if returnValue == QMessageBox.Ok:
        print('OK clicked')

And, based on your options (“OK”/”Cancel”), it will prompt the final captured message in your console.

Let’s explore the videos of output from Windows O/S –

Let’s explore the video output from MAC VM –

For more information on this package – please check the following link.

So, as you can see, finally we’ve achieved it. We’ve demonstrated cross-platform GUI applications using native Python. And, here we didn’t even convert the ui design file to python script either.

Please share your feedback.

I’ll be posting another new post in the coming days. Till then, Happy Avenging! 😀

Note: All the data posted here are representational data & available over the internet & for educational purpose only.