
Hi Team,
We’ll enhance our last post on Covid-19 prediction & try to capture them in a real-time dashboard, where the values in the visual display points will be affected as soon as the source data changes. In short, this is genuinely a real-time visual dashboard displaying all the graphs, trends depending upon the third-party API source data change.
However, I would like to share the run before we dig deep into this.
Architecture:
Let us understand the architecture for this solution –

From the above diagram, one can see that we’re maintaining a similar approach compared to our last initiative. However, we’ve used a different framework to display the data live.
To achieve this, we’ve used a compelling python-based framework called Dash. Other than that, we’ve used Ably, Plotly & Prophet API.
If you need to know more about our last post, please visit this link.
Package Installation:
Let us understand the sample packages that require for this task.
Step – 1:
Step – 2:
Step – 3:
Step – 4:
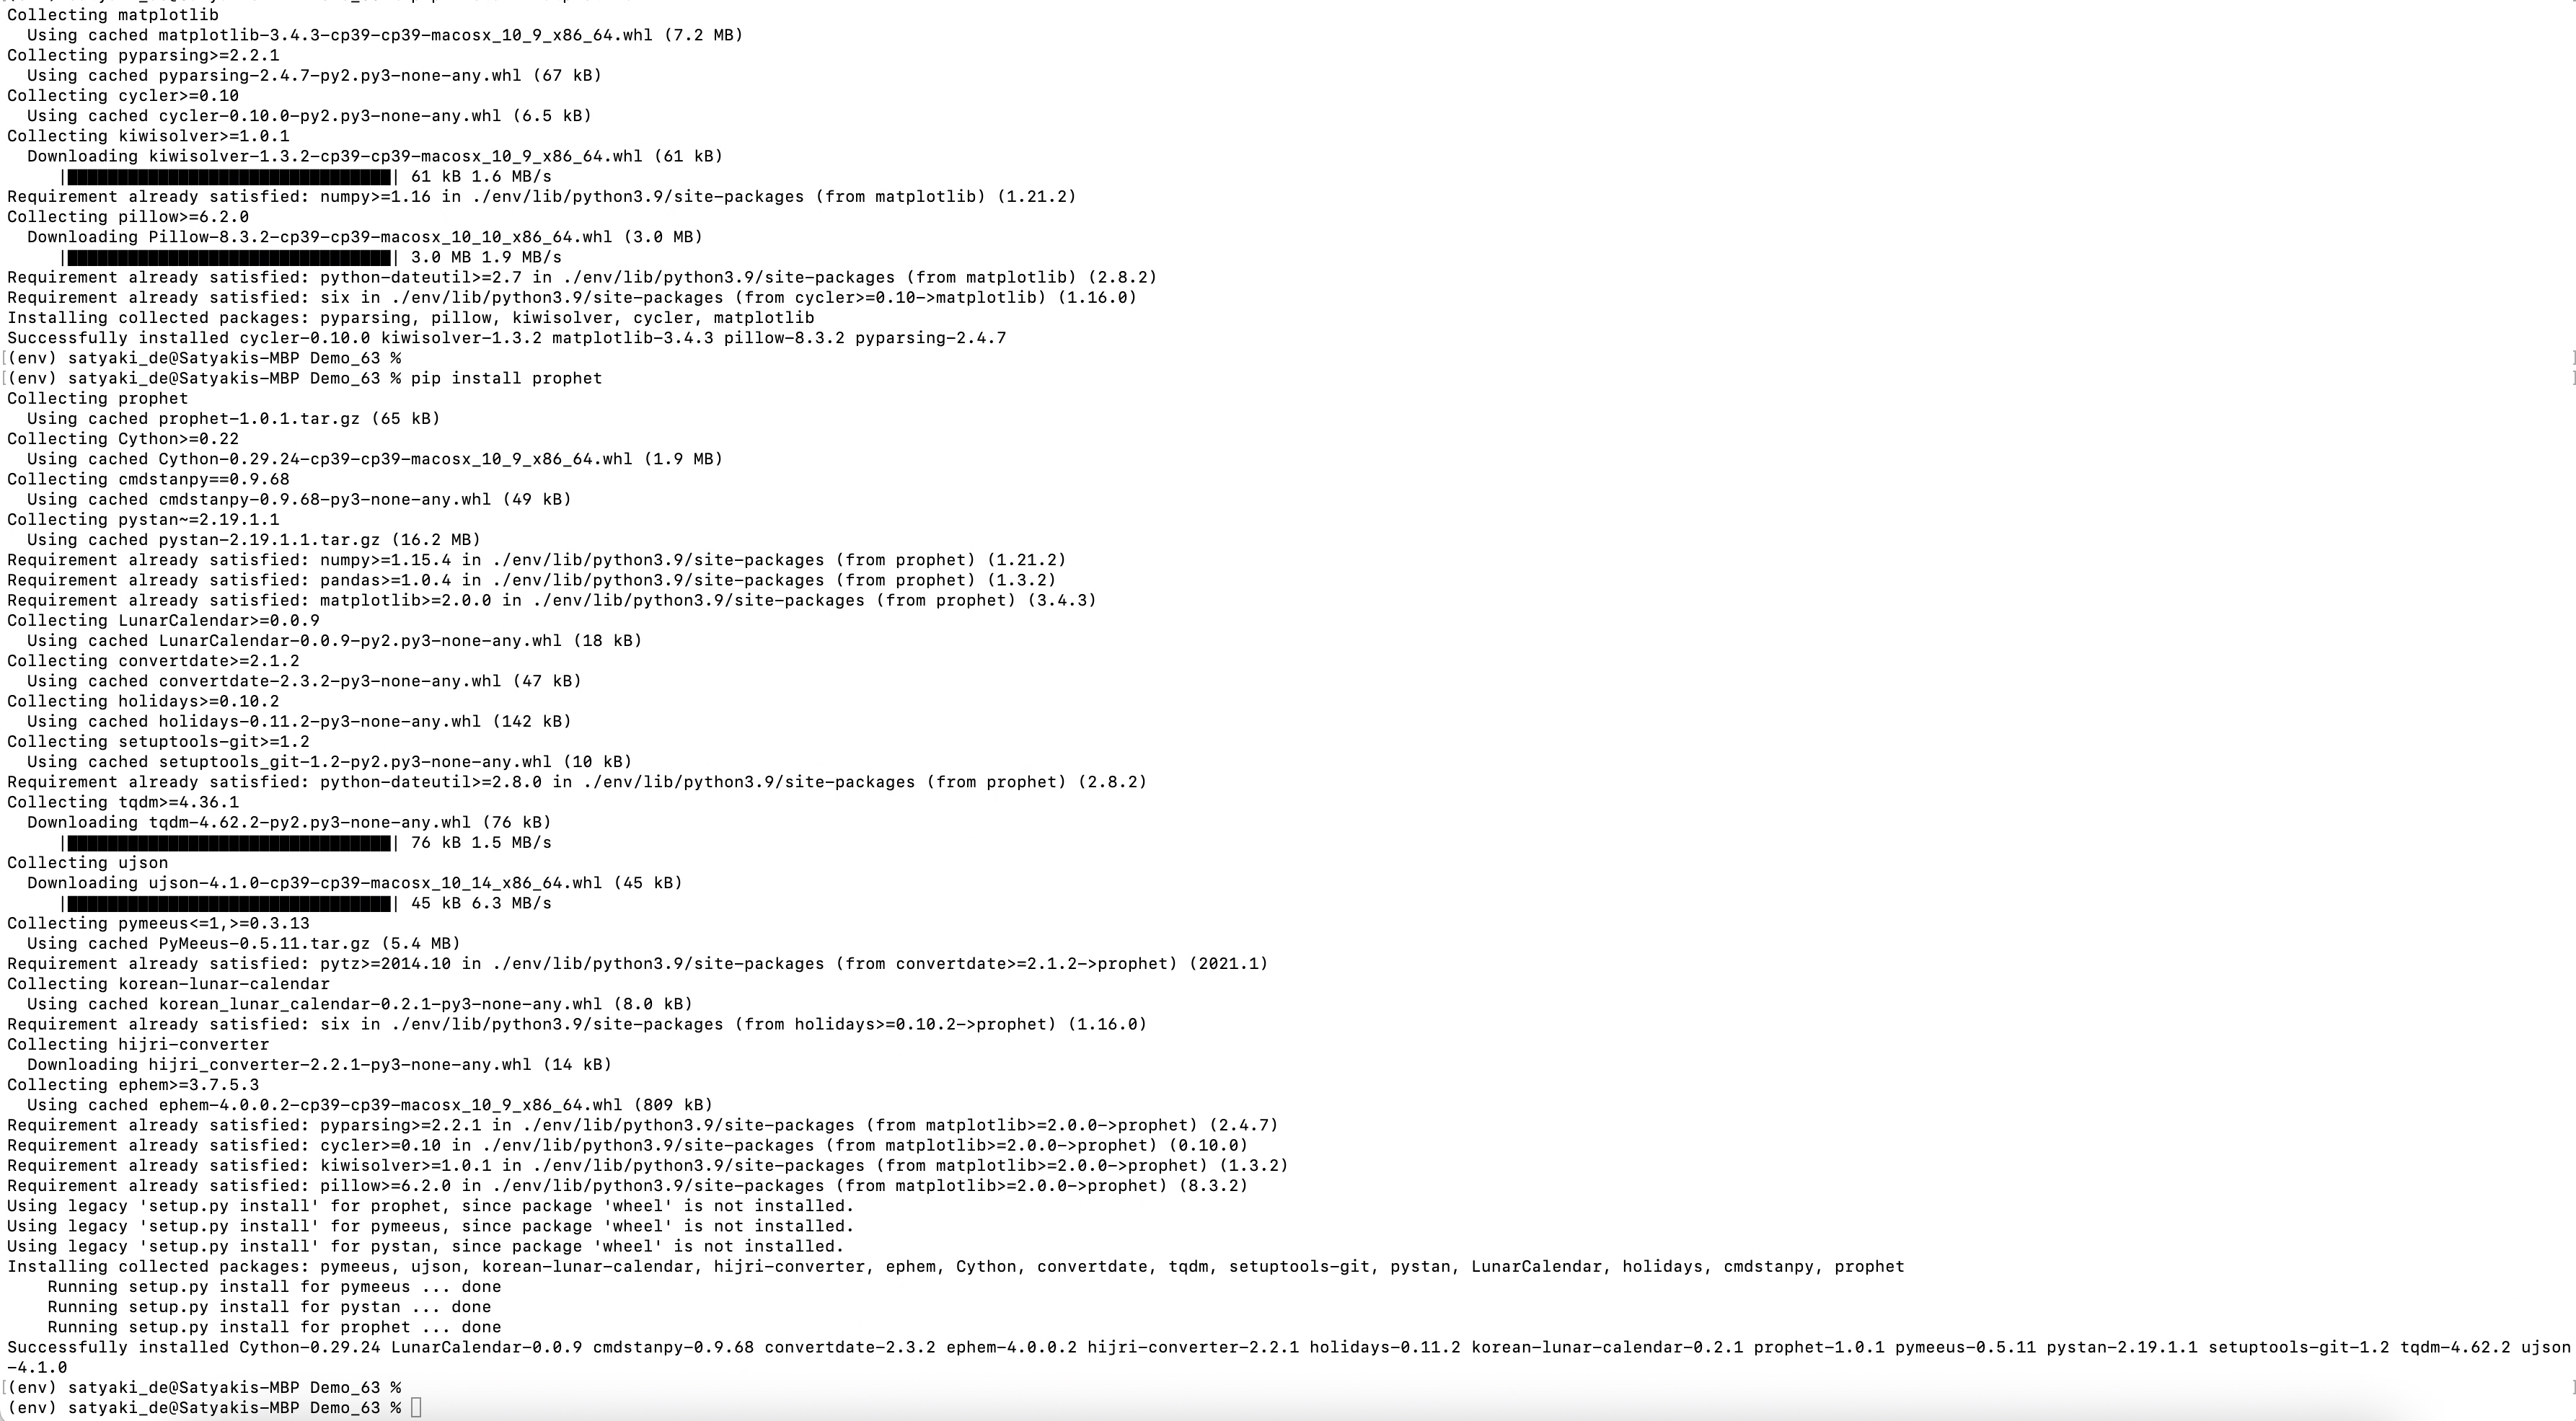
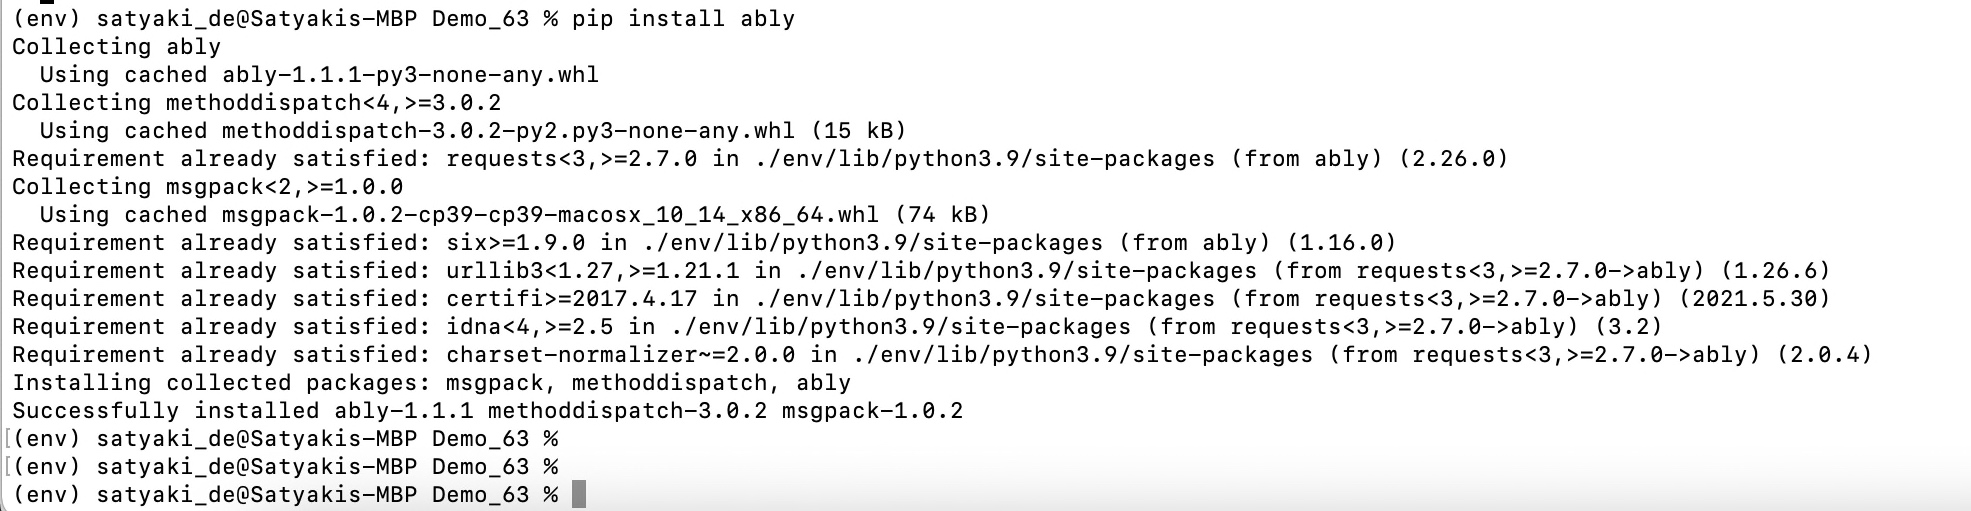
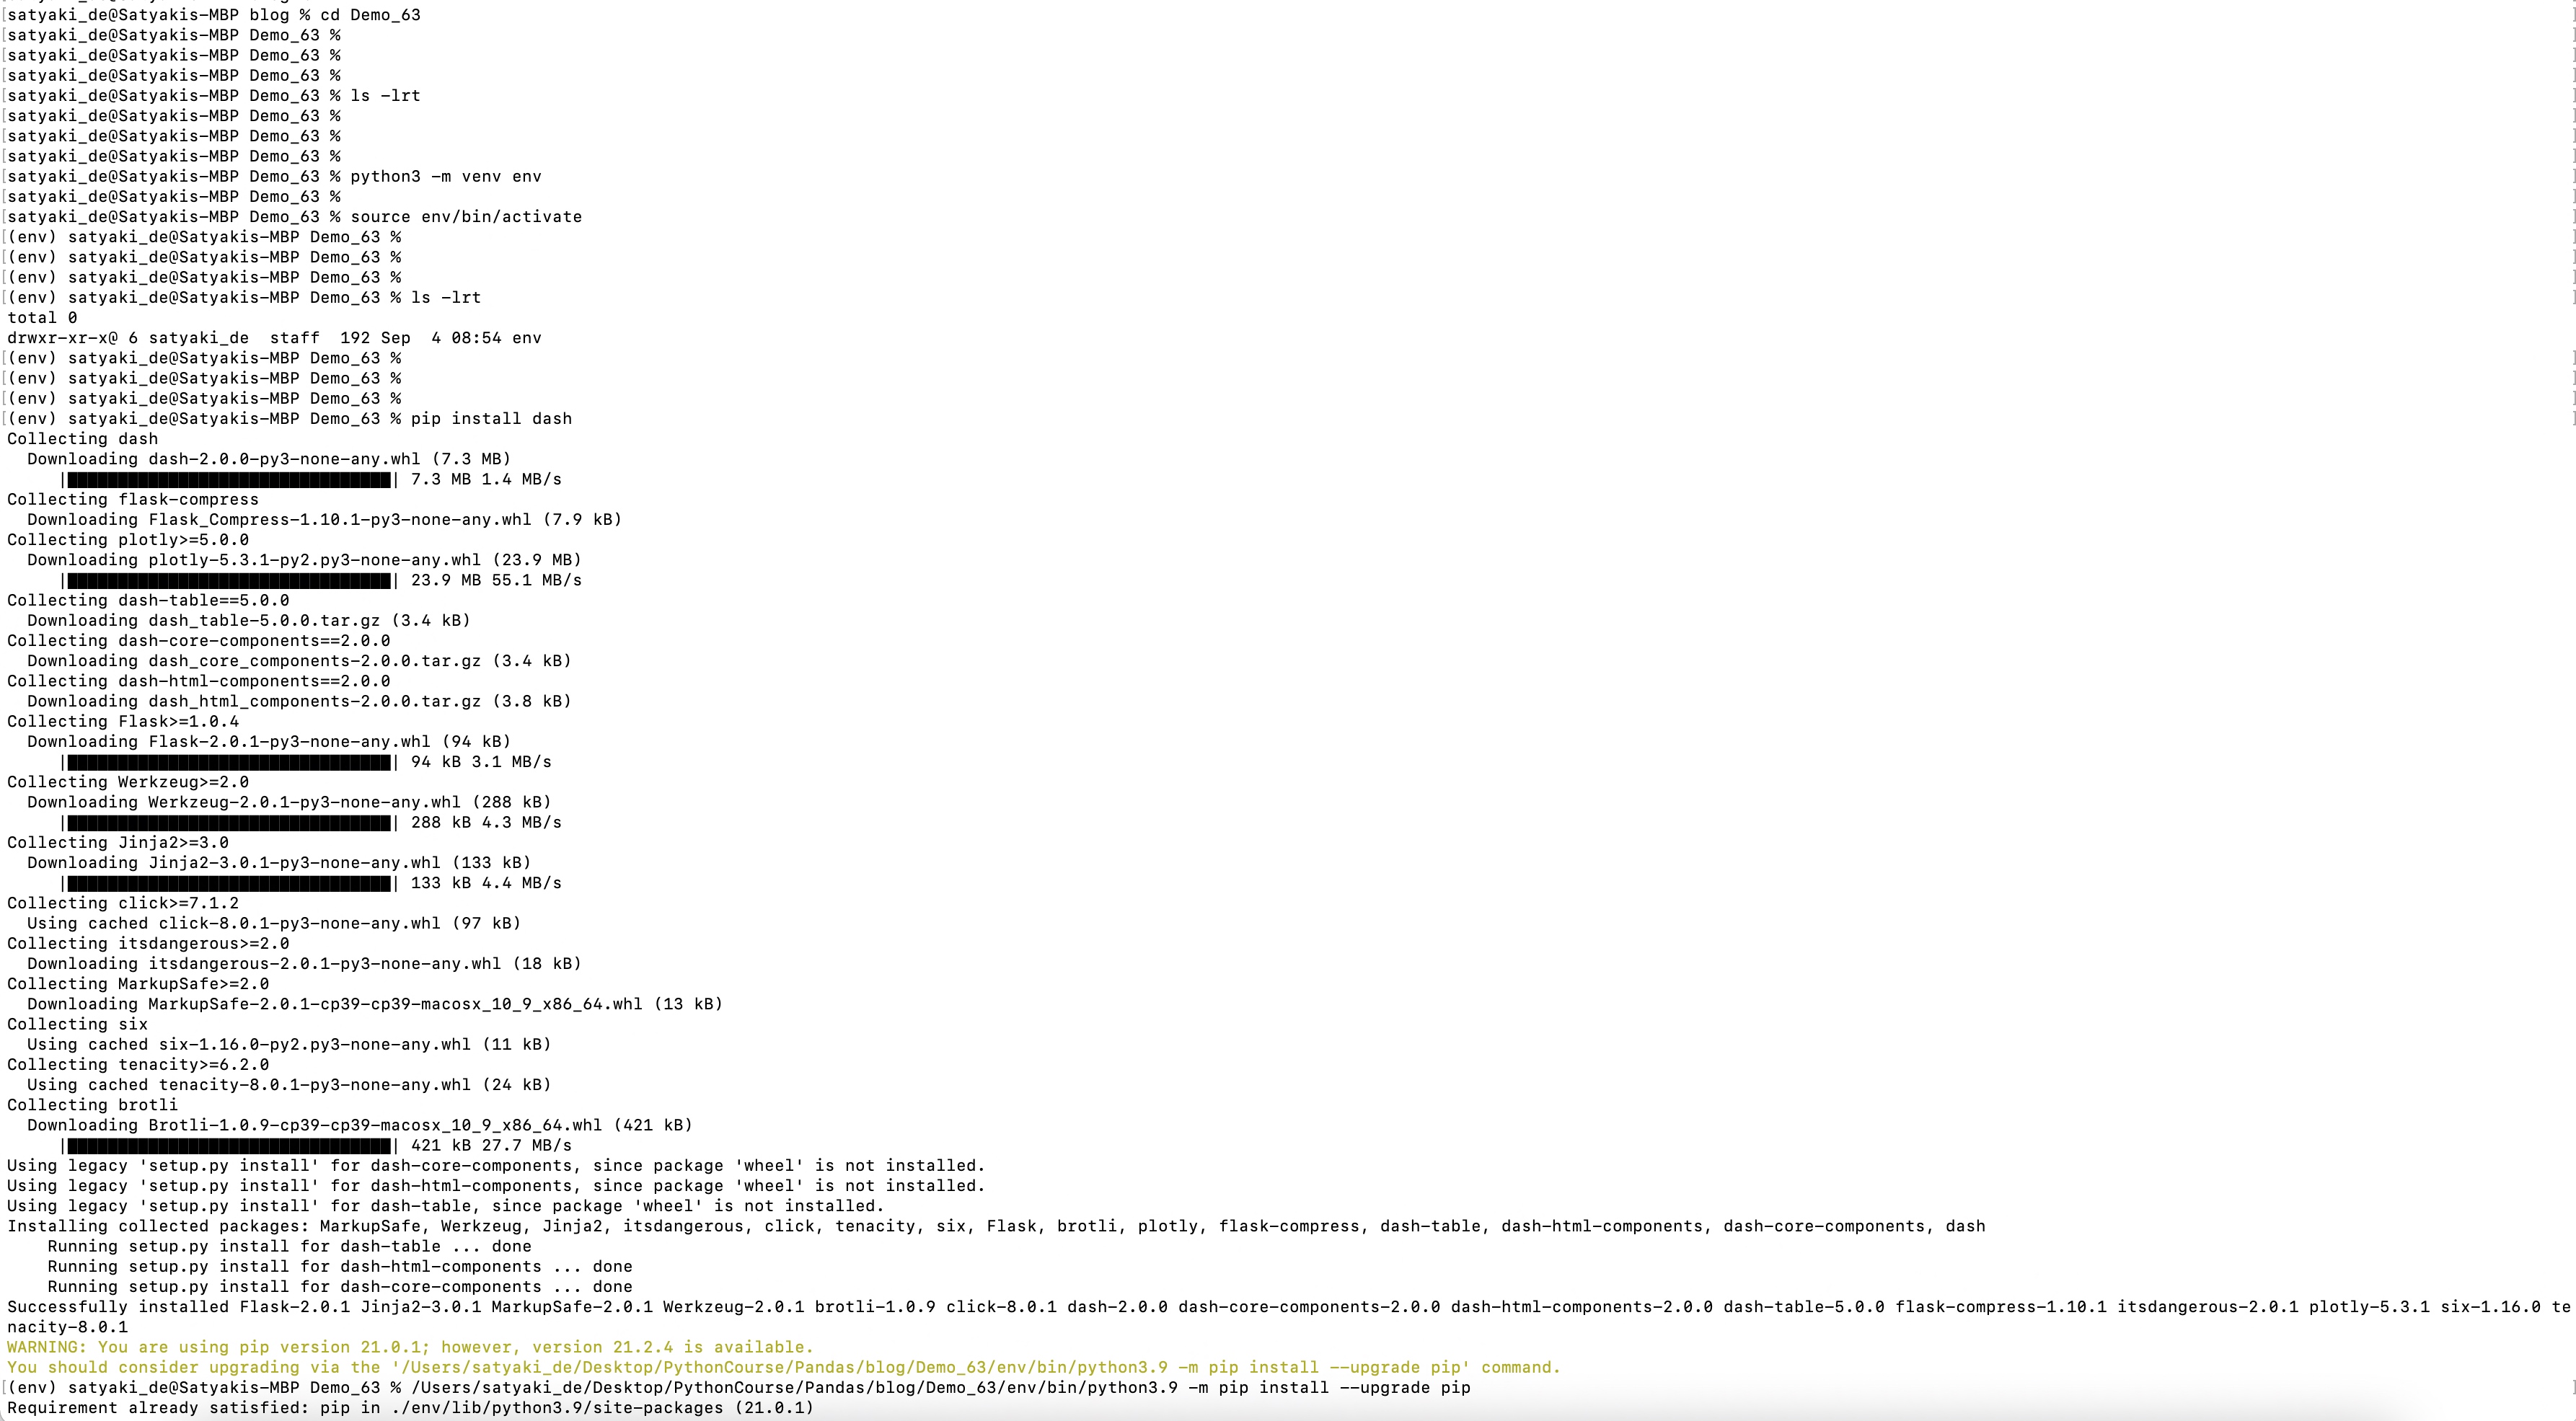
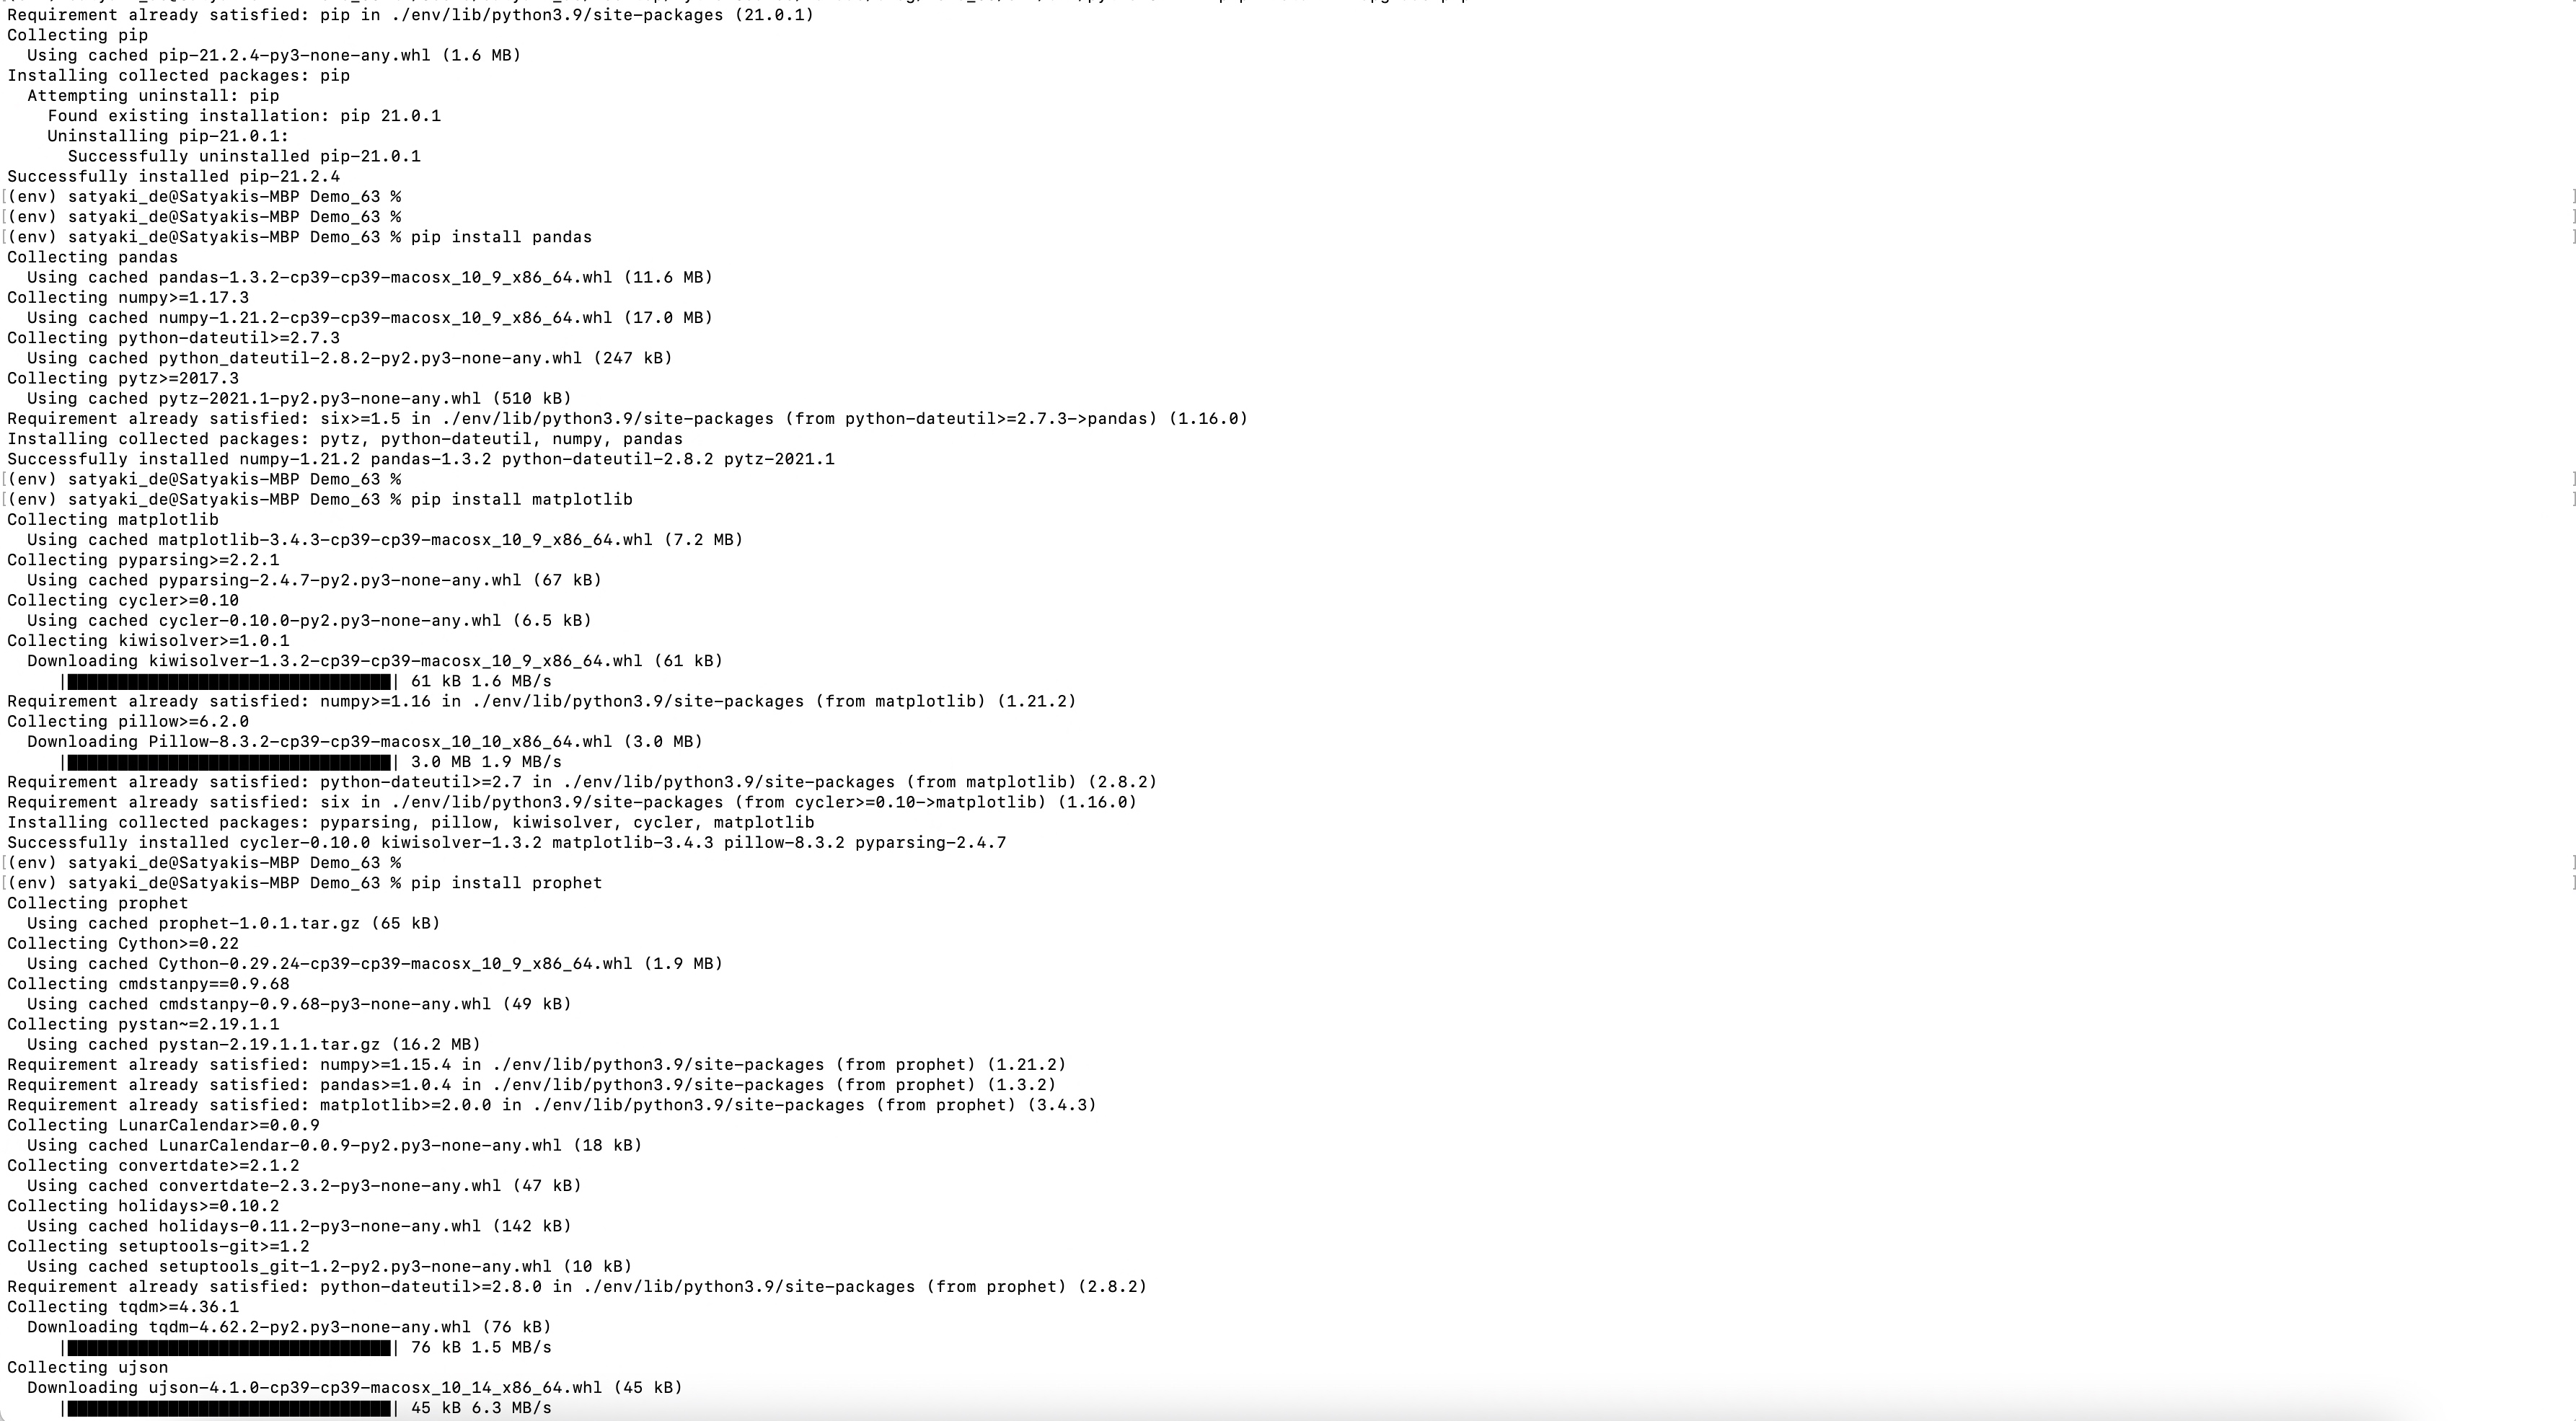
And, here is the command to install those packages –
pip install pandas
pip install plotly
pip install prophet
pip install dash
pip install pandas
pip install ably
Code:
Since this is an extension to our previous post, we’re not going to discuss other scripts, which we’ve already discussed over there. Instead, we will talk about the enhanced scripts & the new scripts that require for this use case.
1. clsConfig.py ( This native Python script contains the configuration entries. )
This file contains hidden or bidirectional Unicode text that may be interpreted or compiled differently than what appears below. To review, open the file in an editor that reveals hidden Unicode characters.
Learn more about bidirectional Unicode characters
| ################################################ | |
| #### Written By: SATYAKI DE #### | |
| #### Written On: 15-May-2020 #### | |
| #### Modified On: 09-Sep-2021 #### | |
| #### #### | |
| #### Objective: This script is a config #### | |
| #### file, contains all the keys for #### | |
| #### Machine-Learning & streaming dashboard.#### | |
| #### #### | |
| ################################################ | |
| import os | |
| import platform as pl | |
| class clsConfig(object): | |
| Curr_Path = os.path.dirname(os.path.realpath(__file__)) | |
| os_det = pl.system() | |
| if os_det == "Windows": | |
| sep = '\\' | |
| else: | |
| sep = '/' | |
| conf = { | |
| 'APP_ID': 1, | |
| 'ARCH_DIR': Curr_Path + sep + 'arch' + sep, | |
| 'PROFILE_PATH': Curr_Path + sep + 'profile' + sep, | |
| 'LOG_PATH': Curr_Path + sep + 'log' + sep, | |
| 'REPORT_PATH': Curr_Path + sep + 'report', | |
| 'FILE_NAME': Curr_Path + sep + 'data' + sep + 'TradeIn.csv', | |
| 'SRC_PATH': Curr_Path + sep + 'data' + sep, | |
| 'APP_DESC_1': 'Dash Integration with Ably!', | |
| 'DEBUG_IND': 'N', | |
| 'INIT_PATH': Curr_Path, | |
| 'SUBDIR' : 'data', | |
| 'ABLY_ID': 'XXX2LL.93kdkiU2:Kdsldoeie737484E', | |
| "URL":"https://corona-api.com/countries/", | |
| "appType":"application/json", | |
| "conType":"keep-alive", | |
| "limRec": 10, | |
| "CACHE":"no-cache", | |
| "MAX_RETRY": 3, | |
| "coList": "DE, IN, US, CA, GB, ID, BR", | |
| "FNC": "NewConfirmed", | |
| "TMS": "ReportedDate", | |
| "FND": "NewDeaths", | |
| "FinData": "Cache.csv" | |
| } |
A few of the new entries, which are essential to this task are -> ABLY_ID & FinData.
2. clsPublishStream.py ( This script will publish the data transformed for Covid-19 predictions from the third-party sources. )
This file contains hidden or bidirectional Unicode text that may be interpreted or compiled differently than what appears below. To review, open the file in an editor that reveals hidden Unicode characters.
Learn more about bidirectional Unicode characters
| ############################################################### | |
| #### #### | |
| #### Written By: Satyaki De #### | |
| #### Written Date: 26-Jul-2021 #### | |
| #### Modified Date: 08-Sep-2021 #### | |
| #### #### | |
| #### Objective: This script will publish real-time #### | |
| #### streaming data coming out from a hosted API #### | |
| #### sources using another popular third-party service #### | |
| #### named Ably. Ably mimics pubsub Streaming concept, #### | |
| #### which might be extremely useful for any start-ups. #### | |
| #### #### | |
| ############################################################### | |
| from ably import AblyRest | |
| import logging | |
| import json | |
| from random import seed | |
| from random import random | |
| import json | |
| import math | |
| import random | |
| from clsConfig import clsConfig as cf | |
| # Global Section | |
| logger = logging.getLogger('ably') | |
| logger.addHandler(logging.StreamHandler()) | |
| ably_id = str(cf.conf['ABLY_ID']) | |
| ably = AblyRest(ably_id) | |
| channel = ably.channels.get('sd_channel') | |
| # End Of Global Section | |
| class clsPublishStream: | |
| def __init__(self): | |
| self.fnc = cf.conf['FNC'] | |
| def pushEvents(self, srcDF, debugInd, varVa, flg): | |
| try: | |
| # JSON data | |
| # This is the default data for all the identified category | |
| # we've prepared. You can extract this dynamically. Or, By | |
| # default you can set their base trade details. | |
| json_data = [{'Year_Mon': '201911', 'Brazil': 0.0, 'Canada': 0.0, 'Germany': 0.0, 'India': 0.0, 'Indonesia': 0.0, 'UnitedKingdom': 0.0, 'UnitedStates': 0.0, 'Status': flg}, | |
| {'Year_Mon': '201912', 'Brazil': 0.0, 'Canada': 0.0, 'Germany': 0.0, 'India': 0.0, 'Indonesia': 0.0, 'UnitedKingdom': 0.0, 'UnitedStates': 0.0, 'Status': flg}] | |
| jdata = json.dumps(json_data) | |
| # Publish a message to the sd_channel channel | |
| channel.publish('event', jdata) | |
| # Capturing the inbound dataframe | |
| iDF = srcDF | |
| # Adding new selected points | |
| covid_dict = iDF.to_dict('records') | |
| jdata_fin = json.dumps(covid_dict) | |
| # Publish rest of the messages to the sd_channel channel | |
| channel.publish('event', jdata_fin) | |
| jdata_fin = '' | |
| return 0 | |
| except Exception as e: | |
| x = str(e) | |
| print(x) | |
| logging.info(x) | |
| return 1 |
We’ve already discussed this script. The only new line that appears here is –
json_data = [{'Year_Mon': '201911', 'Brazil': 0.0, 'Canada': 0.0, 'Germany': 0.0, 'India': 0.0, 'Indonesia': 0.0, 'UnitedKingdom': 0.0, 'UnitedStates': 0.0, 'Status': flg},
            {'Year_Mon': '201912', 'Brazil': 0.0, 'Canada': 0.0, 'Germany': 0.0, 'India': 0.0, 'Indonesia': 0.0, 'UnitedKingdom': 0.0, 'UnitedStates': 0.0, 'Status': flg}]
This statement is more like a dummy feed, which creates the basic structure of your graph.
3. clsStreamConsume.py ( This script will consume the stream from Ably Queue configuration entries. )
This file contains hidden or bidirectional Unicode text that may be interpreted or compiled differently than what appears below. To review, open the file in an editor that reveals hidden Unicode characters.
Learn more about bidirectional Unicode characters
| ############################################## | |
| #### Written By: SATYAKI DE #### | |
| #### Written On: 26-Jul-2021 #### | |
| #### Modified On 08-Sep-2021 #### | |
| #### #### | |
| #### Objective: Consuming Streaming data #### | |
| #### from Ably channels published by the #### | |
| #### callPredictCovidAnalysisRealtime.py #### | |
| #### #### | |
| ############################################## | |
| import json | |
| from clsConfig import clsConfig as cf | |
| import requests | |
| import logging | |
| import time | |
| import pandas as p | |
| import clsL as cl | |
| from ably import AblyRest | |
| # Initiating Log class | |
| l = cl.clsL() | |
| class clsStreamConsume: | |
| def __init__(self): | |
| self.ably_id = str(cf.conf['ABLY_ID']) | |
| self.fileName = str(cf.conf['FinData']) | |
| def conStream(self, varVa, debugInd): | |
| try: | |
| ably_id = self.ably_id | |
| fileName = self.fileName | |
| var = varVa | |
| debug_ind = debugInd | |
| # Fetching the data | |
| client = AblyRest(ably_id) | |
| channel = client.channels.get('sd_channel') | |
| message_page = channel.history() | |
| # Counter Value | |
| cnt = 0 | |
| # Declaring Global Data-Frame | |
| df_conv = p.DataFrame() | |
| for i in message_page.items: | |
| print('Last Msg: {}'.format(i.data)) | |
| json_data = json.loads(i.data) | |
| # Converting JSON to Dataframe | |
| df = p.json_normalize(json_data) | |
| df.columns = df.columns.map(lambda x: x.split(".")[-1]) | |
| if cnt == 0: | |
| df_conv = df | |
| else: | |
| d_frames = [df_conv, df] | |
| df_conv = p.concat(d_frames) | |
| cnt += 1 | |
| # Resetting the Index Value | |
| df_conv.reset_index(drop=True, inplace=True) | |
| # This will check whether the current load is happening | |
| # or not. Based on that, it will capture the old events | |
| # from cache. | |
| if df_conv.empty: | |
| df_conv = p.read_csv(fileName, index = True) | |
| else: | |
| l.logr(fileName, debug_ind, df_conv, 'log') | |
| return df_conv | |
| except Exception as e: | |
| x = str(e) | |
| print(x) | |
| logging.info(x) | |
| # This will handle the error scenaio as well. | |
| # Based on that, it will capture the old events | |
| # from cache. | |
| try: | |
| df_conv = p.read_csv(fileName, index = True) | |
| except: | |
| df = p.DataFrame() | |
| return df |
We’ve already discussed this script in one of my earlier posts, which you will get here.
So, I’m not going to discuss all the steps in detail.
The only added part was to introduce some temporary local caching mechanism.
if df_conv.empty:
    df_conv = p.read_csv(fileName, index = True)
else:
    l.logr(fileName, debug_ind, df_conv, 'log')
4. callPredictCovidAnalysisRealtime.py ( Main calling script to fetch the COVID-19 data from the third-party source & then publish it to the Ably message queue after transforming the data & adding the prediction using Facebook’s prophet API. )
This file contains hidden or bidirectional Unicode text that may be interpreted or compiled differently than what appears below. To review, open the file in an editor that reveals hidden Unicode characters.
Learn more about bidirectional Unicode characters
| ############################################## | |
| #### Written By: SATYAKI DE #### | |
| #### Written On: 26-Jul-2021 #### | |
| #### Modified On 26-Jul-2021 #### | |
| #### #### | |
| #### Objective: Calling multiple API's #### | |
| #### that including Prophet-API developed #### | |
| #### by Facebook for future prediction of #### | |
| #### Covid-19 situations in upcoming days #### | |
| #### for world's major hotspots. #### | |
| ############################################## | |
| import json | |
| import clsCovidAPI as ca | |
| from clsConfig import clsConfig as cf | |
| import datetime | |
| import logging | |
| import clsL as cl | |
| import math as m | |
| import clsPublishStream as cps | |
| import clsForecast as f | |
| from prophet import Prophet | |
| from prophet.plot import plot_plotly, plot_components_plotly | |
| import matplotlib.pyplot as plt | |
| import pandas as p | |
| import datetime as dt | |
| import time | |
| # Disbling Warning | |
| def warn(*args, **kwargs): | |
| pass | |
| import warnings | |
| warnings.warn = warn | |
| # Initiating Log class | |
| l = cl.clsL() | |
| # Helper Function that removes underscores | |
| def countryDet(inputCD): | |
| try: | |
| countryCD = inputCD | |
| if str(countryCD) == 'DE': | |
| cntCD = 'Germany' | |
| elif str(countryCD) == 'BR': | |
| cntCD = 'Brazil' | |
| elif str(countryCD) == 'GB': | |
| cntCD = 'UnitedKingdom' | |
| elif str(countryCD) == 'US': | |
| cntCD = 'UnitedStates' | |
| elif str(countryCD) == 'IN': | |
| cntCD = 'India' | |
| elif str(countryCD) == 'CA': | |
| cntCD = 'Canada' | |
| elif str(countryCD) == 'ID': | |
| cntCD = 'Indonesia' | |
| else: | |
| cntCD = 'N/A' | |
| return cntCD | |
| except: | |
| cntCD = 'N/A' | |
| return cntCD | |
| def lookupCountry(row): | |
| try: | |
| strCD = str(row['CountryCode']) | |
| retVal = countryDet(strCD) | |
| return retVal | |
| except: | |
| retVal = 'N/A' | |
| return retVal | |
| def adjustTrend(row): | |
| try: | |
| flTrend = float(row['trend']) | |
| flTrendUpr = float(row['trend_upper']) | |
| flTrendLwr = float(row['trend_lower']) | |
| retVal = m.trunc((flTrend + flTrendUpr + flTrendLwr)/3) | |
| if retVal < 0: | |
| retVal = 0 | |
| return retVal | |
| except: | |
| retVal = 0 | |
| return retVal | |
| def ceilTrend(row, colName): | |
| try: | |
| flTrend = str(row[colName]) | |
| if flTrend.find('.'): | |
| if float(flTrend) > 0: | |
| retVal = m.trunc(float(flTrend)) + 1 | |
| else: | |
| retVal = m.trunc(float(flTrend)) | |
| else: | |
| retVal = float(flTrend) | |
| if retVal < 0: | |
| retVal = 0 | |
| return retVal | |
| except: | |
| retVal = 0 | |
| return retVal | |
| def plot_picture(inputDF, debug_ind, var, countryCD, stat): | |
| try: | |
| iDF = inputDF | |
| # Lowercase the column names | |
| iDF.columns = [c.lower() for c in iDF.columns] | |
| # Determine which is Y axis | |
| y_col = [c for c in iDF.columns if c.startswith('y')][0] | |
| # Determine which is X axis | |
| x_col = [c for c in iDF.columns if c.startswith('ds')][0] | |
| # Data Conversion | |
| iDF['y'] = iDF[y_col].astype('float') | |
| iDF['ds'] = iDF[x_col].astype('datetime64[ns]') | |
| # Forecast calculations | |
| # Decreasing the changepoint_prior_scale to 0.001 to make the trend less flexible | |
| m = Prophet(n_changepoints=20, yearly_seasonality=True, changepoint_prior_scale=0.001) | |
| #m = Prophet(n_changepoints=20, yearly_seasonality=True, changepoint_prior_scale=0.04525) | |
| #m = Prophet(n_changepoints=['2021-09-10']) | |
| m.fit(iDF) | |
| forecastDF = m.make_future_dataframe(periods=365) | |
| forecastDF = m.predict(forecastDF) | |
| l.logr('15.forecastDF_' + var + '_' + countryCD + '.csv', debug_ind, forecastDF, 'log') | |
| df_M = forecastDF[['ds', 'trend', 'trend_lower', 'trend_upper']] | |
| l.logr('16.df_M_' + var + '_' + countryCD + '.csv', debug_ind, df_M, 'log') | |
| # Getting Full Country Name | |
| cntCD = countryDet(countryCD) | |
| # Draw forecast results | |
| df_M['Country'] = cntCD | |
| l.logr('17.df_M_C_' + var + '_' + countryCD + '.csv', debug_ind, df_M, 'log') | |
| df_M['AdjustTrend'] = df_M.apply(lambda row: adjustTrend(row), axis=1) | |
| l.logr('20.df_M_AdjustTrend_' + var + '_' + countryCD + '.csv', debug_ind, df_M, 'log') | |
| return df_M | |
| except Exception as e: | |
| x = str(e) | |
| print(x) | |
| df = p.DataFrame() | |
| return df | |
| def countrySpecificDF(counryDF, val): | |
| try: | |
| countryName = val | |
| df = counryDF | |
| df_lkpFile = df[(df['CountryCode'] == val)] | |
| return df_lkpFile | |
| except: | |
| df = p.DataFrame() | |
| return df | |
| def toNum(row, colName): | |
| try: | |
| flTrend = str(row[colName]) | |
| flTr, subpart = flTrend.split(' ') | |
| retVal = int(flTr.replace('-','')) | |
| return retVal | |
| except: | |
| retVal = 0 | |
| return retVal | |
| def extractPredictedDF(OrigDF, MergePredictedDF, colName): | |
| try: | |
| iDF_1 = OrigDF | |
| iDF_2 = MergePredictedDF | |
| dt_format = '%Y-%m-%d' | |
| iDF_1_max_group = iDF_1.groupby(["Country"] , as_index=False)["ReportedDate"].max() | |
| iDF_2['ReportedDate'] = iDF_2.apply(lambda row: toNum(row, 'ds'), axis=1) | |
| col_one_list = iDF_1_max_group['Country'].tolist() | |
| col_two_list = iDF_1_max_group['ReportedDate'].tolist() | |
| print('col_one_list: ', str(col_one_list)) | |
| print('col_two_list: ', str(col_two_list)) | |
| cnt_1_x = 1 | |
| cnt_1_y = 1 | |
| cnt_x = 0 | |
| df_M = p.DataFrame() | |
| for i in col_one_list: | |
| str_countryVal = str(i) | |
| cnt_1_y = 1 | |
| for j in col_two_list: | |
| intReportDate = int(str(j).strip().replace('-','')) | |
| if cnt_1_x == cnt_1_y: | |
| print('str_countryVal: ', str(str_countryVal)) | |
| print('intReportDate: ', str(intReportDate)) | |
| iDF_2_M = iDF_2[(iDF_2['Country'] == str_countryVal) & (iDF_2['ReportedDate'] > intReportDate)] | |
| # Merging with the previous Country Code data | |
| if cnt_x == 0: | |
| df_M = iDF_2_M | |
| else: | |
| d_frames = [df_M, iDF_2_M] | |
| df_M = p.concat(d_frames) | |
| cnt_x += 1 | |
| cnt_1_y += 1 | |
| cnt_1_x += 1 | |
| df_M.drop(columns=['ReportedDate'], axis=1, inplace=True) | |
| df_M.rename(columns={'ds':'ReportedDate'}, inplace=True) | |
| df_M.rename(columns={'AdjustTrend':colName}, inplace=True) | |
| return df_M | |
| except: | |
| df = p.DataFrame() | |
| return df | |
| def toPivot(inDF, colName): | |
| try: | |
| iDF = inDF | |
| iDF_Piv = iDF.pivot_table(colName, ['ReportedDate'], 'Country') | |
| iDF_Piv.reset_index( drop=False, inplace=True ) | |
| list1 = ['ReportedDate'] | |
| iDF_Arr = iDF['Country'].unique() | |
| list2 = iDF_Arr.tolist() | |
| listV = list1 + list2 | |
| iDF_Piv.reindex([listV], axis=1) | |
| return iDF_Piv | |
| except Exception as e: | |
| x = str(e) | |
| print(x) | |
| df = p.DataFrame() | |
| return df | |
| def toAgg(inDF, var, debugInd, flg): | |
| try: | |
| iDF = inDF | |
| colName = "ReportedDate" | |
| list1 = list(iDF.columns.values) | |
| list1.remove(colName) | |
| list1 = ["Brazil", "Canada", "Germany", "India", "Indonesia", "UnitedKingdom", "UnitedStates"] | |
| iDF['Year_Mon'] = iDF[colName].apply(lambda x:x.strftime('%Y%m')) | |
| iDF.drop(columns=[colName], axis=1, inplace=True) | |
| ColNameGrp = "Year_Mon" | |
| print('List1 Aggregate:: ', str(list1)) | |
| print('ColNameGrp :: ', str(ColNameGrp)) | |
| iDF_T = iDF[["Year_Mon", "Brazil", "Canada", "Germany", "India", "Indonesia", "UnitedKingdom", "UnitedStates"]] | |
| iDF_T.fillna(0, inplace = True) | |
| print('iDF_T:: ') | |
| print(iDF_T) | |
| iDF_1_max_group = iDF_T.groupby(ColNameGrp, as_index=False)[list1].sum() | |
| iDF_1_max_group['Status'] = flg | |
| return iDF_1_max_group | |
| except Exception as e: | |
| x = str(e) | |
| print(x) | |
| df = p.DataFrame() | |
| return df | |
| def publishEvents(inDF1, inDF2, inDF3, inDF4, var, debugInd): | |
| try: | |
| # Original Covid Data from API | |
| iDF1 = inDF1 | |
| iDF2 = inDF2 | |
| NC = 'NewConfirmed' | |
| ND = 'NewDeaths' | |
| iDF1_PV = toPivot(iDF1, NC) | |
| iDF1_PV['ReportedDate'] = p.to_datetime(iDF1_PV['ReportedDate']) | |
| l.logr('57.iDF1_PV_' + var + '.csv', debugInd, iDF1_PV, 'log') | |
| iDF2_PV = toPivot(iDF2, ND) | |
| iDF2_PV['ReportedDate'] = p.to_datetime(iDF2_PV['ReportedDate']) | |
| l.logr('58.iDF2_PV_' + var + '.csv', debugInd, iDF2_PV, 'log') | |
| # Predicted Covid Data from Facebook API | |
| iDF3 = inDF3 | |
| iDF4 = inDF4 | |
| iDF3_PV = toPivot(iDF3, NC) | |
| l.logr('59.iDF3_PV_' + var + '.csv', debugInd, iDF3_PV, 'log') | |
| iDF4_PV = toPivot(iDF4, ND) | |
| l.logr('60.iDF4_PV_' + var + '.csv', debugInd, iDF4_PV, 'log') | |
| # Now aggregating data based on year-month only | |
| iDF1_Agg = toAgg(iDF1_PV, var, debugInd, NC) | |
| l.logr('61.iDF1_Agg_' + var + '.csv', debugInd, iDF1_Agg, 'log') | |
| iDF2_Agg = toAgg(iDF2_PV, var, debugInd, ND) | |
| l.logr('62.iDF2_Agg_' + var + '.csv', debugInd, iDF2_Agg, 'log') | |
| iDF3_Agg = toAgg(iDF3_PV, var, debugInd, NC) | |
| l.logr('63.iDF3_Agg_' + var + '.csv', debugInd, iDF3_Agg, 'log') | |
| iDF4_Agg = toAgg(iDF4_PV, var, debugInd, ND) | |
| l.logr('64.iDF4_Agg_' + var + '.csv', debugInd, iDF4_Agg, 'log') | |
| # Initiating Ably class to push events | |
| x1 = cps.clsPublishStream() | |
| # Pushing both the Historical Confirmed Cases | |
| retVal_1 = x1.pushEvents(iDF1_Agg, debugInd, var, NC) | |
| if retVal_1 == 0: | |
| print('Successfully historical event pushed!') | |
| else: | |
| print('Failed to push historical events!') | |
| # Pushing both the Historical Death Cases | |
| retVal_3 = x1.pushEvents(iDF2_Agg, debugInd, var, ND) | |
| if retVal_3 == 0: | |
| print('Successfully historical event pushed!') | |
| else: | |
| print('Failed to push historical events!') | |
| time.sleep(5) | |
| # Pushing both the New Confirmed Cases | |
| retVal_2 = x1.pushEvents(iDF3_Agg, debugInd, var, NC) | |
| if retVal_2 == 0: | |
| print('Successfully predicted event pushed!') | |
| else: | |
| print('Failed to push predicted events!') | |
| # Pushing both the New Death Cases | |
| retVal_4 = x1.pushEvents(iDF4_Agg, debugInd, var, ND) | |
| if retVal_4 == 0: | |
| print('Successfully predicted event pushed!') | |
| else: | |
| print('Failed to push predicted events!') | |
| return 0 | |
| except Exception as e: | |
| x = str(e) | |
| print(x) | |
| return 1 | |
| def main(): | |
| try: | |
| var1 = datetime.datetime.now().strftime("%Y-%m-%d_%H-%M-%S") | |
| print('*' *60) | |
| DInd = 'Y' | |
| NC = 'New Confirmed' | |
| ND = 'New Dead' | |
| SM = 'data process Successful!' | |
| FM = 'data process Failure!' | |
| print("Calling the custom Package for large file splitting..") | |
| print('Start Time: ' + str(var1)) | |
| countryList = str(cf.conf['coList']).split(',') | |
| # Initiating Log Class | |
| general_log_path = str(cf.conf['LOG_PATH']) | |
| # Enabling Logging Info | |
| logging.basicConfig(filename=general_log_path + 'CovidAPI.log', level=logging.INFO) | |
| # Create the instance of the Covid API Class | |
| x1 = ca.clsCovidAPI() | |
| # Let's pass this to our map section | |
| retDF = x1.searchQry(var1, DInd) | |
| retVal = int(retDF.shape[0]) | |
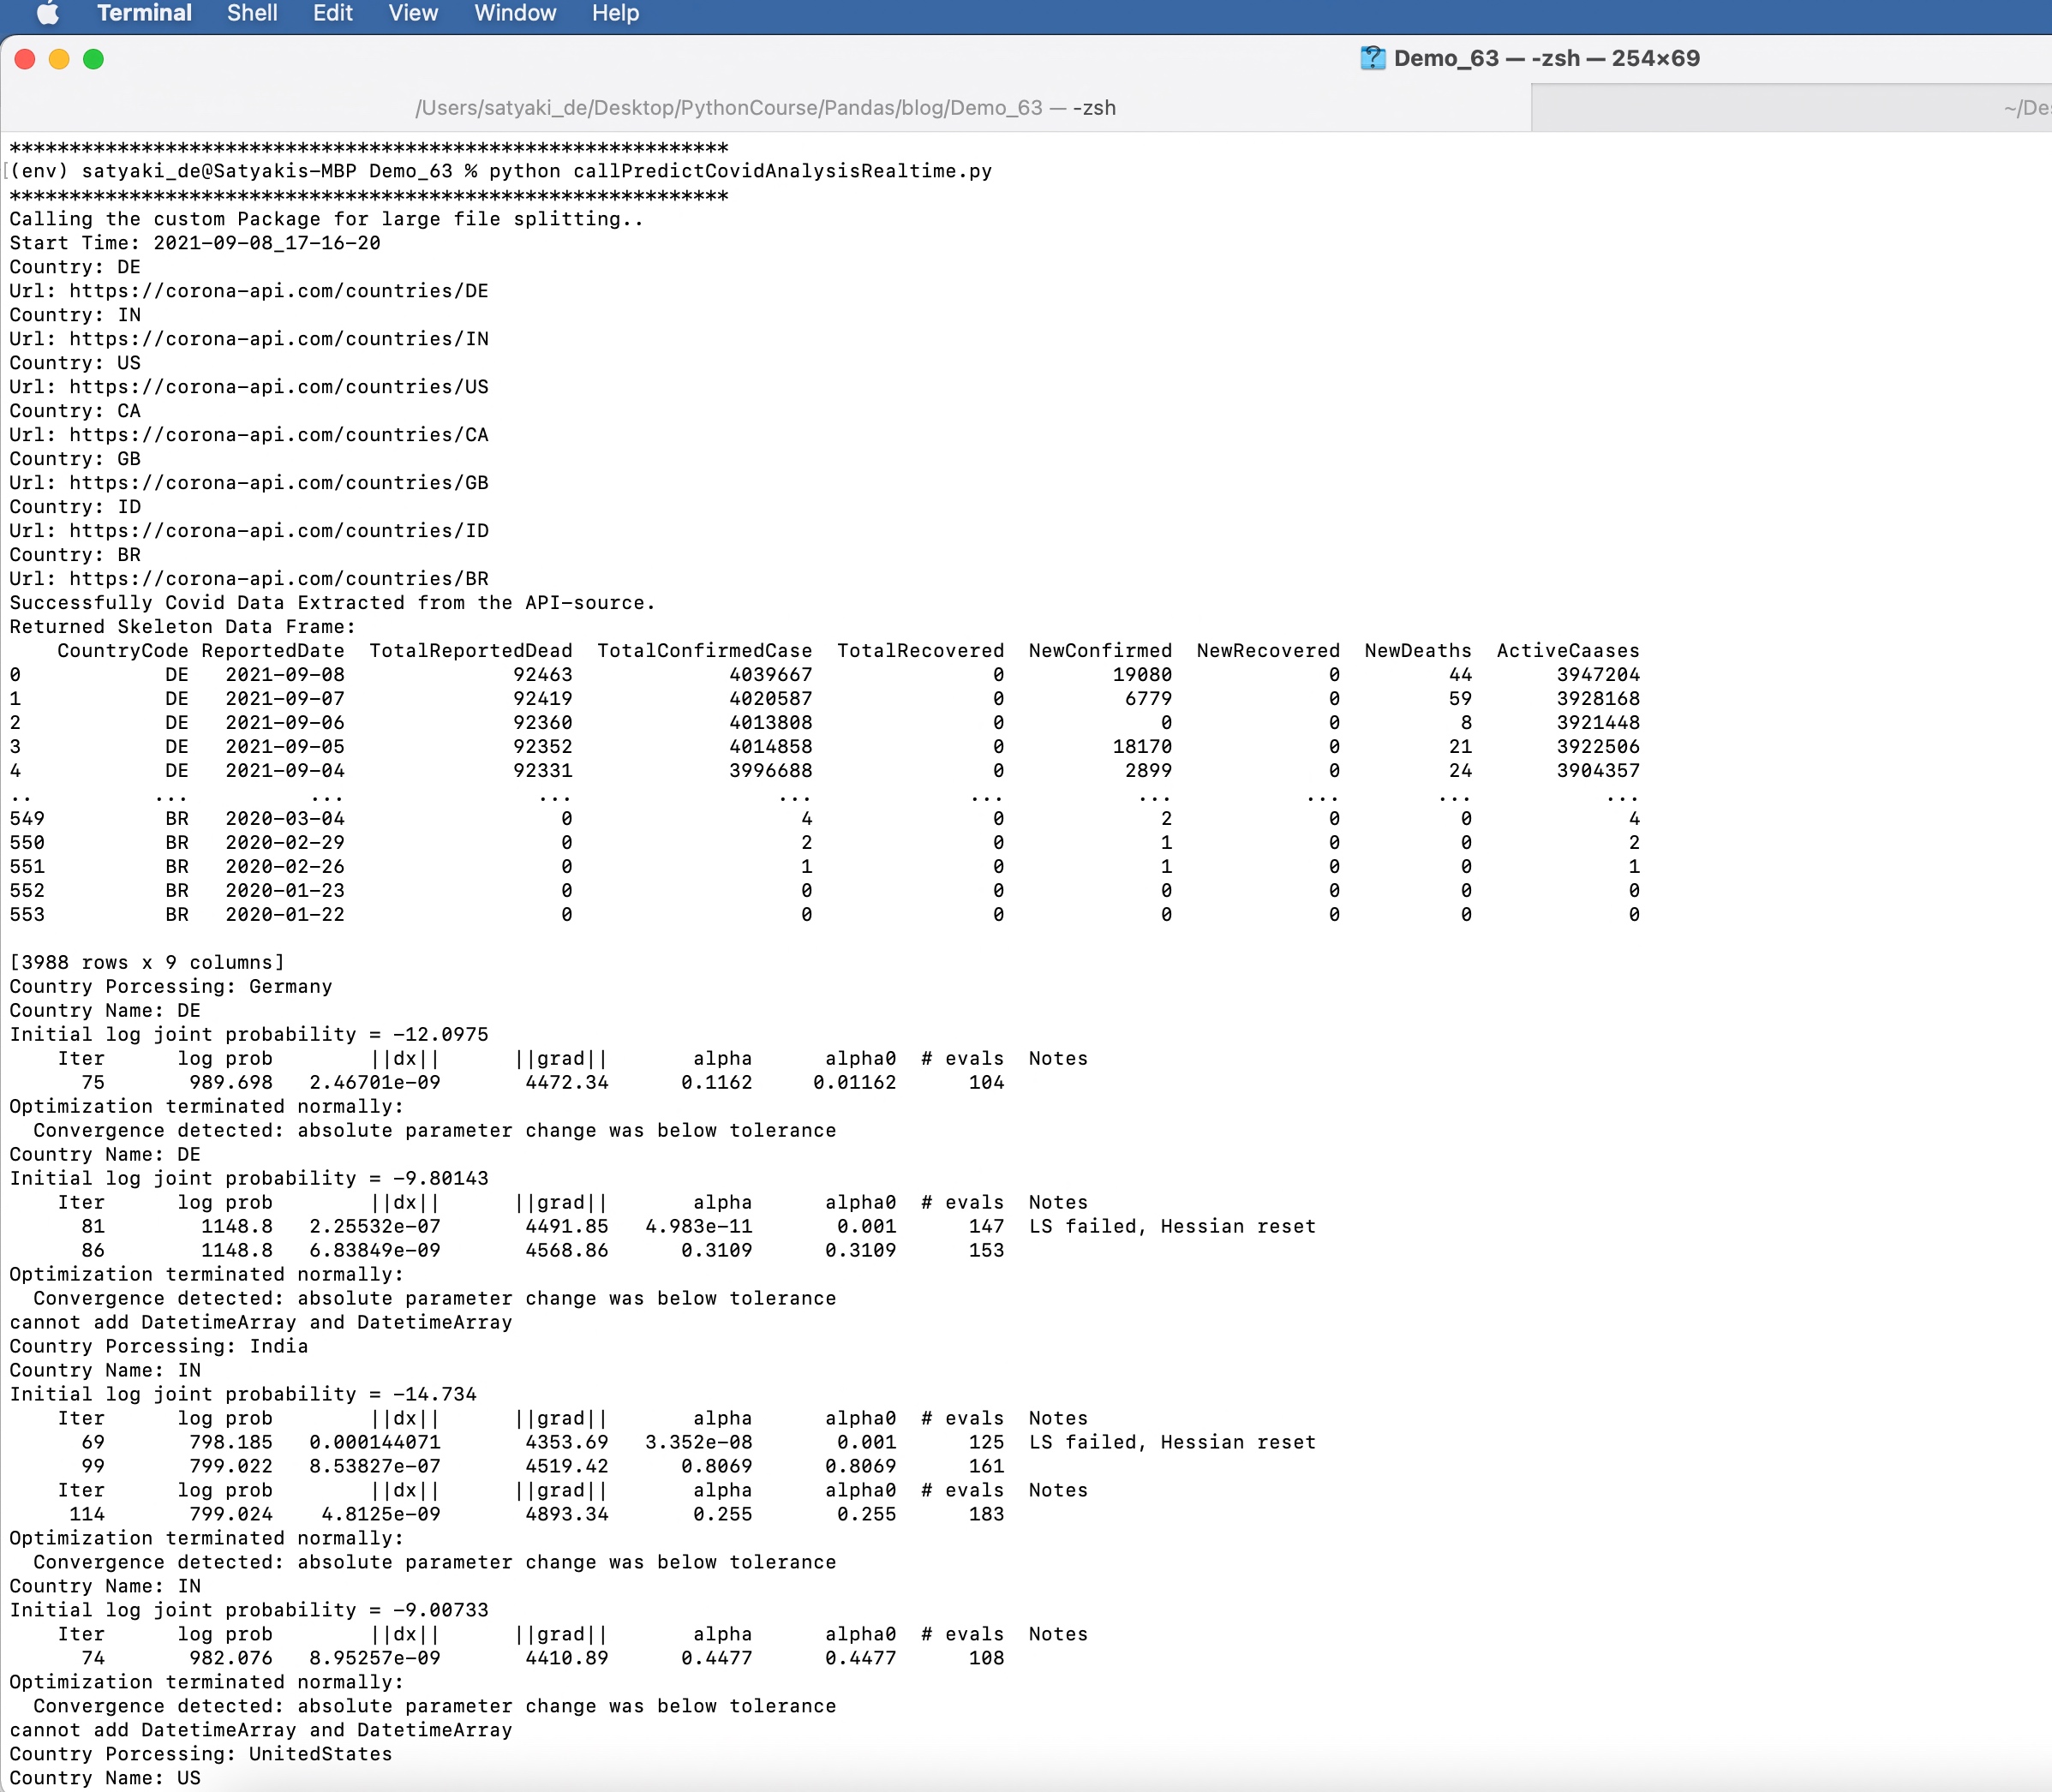
| if retVal > 0: | |
| print('Successfully Covid Data Extracted from the API-source.') | |
| else: | |
| print('Something wrong with your API-source!') | |
| # Extracting Skeleton Data | |
| df = retDF[['data.code', 'date', 'deaths', 'confirmed', 'recovered', 'new_confirmed', 'new_recovered', 'new_deaths', 'active']] | |
| df.columns = ['CountryCode', 'ReportedDate', 'TotalReportedDead', 'TotalConfirmedCase', 'TotalRecovered', 'NewConfirmed', 'NewRecovered', 'NewDeaths', 'ActiveCaases'] | |
| df.dropna() | |
| print('Returned Skeleton Data Frame: ') | |
| print(df) | |
| l.logr('5.df_' + var1 + '.csv', DInd, df, 'log') | |
| # Due to source data issue, application will perform of | |
| # avg of counts based on dates due to multiple entries | |
| g_df = df.groupby(["CountryCode", "ReportedDate"] , as_index=False)["TotalReportedDead","TotalConfirmedCase","TotalRecovered","NewConfirmed","NewRecovered","NewDeaths","ActiveCaases"].mean() | |
| g_df['TotalReportedDead_M'] = g_df.apply(lambda row: ceilTrend(row, 'TotalReportedDead'), axis=1) | |
| g_df['TotalConfirmedCase_M'] = g_df.apply(lambda row: ceilTrend(row, 'TotalConfirmedCase'), axis=1) | |
| g_df['TotalRecovered_M'] = g_df.apply(lambda row: ceilTrend(row, 'TotalRecovered'), axis=1) | |
| g_df['NewConfirmed_M'] = g_df.apply(lambda row: ceilTrend(row, 'NewConfirmed'), axis=1) | |
| g_df['NewRecovered_M'] = g_df.apply(lambda row: ceilTrend(row, 'NewRecovered'), axis=1) | |
| g_df['NewDeaths_M'] = g_df.apply(lambda row: ceilTrend(row, 'NewDeaths'), axis=1) | |
| g_df['ActiveCaases_M'] = g_df.apply(lambda row: ceilTrend(row, 'ActiveCaases'), axis=1) | |
| # Dropping old columns | |
| g_df.drop(columns=['TotalReportedDead', 'TotalConfirmedCase', 'TotalRecovered', 'NewConfirmed', 'NewRecovered', 'NewDeaths', 'ActiveCaases'], axis=1, inplace=True) | |
| # Renaming the new columns to old columns | |
| g_df.rename(columns={'TotalReportedDead_M':'TotalReportedDead'}, inplace=True) | |
| g_df.rename(columns={'TotalConfirmedCase_M':'TotalConfirmedCase'}, inplace=True) | |
| g_df.rename(columns={'TotalRecovered_M':'TotalRecovered'}, inplace=True) | |
| g_df.rename(columns={'NewConfirmed_M':'NewConfirmed'}, inplace=True) | |
| g_df.rename(columns={'NewRecovered_M':'NewRecovered'}, inplace=True) | |
| g_df.rename(columns={'NewDeaths_M':'NewDeaths'}, inplace=True) | |
| g_df.rename(columns={'ActiveCaases_M':'ActiveCaases'}, inplace=True) | |
| l.logr('5.g_df_' + var1 + '.csv', DInd, g_df, 'log') | |
| # Working with forecast | |
| # Create the instance of the Forecast API Class | |
| x2 = f.clsForecast() | |
| # Fetching each country name & then get the details | |
| cnt = 6 | |
| cnt_x = 0 | |
| cnt_y = 0 | |
| df_M_Confirmed = p.DataFrame() | |
| df_M_Deaths = p.DataFrame() | |
| for i in countryList: | |
| try: | |
| cntryIndiv = i.strip() | |
| cntryFullName = countryDet(cntryIndiv) | |
| print('Country Porcessing: ' + str(cntryFullName)) | |
| # Creating dataframe for each country | |
| # Germany Main DataFrame | |
| dfCountry = countrySpecificDF(g_df, cntryIndiv) | |
| l.logr(str(cnt) + '.df_' + cntryIndiv + '_' + var1 + '.csv', DInd, dfCountry, 'log') | |
| # Let's pass this to our map section | |
| retDFGenNC = x2.forecastNewConfirmed(dfCountry, DInd, var1) | |
| statVal = str(NC) | |
| a1 = plot_picture(retDFGenNC, DInd, var1, cntryIndiv, statVal) | |
| # Merging with the previous Country Code data | |
| if cnt_x == 0: | |
| df_M_Confirmed = a1 | |
| else: | |
| d_frames = [df_M_Confirmed, a1] | |
| df_M_Confirmed = p.concat(d_frames) | |
| cnt_x += 1 | |
| retDFGenNC_D = x2.forecastNewDead(dfCountry, DInd, var1) | |
| statVal = str(ND) | |
| a2 = plot_picture(retDFGenNC_D, DInd, var1, cntryIndiv, statVal) | |
| # Merging with the previous Country Code data | |
| if cnt_y == 0: | |
| df_M_Deaths = a2 | |
| else: | |
| d_frames = [df_M_Deaths, a2] | |
| df_M_Deaths = p.concat(d_frames) | |
| cnt_y += 1 | |
| # Printing Proper message | |
| if (a1 + a2) == 0: | |
| oprMsg = cntryFullName + ' ' + SM | |
| print(oprMsg) | |
| else: | |
| oprMsg = cntryFullName + ' ' + FM | |
| print(oprMsg) | |
| # Resetting the dataframe value for the next iteration | |
| dfCountry = p.DataFrame() | |
| cntryIndiv = '' | |
| oprMsg = '' | |
| cntryFullName = '' | |
| a1 = 0 | |
| a2 = 0 | |
| statVal = '' | |
| cnt += 1 | |
| except Exception as e: | |
| x = str(e) | |
| print(x) | |
| l.logr('49.df_M_Confirmed_' + var1 + '.csv', DInd, df_M_Confirmed, 'log') | |
| l.logr('50.df_M_Deaths_' + var1 + '.csv', DInd, df_M_Deaths, 'log') | |
| # Removing unwanted columns | |
| df_M_Confirmed.drop(columns=['trend', 'trend_lower', 'trend_upper'], axis=1, inplace=True) | |
| df_M_Deaths.drop(columns=['trend', 'trend_lower', 'trend_upper'], axis=1, inplace=True) | |
| l.logr('51.df_M_Confirmed_' + var1 + '.csv', DInd, df_M_Confirmed, 'log') | |
| l.logr('52.df_M_Deaths_' + var1 + '.csv', DInd, df_M_Deaths, 'log') | |
| # Creating original dataframe from the source API | |
| df_M_Confirmed_Orig = g_df[['CountryCode', 'ReportedDate','NewConfirmed']] | |
| df_M_Deaths_Orig = g_df[['CountryCode', 'ReportedDate','NewDeaths']] | |
| # Transforming Country Code | |
| df_M_Confirmed_Orig['Country'] = df_M_Confirmed_Orig.apply(lambda row: lookupCountry(row), axis=1) | |
| df_M_Deaths_Orig['Country'] = df_M_Deaths_Orig.apply(lambda row: lookupCountry(row), axis=1) | |
| # Dropping unwanted column | |
| df_M_Confirmed_Orig.drop(columns=['CountryCode'], axis=1, inplace=True) | |
| df_M_Deaths_Orig.drop(columns=['CountryCode'], axis=1, inplace=True) | |
| # Reordering columns | |
| df_M_Confirmed_Orig = df_M_Confirmed_Orig.reindex(['ReportedDate','Country','NewConfirmed'], axis=1) | |
| df_M_Deaths_Orig = df_M_Deaths_Orig.reindex(['ReportedDate','Country','NewDeaths'], axis=1) | |
| l.logr('53.df_M_Confirmed_Orig_' + var1 + '.csv', DInd, df_M_Confirmed_Orig, 'log') | |
| l.logr('54.df_M_Deaths_Orig_' + var1 + '.csv', DInd, df_M_Deaths_Orig, 'log') | |
| # Filter out only the predicted data | |
| filterDF_1 = extractPredictedDF(df_M_Confirmed_Orig, df_M_Confirmed, 'NewConfirmed') | |
| l.logr('55.filterDF_1_' + var1 + '.csv', DInd, filterDF_1, 'log') | |
| filterDF_2 = extractPredictedDF(df_M_Confirmed_Orig, df_M_Confirmed, 'NewDeaths') | |
| l.logr('56.filterDF_2_' + var1 + '.csv', DInd, filterDF_2, 'log') | |
| # Calling the final publish events | |
| retVa = publishEvents(df_M_Confirmed_Orig, df_M_Deaths_Orig, filterDF_1, filterDF_2, var1, DInd) | |
| if retVa == 0: | |
| print('Successfully stream processed!') | |
| else: | |
| print('Failed to process stream!') | |
| var2 = datetime.datetime.now().strftime("%Y-%m-%d_%H-%M-%S") | |
| print('End Time: ' + str(var2)) | |
| print('*' *60) | |
| except Exception as e: | |
| x = str(e) | |
| print(x) | |
| if __name__ == "__main__": | |
| main() |
Let us understand the enhancement part of this script –
We’ve taken out the plotly part as we will use a separate dashboard script to visualize the data trend.
However, we need to understand the initial consumed data from API & how we transform the data, which will be helpful for visualization.
The initial captured data should look like this after extracting only the relevant elements from the API response.
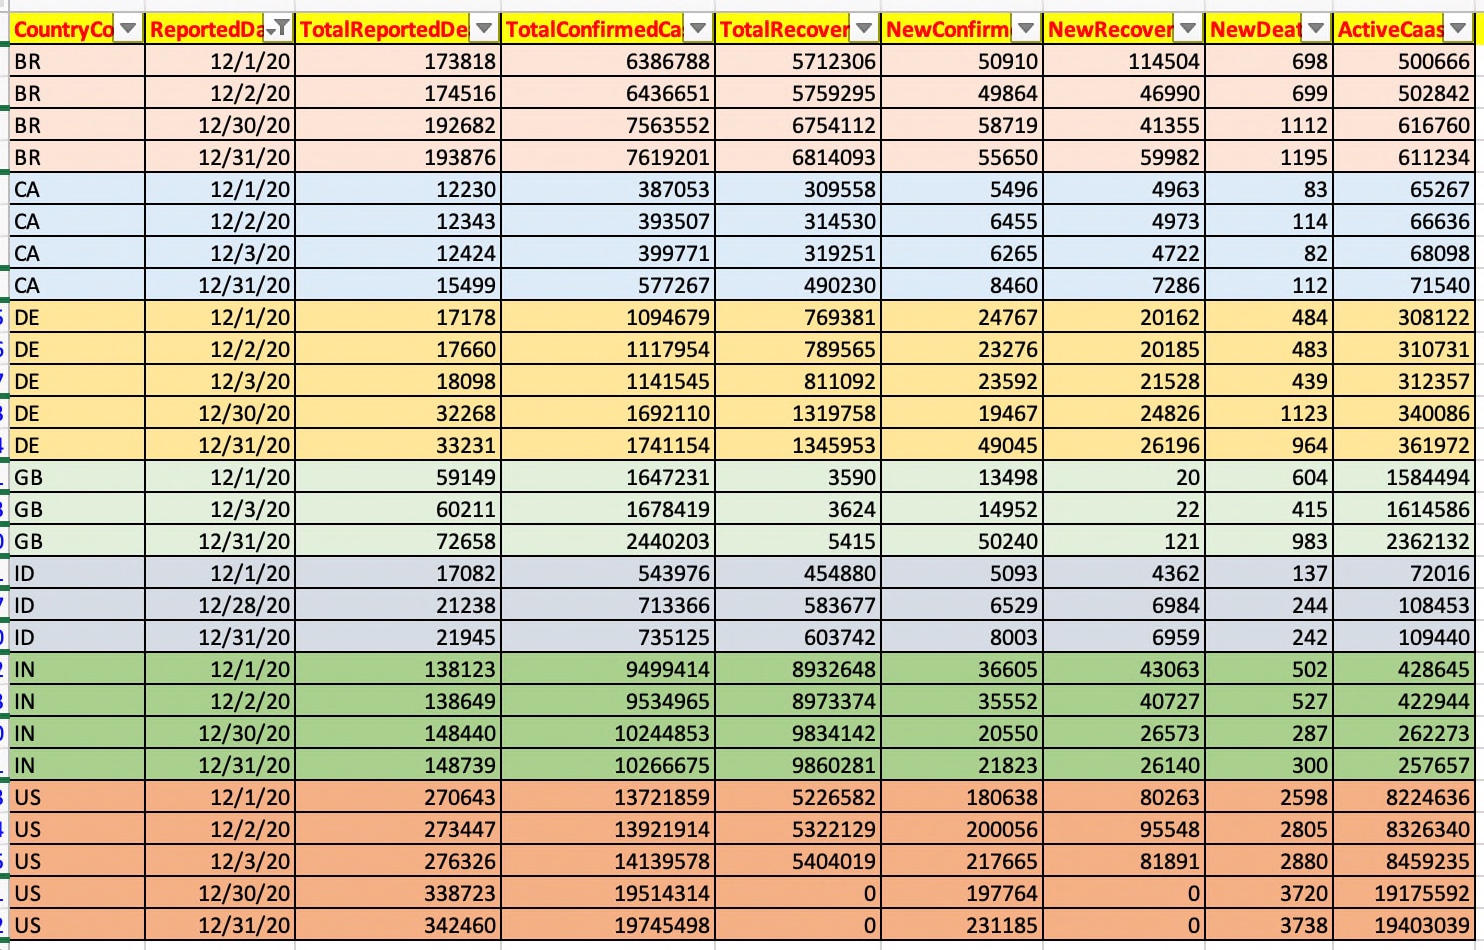
As you can see that based on the country & reported date, our application is consuming attributes like Total-Reported-Death, Total-Recovered, New-death, New-Confirmed & so on.
From this list, we’ve taken two attributes for our use cases & they are New-Death & New-Confirmed. Also, we’re predicting the Future-New-Death & Future-New-Confirmed based on the historical data using Facebook’s prophet API.
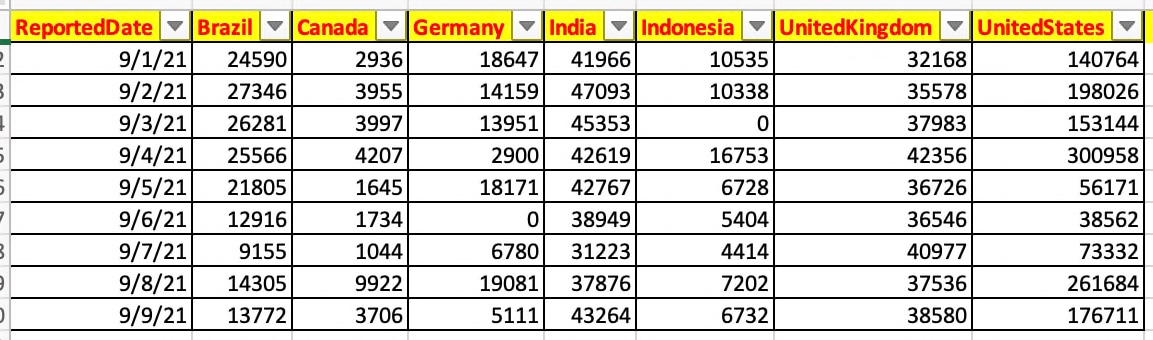
And, we would be transposing them & extract the countries & put them as columns for better representations.
Hence, here is the code that we should be exploring –
def toPivot(inDF, colName):
    try:
        iDF = inDF

        iDF_Piv = iDF.pivot_table(colName, ['ReportedDate'], 'Country')
        iDF_Piv.reset_index( drop=False, inplace=True )

        list1 = ['ReportedDate']

        iDF_Arr = iDF['Country'].unique()
        list2 = iDF_Arr.tolist()

        listV = list1 + list2

        iDF_Piv.reindex([listV], axis=1)

        return iDF_Piv
    except Exception as e:
        x = str(e)
        print(x)

        df = p.DataFrame()

        return df
Now, using the pivot_table function, we’re transposing the row values into the columns. And, later we’ve realigned the column heading as per our desired format.
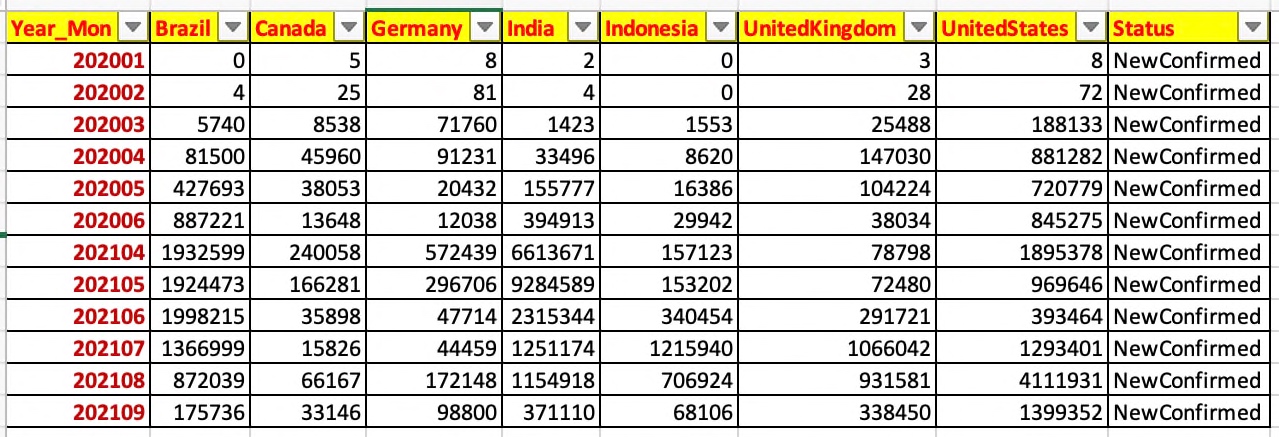
However, we still have the data as per individual daily dates in this case. We want to eliminate that by removing the daypart & then aggregate them by month as shown below –
And, here is the code for that –
def toAgg(inDF, var, debugInd, flg):
    try:
        iDF = inDF
        colName = "ReportedDate"

        list1 = list(iDF.columns.values)
        list1.remove(colName)

        list1 = ["Brazil", "Canada", "Germany", "India", "Indonesia", "UnitedKingdom", "UnitedStates"]

        iDF['Year_Mon'] = iDF[colName].apply(lambda x:x.strftime('%Y%m'))
        iDF.drop(columns=[colName], axis=1, inplace=True)

        ColNameGrp = "Year_Mon"
        print('List1 Aggregate:: ', str(list1))
        print('ColNameGrp :: ', str(ColNameGrp))

        iDF_T = iDF[["Year_Mon", "Brazil", "Canada", "Germany", "India", "Indonesia", "UnitedKingdom", "UnitedStates"]]
        iDF_T.fillna(0, inplace = True)
        print('iDF_T:: ')
        print(iDF_T)

        iDF_1_max_group = iDF_T.groupby(ColNameGrp, as_index=False)[list1].sum()
        iDF_1_max_group['Status'] = flg

        return iDF_1_max_group
    except Exception as e:
        x = str(e)
        print(x)

        df = p.DataFrame()

        return df
From the above snippet we can conclude that the application is taking out the daypart & then aggregate it based on the Year_Mon attribute.
The following snippet will push the final transformed data to Ably queue –
x1 = cps.clsPublishStream()

# Pushing both the Historical Confirmed Cases
retVal_1 = x1.pushEvents(iDF1_Agg, debugInd, var, NC)

if retVal_1 == 0:
    print('Successfully historical event pushed!')
else:
    print('Failed to push historical events!')
5. dashboard_realtime.py ( Main calling script to consume the data from Ably queue & then visualize the trend. )
This file contains hidden or bidirectional Unicode text that may be interpreted or compiled differently than what appears below. To review, open the file in an editor that reveals hidden Unicode characters.
Learn more about bidirectional Unicode characters
| ############################################## | |
| #### Written By: SATYAKI DE #### | |
| #### Written On: 08-Sep-2021 #### | |
| #### Modified On 08-Sep-2021 #### | |
| #### #### | |
| #### Objective: This is the main script #### | |
| #### to invoke dashboard after consuming #### | |
| #### streaming real-time predicted data #### | |
| #### using Facebook API & Ably message Q. #### | |
| #### #### | |
| #### This script will show the trend #### | |
| #### comparison between major democracies #### | |
| #### of the world. #### | |
| #### #### | |
| ############################################## | |
| import datetime | |
| import dash | |
| from dash import dcc | |
| from dash import html | |
| import plotly | |
| from dash.dependencies import Input, Output | |
| from ably import AblyRest | |
| from clsConfig import clsConfig as cf | |
| import pandas as p | |
| # Main Class to consume streaming | |
| import clsStreamConsume as ca | |
| import numpy as np | |
| # Create the instance of the Covid API Class | |
| x1 = ca.clsStreamConsume() | |
| external_stylesheets = ['https://codepen.io/chriddyp/pen/bWLwgP.css'%5D | |
| app = dash.Dash(__name__, external_stylesheets=external_stylesheets) | |
| app.layout = html.Div( | |
| html.Div([ | |
| html.H1("Covid-19 Trend Dashboard", | |
| className='text-center text-primary mb-4'), | |
| html.H5(children=''' | |
| Dash: Covid-19 Trend – (Present Vs Future) | |
| '''), | |
| html.P("Covid-19: New Confirmed Cases:", | |
| style={"textDecoration": "underline"}), | |
| dcc.Graph(id='live-update-graph-1'), | |
| html.P("Covid-19: New Death Cases:", | |
| style={"textDecoration": "underline"}), | |
| dcc.Graph(id='live-update-graph-2'), | |
| dcc.Interval( | |
| id='interval-component', | |
| interval=5*1000, # in milliseconds | |
| n_intervals=0 | |
| ) | |
| ], className="row", style={'marginBottom': 10, 'marginTop': 10}) | |
| ) | |
| def to_OptimizeString(row): | |
| try: | |
| x_str = str(row['Year_Mon']) | |
| dt_format = '%Y%m%d' | |
| finStr = x_str + '01' | |
| strReportDate = datetime.datetime.strptime(finStr, dt_format) | |
| return strReportDate | |
| except Exception as e: | |
| x = str(e) | |
| print(x) | |
| dt_format = '%Y%m%d' | |
| var = '20990101' | |
| strReportDate = datetime.strptime(var, dt_format) | |
| return strReportDate | |
| def fetchEvent(var1, DInd): | |
| try: | |
| # Let's pass this to our map section | |
| iDF_M = x1.conStream(var1, DInd) | |
| # Converting Year_Mon to dates | |
| iDF_M['Year_Mon_Mod']= iDF_M.apply(lambda row: to_OptimizeString(row), axis=1) | |
| # Dropping old columns | |
| iDF_M.drop(columns=['Year_Mon'], axis=1, inplace=True) | |
| #Renaming new column to old column | |
| iDF_M.rename(columns={'Year_Mon_Mod':'Year_Mon'}, inplace=True) | |
| return iDF_M | |
| except Exception as e: | |
| x = str(e) | |
| print(x) | |
| iDF_M = p.DataFrame() | |
| return iDF_M | |
| # Multiple components can update everytime interval gets fired. | |
| @app.callback(Output('live-update-graph-1', 'figure'), | |
| Input('interval-component', 'n_intervals')) | |
| def update_graph_live(n): | |
| try: | |
| var1 = datetime.datetime.now().strftime("%Y-%m-%d_%H-%M-%S") | |
| print('*' *60) | |
| DInd = 'Y' | |
| # Let's pass this to our map section | |
| retDF = fetchEvent(var1, DInd) | |
| # Create the graph with subplots | |
| #fig = plotly.tools.make_subplots(rows=2, cols=1, shared_xaxes=True, vertical_spacing=0.3, horizontal_spacing=0.2) | |
| fig = plotly.tools.make_subplots(rows=2, cols=1, vertical_spacing=0.3, horizontal_spacing=0.2) | |
| # Routing data to dedicated DataFrame | |
| retDFNC = retDF.loc[(retDF['Status'] == 'NewConfirmed')] | |
| # Adding different chart into one dashboard | |
| # First Use Case – New Confirmed | |
| fig.append_trace({'x':retDFNC.Year_Mon,'y':retDFNC.Brazil,'type':'scatter','name':'Brazil'},1,1) | |
| fig.append_trace({'x':retDFNC.Year_Mon,'y':retDFNC.Canada,'type':'scatter','name':'Canada'},1,1) | |
| fig.append_trace({'x':retDFNC.Year_Mon,'y':retDFNC.Germany,'type':'scatter','name':'Germany'},1,1) | |
| fig.append_trace({'x':retDFNC.Year_Mon,'y':retDFNC.India,'type':'scatter','name':'India'},1,1) | |
| fig.append_trace({'x':retDFNC.Year_Mon,'y':retDFNC.Indonesia,'type':'scatter','name':'Indonesia'},1,1) | |
| fig.append_trace({'x':retDFNC.Year_Mon,'y':retDFNC.UnitedKingdom,'type':'scatter','name':'United Kingdom'},1,1) | |
| fig.append_trace({'x':retDFNC.Year_Mon,'y':retDFNC.UnitedStates,'type':'scatter','name':'United States'},1,1) | |
| return fig | |
| except Exception as e: | |
| x = str(e) | |
| print(x) | |
| # Create the graph with subplots | |
| fig = plotly.tools.make_subplots(rows=2, cols=1, vertical_spacing=0.2) | |
| fig['layout']['margin'] = { | |
| 'l': 30, 'r': 10, 'b': 30, 't': 10 | |
| } | |
| fig['layout']['legend'] = {'x': 0, 'y': 1, 'xanchor': 'left'} | |
| return fig | |
| # Multiple components can update everytime interval gets fired. | |
| @app.callback(Output('live-update-graph-2', 'figure'), | |
| Input('interval-component', 'n_intervals')) | |
| def update_graph_live(n): | |
| try: | |
| var1 = datetime.datetime.now().strftime("%Y-%m-%d_%H-%M-%S") | |
| print('*' *60) | |
| DInd = 'Y' | |
| # Let's pass this to our map section | |
| retDF = fetchEvent(var1, DInd) | |
| # Create the graph with subplots | |
| #fig = plotly.tools.make_subplots(rows=2, cols=1, shared_xaxes=True, vertical_spacing=0.3, horizontal_spacing=0.2) | |
| fig = plotly.tools.make_subplots(rows=2, cols=1, vertical_spacing=0.3, horizontal_spacing=0.2) | |
| # Routing data to dedicated DataFrame | |
| retDFND = retDF.loc[(retDF['Status'] == 'NewDeaths')] | |
| # Adding different chart into one dashboard | |
| # Second Use Case – New Confirmed | |
| fig.append_trace({'x':retDFND.Year_Mon,'y':retDFND.Brazil,'type':'bar','name':'Brazil'},1,1) | |
| fig.append_trace({'x':retDFND.Year_Mon,'y':retDFND.Canada,'type':'bar','name':'Canada'},1,1) | |
| fig.append_trace({'x':retDFND.Year_Mon,'y':retDFND.Germany,'type':'bar','name':'Germany'},1,1) | |
| fig.append_trace({'x':retDFND.Year_Mon,'y':retDFND.India,'type':'bar','name':'India'},1,1) | |
| fig.append_trace({'x':retDFND.Year_Mon,'y':retDFND.Indonesia,'type':'bar','name':'Indonesia'},1,1) | |
| fig.append_trace({'x':retDFND.Year_Mon,'y':retDFND.UnitedKingdom,'type':'bar','name':'United Kingdom'},1,1) | |
| fig.append_trace({'x':retDFND.Year_Mon,'y':retDFND.UnitedStates,'type':'bar','name':'United States'},1,1) | |
| return fig | |
| except Exception as e: | |
| x = str(e) | |
| print(x) | |
| # Create the graph with subplots | |
| fig = plotly.tools.make_subplots(rows=2, cols=1, vertical_spacing=0.2) | |
| fig['layout']['margin'] = { | |
| 'l': 30, 'r': 10, 'b': 30, 't': 10 | |
| } | |
| fig['layout']['legend'] = {'x': 0, 'y': 1, 'xanchor': 'left'} | |
| return fig | |
| if __name__ == '__main__': | |
| app.run_server(debug=True) |
Let us explore the critical snippet as this is a brand new script –
external_stylesheets = ['https://codepen.io/chriddyp/pen/bWLwgP.css']

app = dash.Dash(__name__, external_stylesheets=external_stylesheets)

app.layout = html.Div(
    html.Div([
        html.H1("Covid-19 Trend Dashboard",
                        className='text-center text-primary mb-4'),
        html.H5(children='''
            Dash: Covid-19 Trend - (Present Vs Future)
        '''),
        html.P("Covid-19: New Confirmed Cases:",
               style={"textDecoration": "underline"}),
        dcc.Graph(id='live-update-graph-1'),
        html.P("Covid-19: New Death Cases:",
               style={"textDecoration": "underline"}),
        dcc.Graph(id='live-update-graph-2'),
        dcc.Interval(
            id='interval-component',
            interval=5*1000, # in milliseconds
            n_intervals=0
        )
    ], className="row", style={'marginBottom': 10, 'marginTop': 10})
)
You need to understand the basics of HTML as this framework works seamlessly with it. To know more about the supported HTML, one needs to visit the following link.
def to_OptimizeString(row):
    try:
        x_str = str(row['Year_Mon'])

        dt_format = '%Y%m%d'
        finStr = x_str + '01'

        strReportDate = datetime.datetime.strptime(finStr, dt_format)

        return strReportDate

    except Exception as e:
        x = str(e)
        print(x)

        dt_format = '%Y%m%d'
        var = '20990101'

        strReportDate = datetime.strptime(var, dt_format)

        return strReportDate
The application is converting Year-Month combinations from string to date for better projection.
Also, we’ve implemented a dashboard that will refresh every five milliseconds.
def fetchEvent(var1, DInd):
    try:
        # Let's pass this to our map section
        iDF_M = x1.conStream(var1, DInd)

        # Converting Year_Mon to dates
        iDF_M['Year_Mon_Mod']= iDF_M.apply(lambda row: to_OptimizeString(row), axis=1)

        # Dropping old columns
        iDF_M.drop(columns=['Year_Mon'], axis=1, inplace=True)

        #Renaming new column to old column
        iDF_M.rename(columns={'Year_Mon_Mod':'Year_Mon'}, inplace=True)

        return iDF_M

    except Exception as e:
        x = str(e)
        print(x)

        iDF_M = p.DataFrame()

        return iDF_M
The application will consume all the events from the Ably Queue using the above snippet.
@app.callback(Output('live-update-graph-1', 'figure'),
              Input('interval-component', 'n_intervals'))
def update_graph_live(n):
We’ve implemented the callback mechanism to get the latest data from the Queue & then update the graph accordingly & finally share the updated chart & return that to our method, which is calling it.
# Routing data to dedicated DataFrame
retDFNC = retDF.loc[(retDF['Status'] == 'NewConfirmed')]
Based on the flag, we’re pushing the data into our target dataframe, from where the application will consume the data into the charts.
fig.append_trace({'x':retDFNC.Year_Mon,'y':retDFNC.Brazil,'type':'scatter','name':'Brazil'},1,1)
fig.append_trace({'x':retDFNC.Year_Mon,'y':retDFNC.Canada,'type':'scatter','name':'Canada'},1,1)
fig.append_trace({'x':retDFNC.Year_Mon,'y':retDFNC.Germany,'type':'scatter','name':'Germany'},1,1)
fig.append_trace({'x':retDFNC.Year_Mon,'y':retDFNC.India,'type':'scatter','name':'India'},1,1)
fig.append_trace({'x':retDFNC.Year_Mon,'y':retDFNC.Indonesia,'type':'scatter','name':'Indonesia'},1,1)
fig.append_trace({'x':retDFNC.Year_Mon,'y':retDFNC.UnitedKingdom,'type':'scatter','name':'United Kingdom'},1,1)
fig.append_trace({'x':retDFNC.Year_Mon,'y':retDFNC.UnitedStates,'type':'scatter','name':'United States'},1,1)
Different country’s KPI elements are fetched & mapped into their corresponding axis to project the graph with visual details.
Same approach goes for the other graph as well.
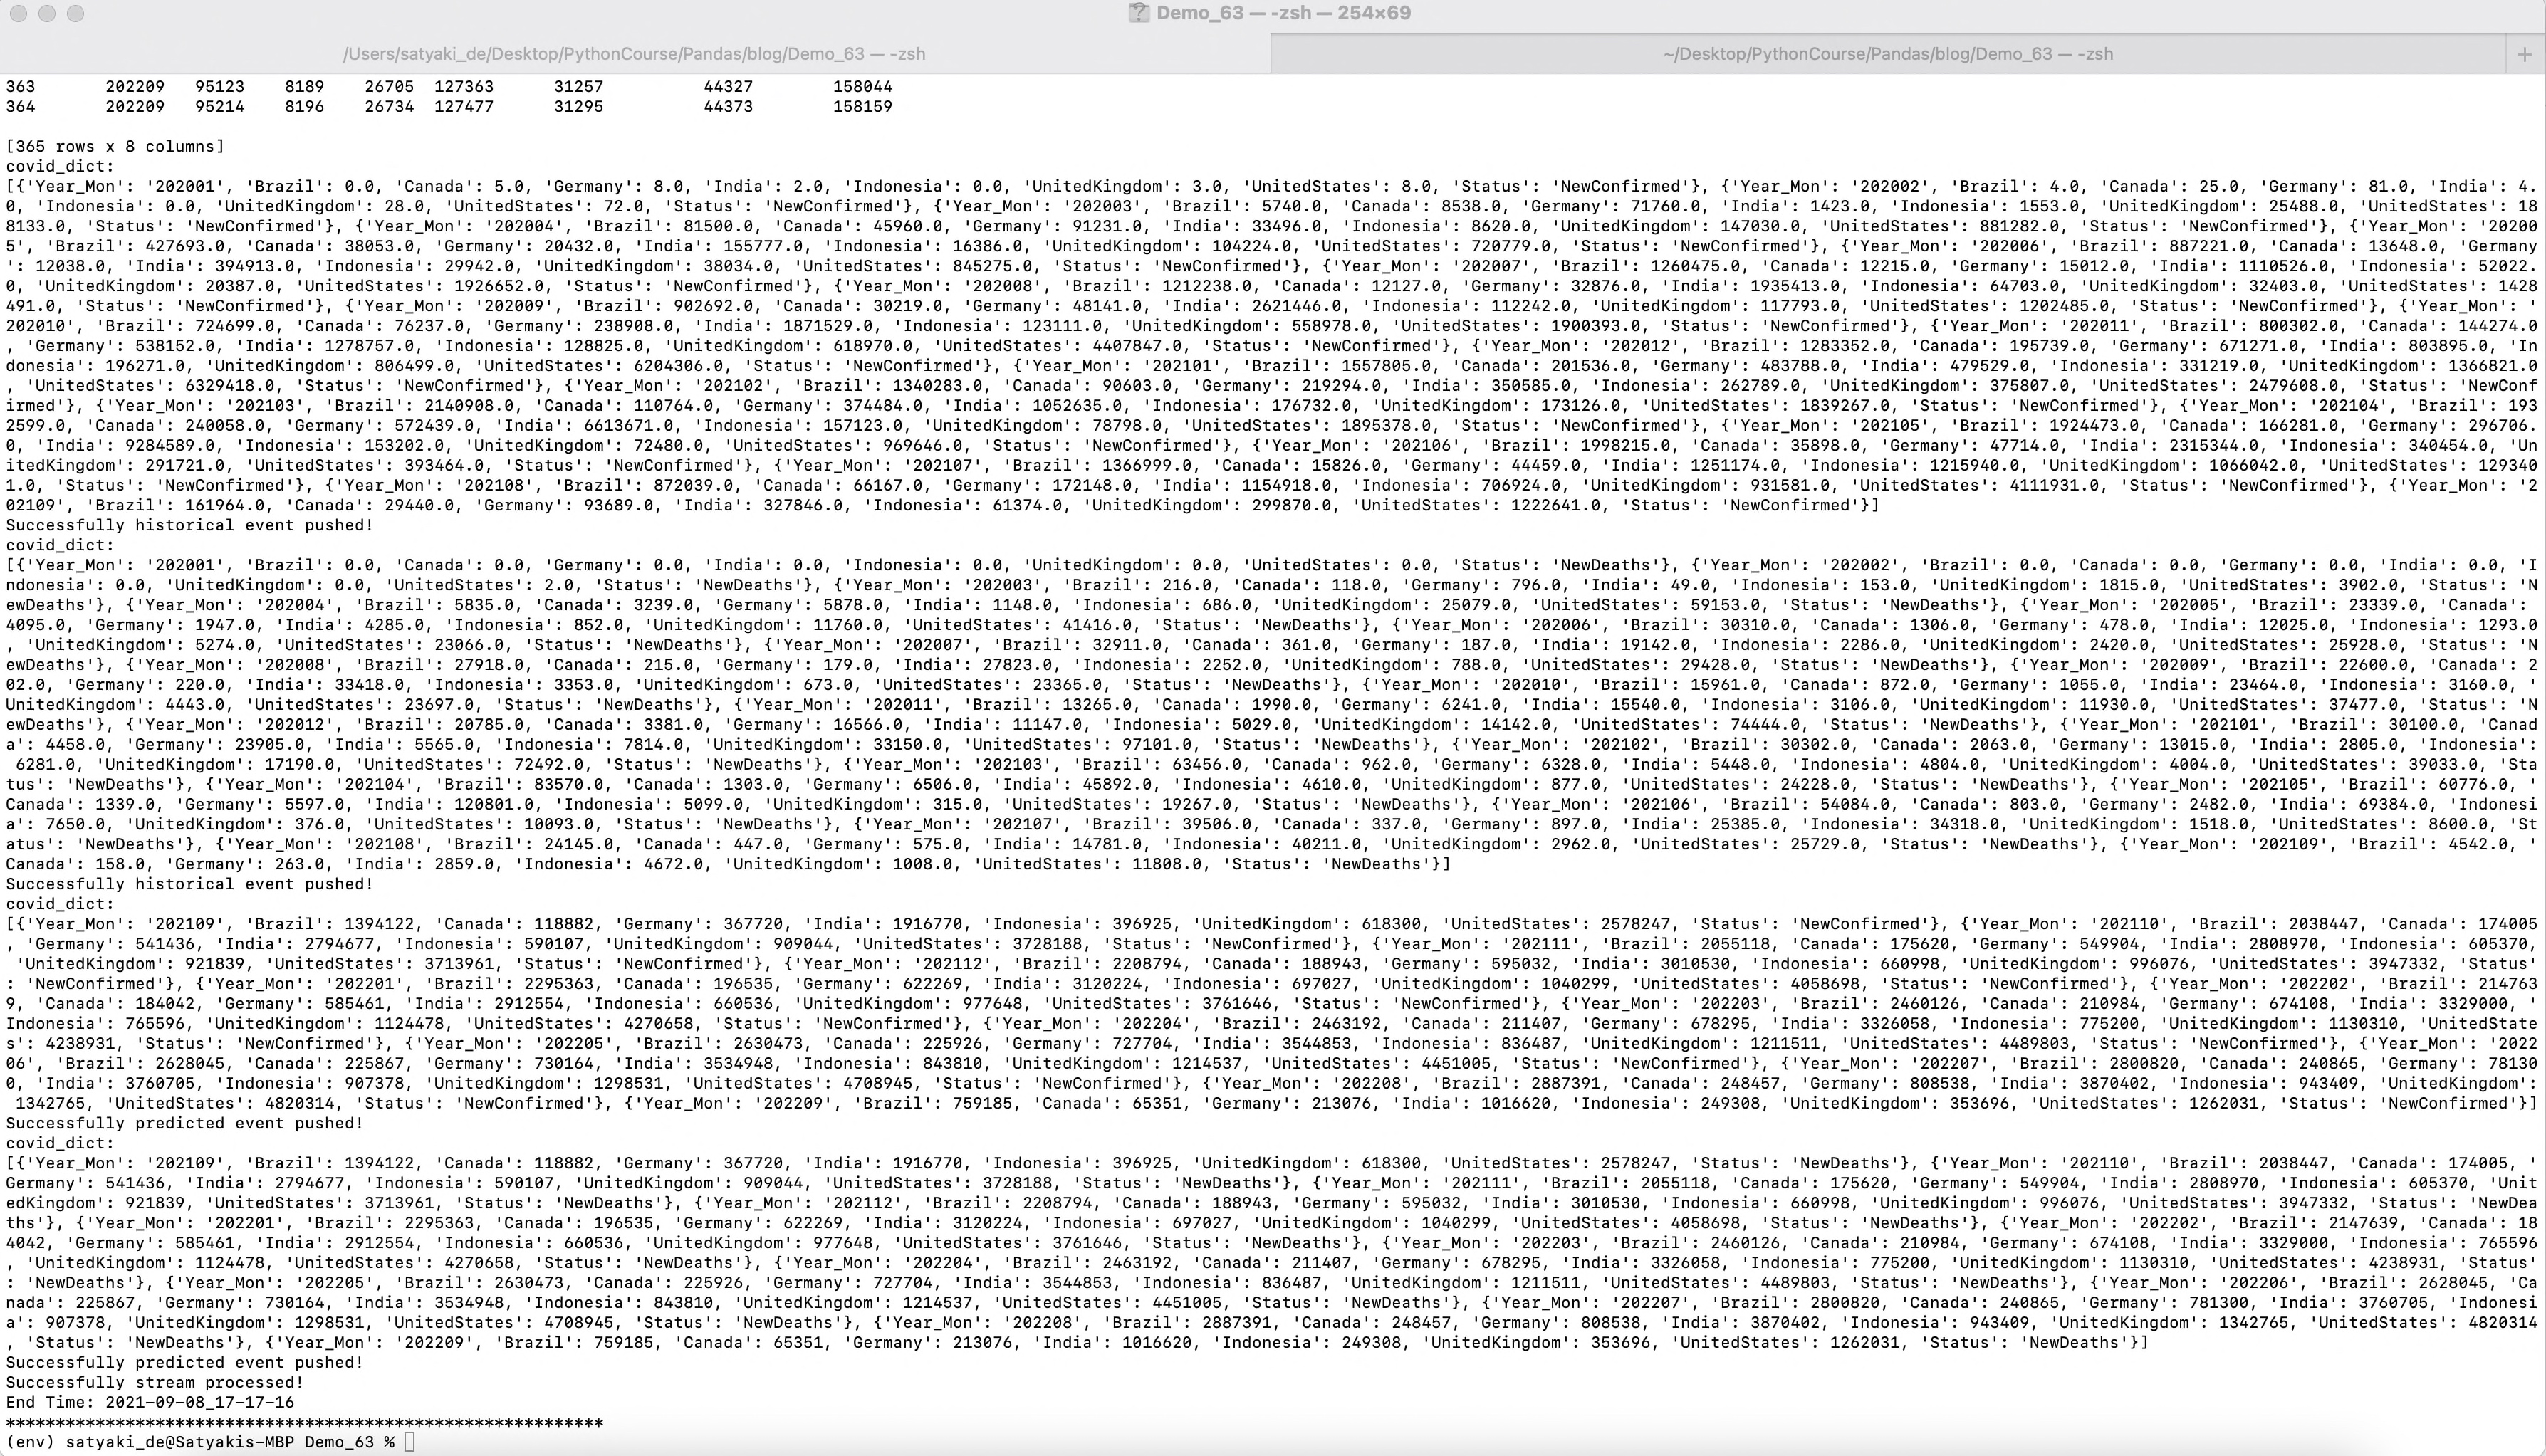
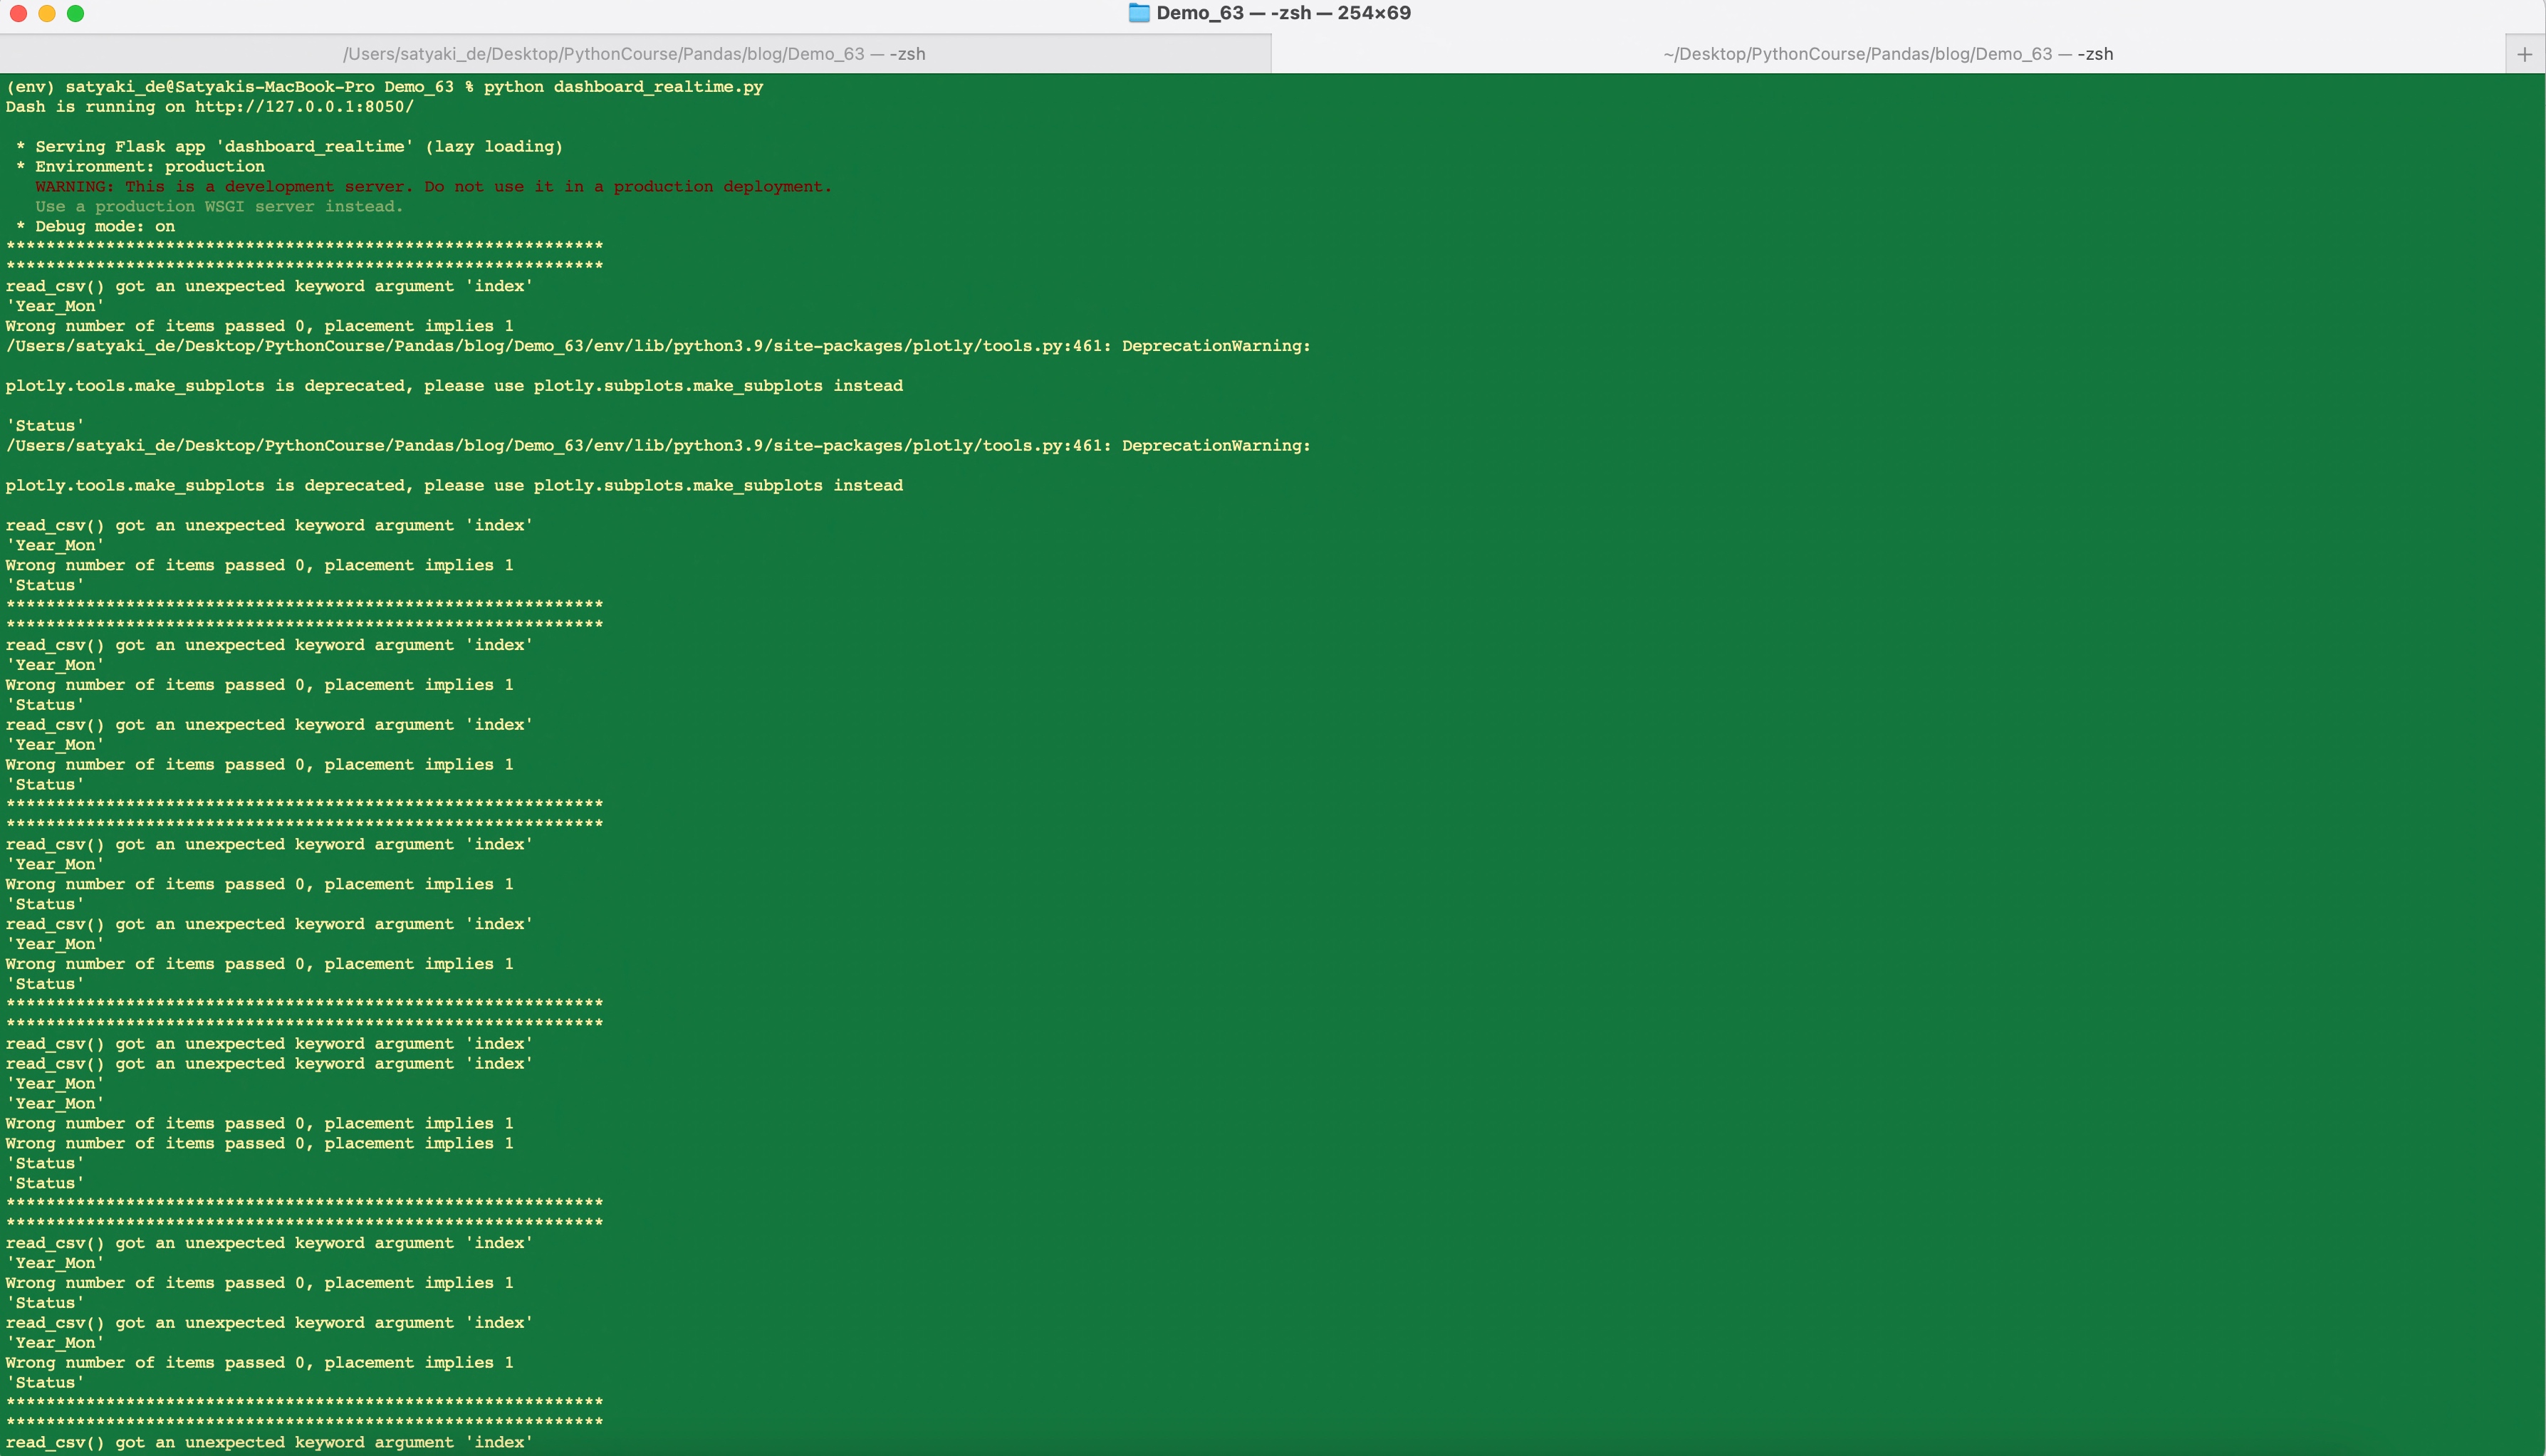
Run:
Let us run the application –
Dashboard:
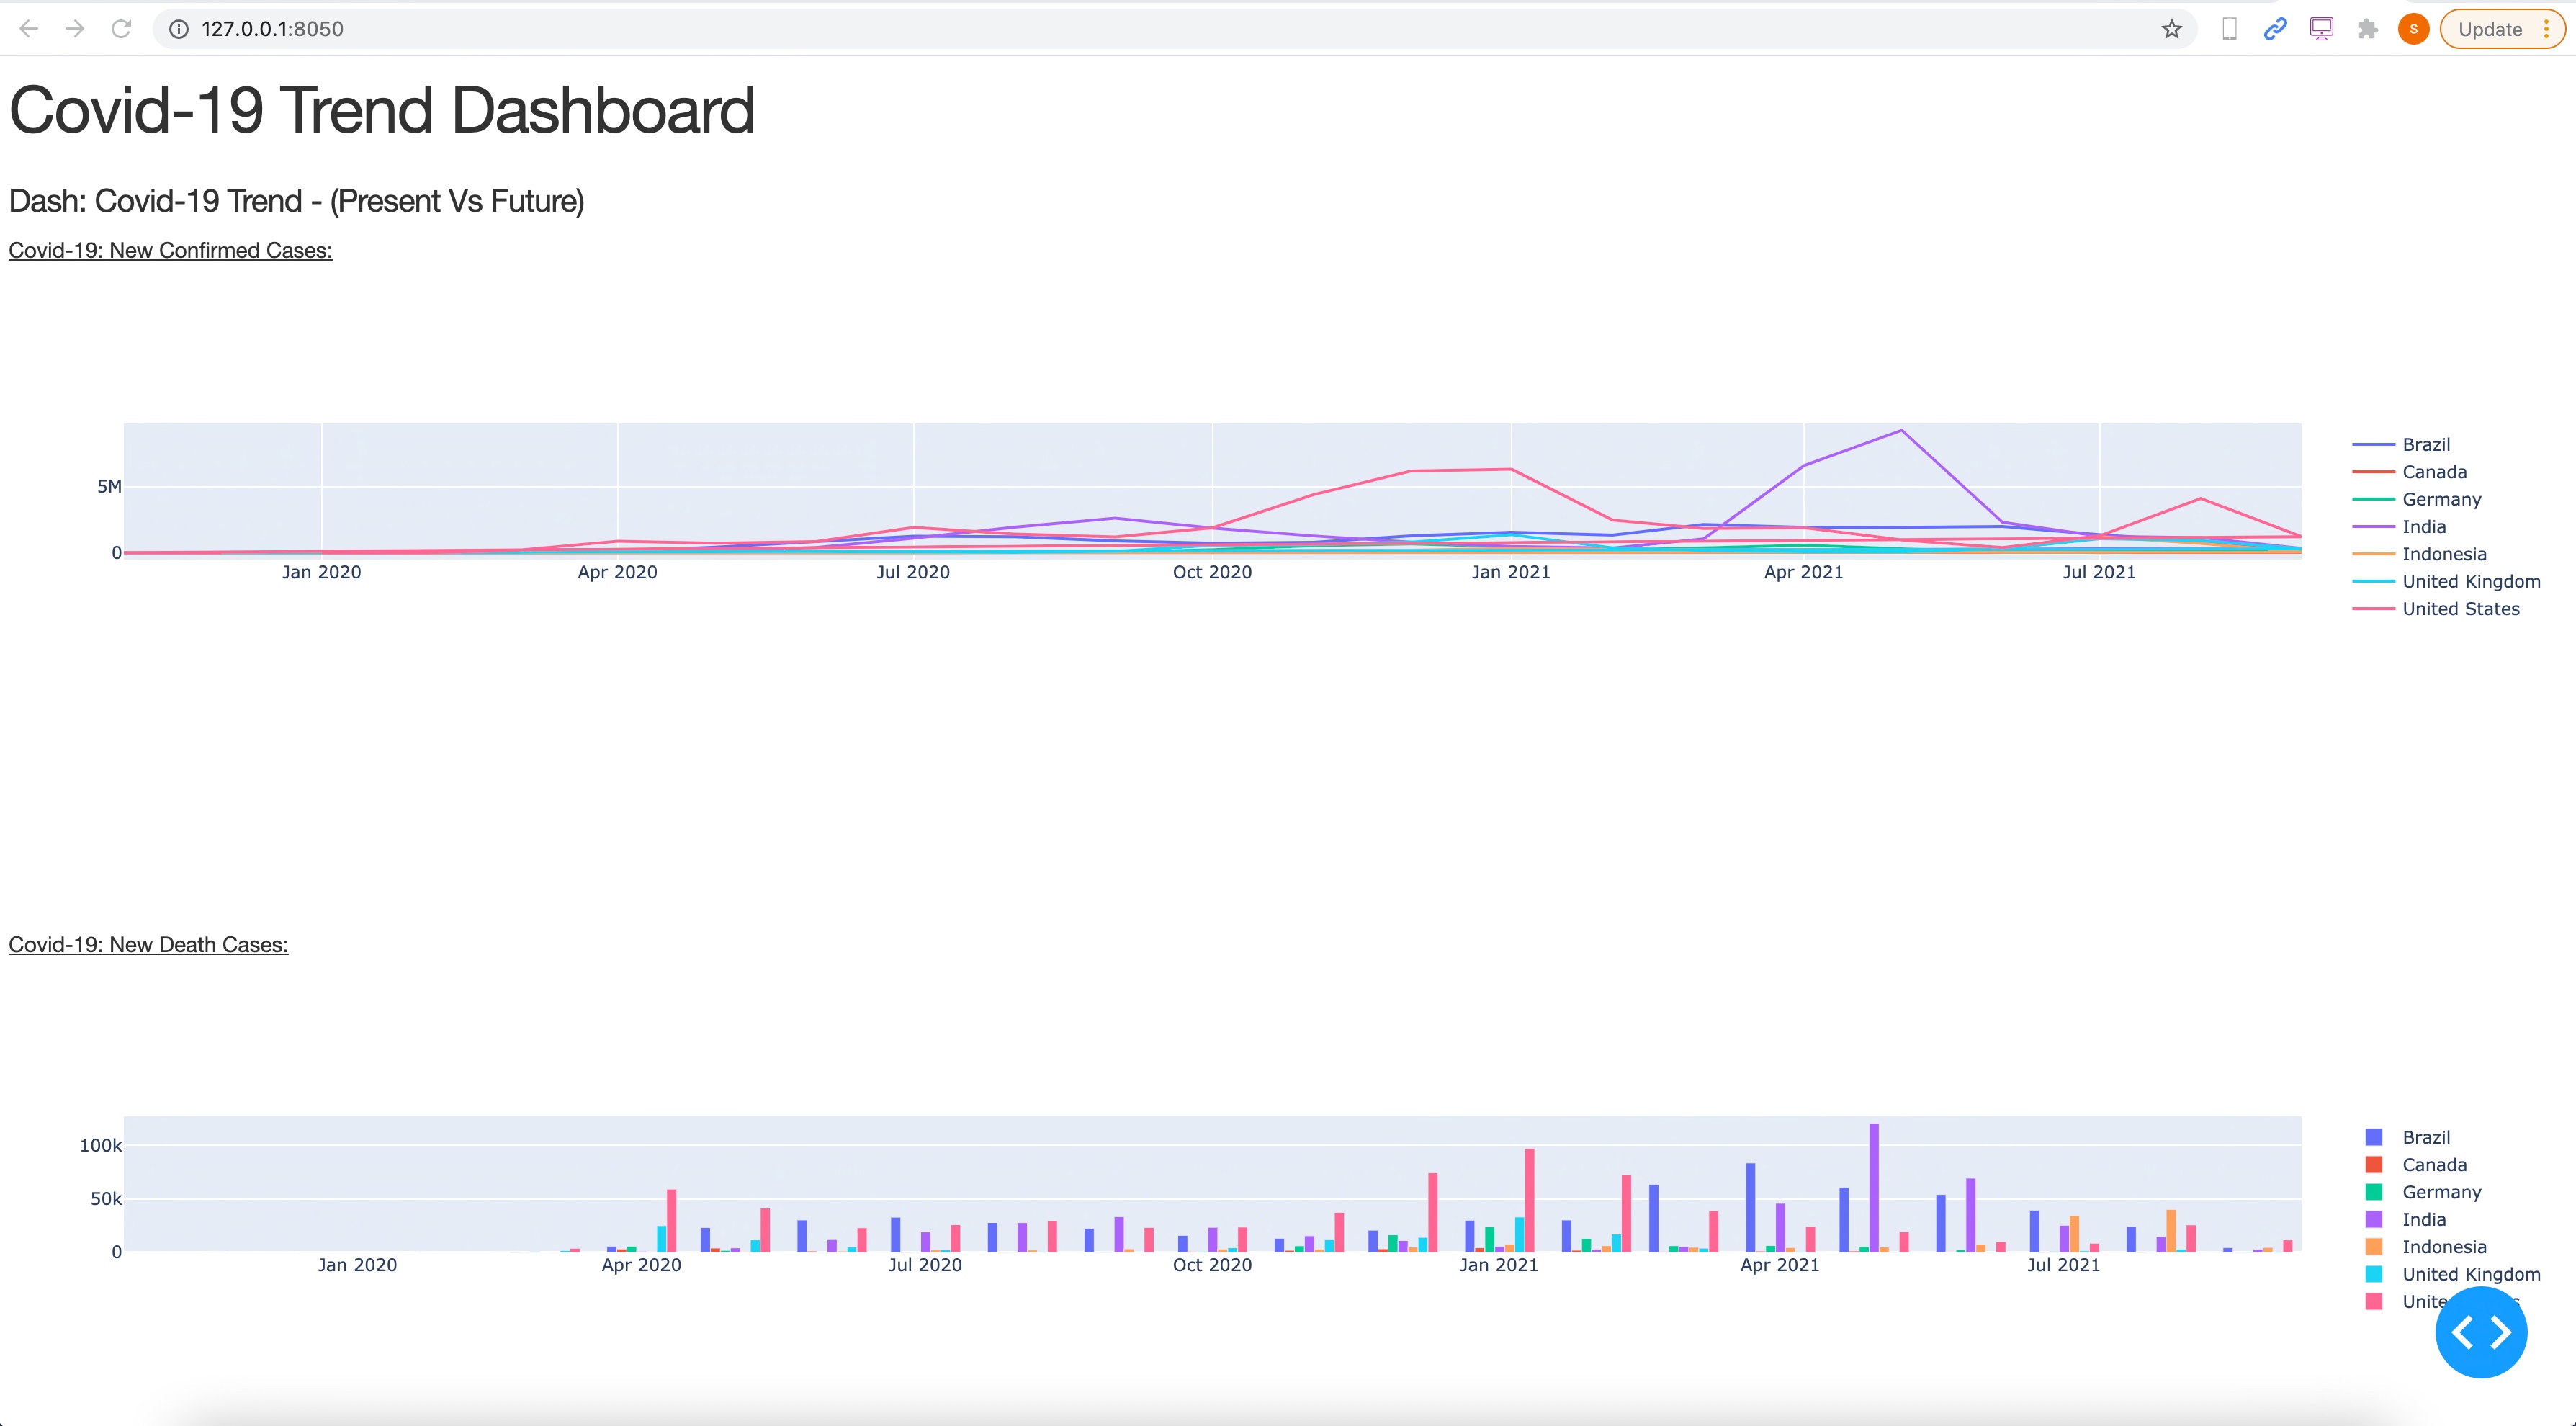
So, we’ve done it.
You will get the complete codebase in the following Github link.
I’ll bring some more exciting topic in the coming days from the Python verse.
Till then, Happy Avenging! 😀
Note: All the data & scenario posted here are representational data & scenarios & available over the internet & for educational purpose only.
One more thing you need to understand is that this prediction based on limited data points. The actual event may happen differently. Ideally, countries are taking a cue from this kind of analysis & are initiating appropriate measures to avoid the high-curve. And, that is one of the main objective of time series analysis.
There is always a room for improvement of this kind of models & the solution associated with it. I’ve shown the basic ways to achieve the same for the education purpose only.


You must be logged in to post a comment.