This site mainly deals with various use cases demonstrated using Python, Data Science, Cloud basics, SQL Server, Oracle, Teradata along with SQL & their implementation. Expecting yours active participation & time. This blog can be access from your TP, Tablet & mobile also. Please provide your feedback.
At the recent Argyle AI Summit, a prestigious event in the AI industry, I had the honor of participating as a speaker alongside esteemed professionals like Misha Leybovich from Google Labs. The summit, coordinated by Sylvia Das Chagas, a former senior AI conversation designer at CVS Health, provided an enlightening platform to discuss the evolving role of AI in talent management. Our session focused on the theme “Driving Talent with AI,” addressing some of the most pressing questions in the field. Frequently, relevant use cases were shared in detail to support these threads.
To view the actual page, please click the following link.
Impact of AI on Talent Management
One of the critical topics we explored was AI’s impact on talent management in the upcoming year. AI’s influence in hiring and retention is becoming increasingly significant. For example, AI-powered tools can now analyze vast amounts of data to identify the best candidates for a role, going beyond traditional resume screening. In retention, AI is instrumental in identifying patterns that indicate an employee’s likelihood to leave, enabling proactive measures.
Dispelling Fears Around AI Replacing Jobs
A burning question in AI is how leaders address fears that AI might replace manual jobs. We discussed the importance of leaders framing AI as a complement to human skills rather than a replacement. AI enhances employee capabilities by automating mundane tasks, allowing employees to focus on more creative and strategic work.
Innovative AI Tools for Organizations
Regarding new AI tools that organizations should watch out for, the conversation highlighted tools that enhance remote collaboration and workplace inclusivity. Tools like virtual meeting assistants that can transcribe, translate, and summarize meetings in real time are becoming invaluable in today’s global work environment.
AI in Boosting Employee Motivation and Productivity
AI’s role in boosting employee motivation and productivity was another focal point. We discussed how AI-driven career development programs can offer personalized learning paths, helping employees grow and stay motivated.
Incorporating Multilingual Capabilities in AI Tools
Incorporating multiple languages in tools like ChatGPT was highlighted as a critical step towards inclusivity. This expansion allows a broader range of employees to interact with AI tools in their native language, fostering a more inclusive workplace environment.
Addressing Reluctance to Change
Lastly, we tackled the challenge of addressing employees’ reluctance to change. Emphasizing the importance of transparent communication and education about AI’s benefits was identified as key. Organizations can alleviate fears and encourage a more accepting attitude towards AI by involving employees in the AI implementation process and providing training.
Conclusion
The Argyle AI Summit offered a compelling glimpse into the future of AI in talent management. The session provided valuable insights for leaders looking to harness AI’s potential to enhance talent management strategies by discussing real-world examples and strategies. To gain more in-depth knowledge and perspectives shared during this summit, I encourage interested parties to visit the recorded session link for a more comprehensive understanding.
Or, you can directly view it from here –
Feedback Request
I would greatly appreciate your feedback on the insights shared during the summit. Your thoughts and perspectives are invaluable as we continue to explore and navigate the evolving landscape of AI in the workplace.
Note: Video content hosted at a third-party site by the summit organizer & not by me.
Today, I’ll share a little different topic in Python compared to my last couple of posts, where I have demonstrated the use of Python in the field of machine learning & forecast modeling.
We’ll explore to create meaningful sample data points for Airlines & hotel reservations. At this moment, this industry is the hard-hit due to the pandemic. And I personally wish a speedy recovery to all employees who risked their lives to maintain the operation or might have lost their jobs due to this time.
I’ll be providing only major scripts & will show how you can extract critical data from their API.
However, to create the API, you need to register in Amadeus as a developer & follow specific steps to get the API details. You will need to register using the following link.
Step 1:
Once you provide the necessary details, you need to activate your account by clicking the email validation.
Step 2:
As part of the next step, you will be clicking the “Self-Service Workspace” option as marked in the green box shown above.
Now, you have to click “My apps“ & under that, you need to click – “Create new app” shown below –
Step 3:
You need to provide the following details before creating the API. Note that once you create – it will take 30 minutes to activate the API-link.
Step 4:
You will come to the next page once you click the “Create” button in the previous step.
For production, you need to create a separate key shown above.
You need to install the following packages –
pip install amadeus
And, the installation process is shown as –
pip install flatten_json
And, this installation process is shown as –
1. clsAmedeus (This is the API script, which will send the API requests & return JSON if successful.)
################################################## Written By: SATYAKI DE ######## Written On: 05-Jul-2020 ######## Modified On 05-Jul-2020 ######## ######## Objective: Main calling scripts. ##################################################fromamadeusimport Client, ResponseError
importjsonfromclsConfigimport clsConfig as cf
classclsAmedeus:
def__init__(self):
self.client_id = cf.config['CLIENT_ID']
self.client_secret = cf.config['CLIENT_SECRET']
self.type = cf.config['API_TYPE']
defflightOffers(self, origLocn, destLocn, departDate, noOfAdult):
try:
cnt =0# Setting Clients
amadeus = Client(
client_id=str(self.client_id),
client_secret=str(self.client_secret)
)
# Flight Offers
response = amadeus.shopping.flight_offers_search.get(
originLocationCode=origLocn,
destinationLocationCode=destLocn,
departureDate=departDate,
adults=noOfAdult)
ResJson = response.data
return ResJson
exceptExceptionas e:
print(e)
x =str(e)
ResJson = {'errorDetails': x}
return ResJson
defcheapestDate(self, origLocn, destLocn):
try:
# Setting Clients
amadeus = Client(
client_id=self.client_id,
client_secret=self.client_secret
)
# Flight Offers# Flight Cheapest Date Search
response = amadeus.shopping.flight_dates.get(origin=origLocn, destination=destLocn)
ResJson = response.data
return ResJson
exceptExceptionas e:
print(e)
x =str(e)
ResJson = {'errorDetails': x}
return ResJson
deflistOfHotelsByCity(self, origLocn):
try:
# Setting Clients
amadeus = Client(
client_id=self.client_id,
client_secret=self.client_secret
)
# Hotel Search# Get list of Hotels by city code
response = amadeus.shopping.hotel_offers.get(cityCode=origLocn)
ResJson = response.data
return ResJson
exceptExceptionas e:
print(e)
x =str(e)
ResJson = {'errorDetails': x}
return ResJson
deflistOfOffersBySpecificHotels(self, hotelID):
try:
# Setting Clients
amadeus = Client(
client_id=self.client_id,
client_secret=self.client_secret
)
# Get list of offers for a specific hotel
response = amadeus.shopping.hotel_offers_by_hotel.get(hotelId=hotelID)
ResJson = response.data
return ResJson
exceptExceptionas e:
print(e)
x =str(e)
ResJson = {'errorDetails': x}
return ResJson
defhotelReview(self, hotelID):
try:
# Setting Clients
amadeus = Client(
client_id=self.client_id,
client_secret=self.client_secret
)
# Hotel Ratings# What travelers think about this hotel?
response = amadeus.e_reputation.hotel_sentiments.get(hotelIds=hotelID)
ResJson = response.data
return ResJson
exceptExceptionas e:
print(e)
x =str(e)
ResJson = {'errorDetails': x}
return ResJson
defprocess(self, choice, origLocn, destLocn, departDate, noOfAdult, hotelID):
try:
# Main Area to call apropriate choiceif choice ==1:
resJson =self.flightOffers(origLocn, destLocn, departDate, noOfAdult)
elif choice ==2:
resJson =self.cheapestDate(origLocn, destLocn)
elif choice ==3:
resJson =self.listOfHotelsByCity(origLocn)
elif choice ==4:
resJson =self.listOfOffersBySpecificHotels(hotelID)
elif choice ==5:
resJson =self.hotelReview(hotelID)
else:
resJson = {'errorDetails': 'Invalid Options!'}
# Converting back to JSON
jdata = json.dumps(resJson)
# Checking the begining character# for the new package# As that requires dictionary array# Hence, We'll be adding '[' if this# is missing from the return payload
SYM = jdata[:1]
if SYM !='[':
rdata ='['+ jdata +']'else:
rdata = jdata
ResJson = json.loads(rdata)
return ResJson
except ResponseError as error:
x =str(error)
resJson = {'errorDetails': x}
return resJson
Let’s explore the key lines –
Creating an instance of the client by providing the recently acquired API Key & API-Secret.
Today, I’ll be demonstrating some scenarios based on open-source data from Canada. In this post, I will only explain some of the significant parts of the code. Not the entire range of scripts here.
Let’s explore a couple of sample source data –
I would like to explore how much this disease caused an impact on the elderly in Canada.
Let’s explore the source directory structure –
For this, you need to install the following packages –
In this case, we’ve downloaded the data from Canada’s site. However, they have created API. So, you can consume the data through that way as well. Since the volume is a little large. I decided to download that in CSV & then use that for my analysis.
Before I start, let me explain a couple of critical assumptions that I had to make due to data impurities or availabilities.
If there is no data available for a specific case, my application will consider that patient as COVID-Active.
We will consider the patient is affected through Community-spreading until we have data to find it otherwise.
If there is no data available for gender, we’re marking these records as “Other.” So, that way, we’re making it into that category, where the patient doesn’t want to disclose their sexual orientation.
If we don’t have any data, then by default, the application is considering the patient is alive.
Lastly, my application considers the middle point of the age range data for all the categories, i.e., the patient’s age between 20 & 30 will be considered as 25.
1. clsCovidAnalysisByCountryAdv (This is the main script, which will invoke the Machine-Learning API & return 0 if successful.)
################################################## Written By: SATYAKI DE ######## Written On: 01-Jun-2020 ######## Modified On 01-Jun-2020 ######## ######## Objective: Main scripts for Logistic ######## Regression. ##################################################importpandasaspimportclsLaslogimportdatetimeimportmatplotlib.pyplotaspltimportseabornassnsfromclsConfigimport clsConfig as cf
# %matplotlib inline -- for Jupyter NotebookclassclsCovidAnalysisByCountryAdv:
def__init__(self):
self.fileName_1 = cf.config['FILE_NAME_1']
self.fileName_2 = cf.config['FILE_NAME_2']
self.Ind = cf.config['DEBUG_IND']
self.subdir =str(cf.config['LOG_DIR_NAME'])
defsetDefaultActiveCases(self, row):
try:
str_status =str(row['case_status'])
if str_status =='Not Reported':
return'Active'else:
return str_status
except:
return'Active'defsetDefaultExposure(self, row):
try:
str_exposure =str(row['exposure'])
if str_exposure =='Not Reported':
return'Community'else:
return str_exposure
except:
return'Community'defsetGender(self, row):
try:
str_gender =str(row['gender'])
if str_gender =='Not Reported':
return'Other'else:
return str_gender
except:
return'Other'defsetSurviveStatus(self, row):
try:
# 0 - Deceased# 1 - Alive
str_active =str(row['ActiveCases'])
if str_active =='Deceased':
return0else:
return1except:
return1defgetAgeFromGroup(self, row):
try:
# We'll take the middle of the Age group# If a age range falls with 20, we'll# consider this as 10.# Similarly, a age group between 20 & 30,# should reflect by 25.# Anything above 80 will be considered as# 85
str_age_group =str(row['AgeGroup'])
if str_age_group =='<20':
return10elif str_age_group =='20-29':
return25elif str_age_group =='30-39':
return35elif str_age_group =='40-49':
return45elif str_age_group =='50-59':
return55elif str_age_group =='60-69':
return65elif str_age_group =='70-79':
return75else:
return85except:
return100defpredictResult(self):
try:
# Initiating Logging Instances
clog = log.clsL()
# Important variables
var = datetime.datetime.now().strftime(".%H.%M.%S")
print('Target File Extension will contain the following:: ', var)
Ind =self.Ind
subdir =self.subdir
######################################## ## Using Logistic Regression to ## Idenitfy the following scenarios - ## ## Age wise Infection Vs Deaths ## ########################################
inputFileName_2 =self.fileName_2
# Reading from Input File
df_2 = p.read_csv(inputFileName_2)
# Fetching only relevant columns
df_2_Mod = df_2[['date_reported','age_group','gender','exposure','case_status']]
df_2_Mod['State'] = df_2['province_abbr']
print()
print('Projecting 2nd file sample rows: ')
print(df_2_Mod.head())
print()
x_row_1 = df_2_Mod.shape[0]
x_col_1 = df_2_Mod.shape[1]
print('Total Number of Rows: ', x_row_1)
print('Total Number of columns: ', x_col_1)
########################################################################################## Few Assumptions ########################################################################################### By default, if there is no data on exposure - We'll treat that as community spreading ## By default, if there is no data on case_status - We'll consider this as active ## By default, if there is no data on gender - We'll put that under a separate Gender ## category marked as the "Other". This includes someone who doesn't want to identify ## his/her gender or wants to be part of LGBT community in a generic term. ## ## We'll transform our data accordingly based on the above logic. ##########################################################################################
df_2_Mod['ActiveCases'] = df_2_Mod.apply(lambda row: self.setDefaultActiveCases(row), axis=1)
df_2_Mod['ExposureStatus'] = df_2_Mod.apply(lambda row: self.setDefaultExposure(row), axis=1)
df_2_Mod['Gender'] = df_2_Mod.apply(lambda row: self.setGender(row), axis=1)
# Filtering all other records where we don't get any relevant information# Fetching Data for
df_3 = df_2_Mod[(df_2_Mod['age_group'] !='Not Reported')]
# Dropping unwanted columns
df_3.drop(columns=['exposure'], inplace=True)
df_3.drop(columns=['case_status'], inplace=True)
df_3.drop(columns=['date_reported'], inplace=True)
df_3.drop(columns=['gender'], inplace=True)
# Renaming one existing column
df_3.rename(columns={"age_group": "AgeGroup"}, inplace=True)
# Creating important feature# 0 - Deceased# 1 - Alive
df_3['Survived'] = df_3.apply(lambda row: self.setSurviveStatus(row), axis=1)
clog.logr('2.df_3'+ var +'.csv', Ind, df_3, subdir)
print()
print('Projecting Filter sample rows: ')
print(df_3.head())
print()
x_row_2 = df_3.shape[0]
x_col_2 = df_3.shape[1]
print('Total Number of Rows: ', x_row_2)
print('Total Number of columns: ', x_col_2)
# Let's do some basic checkings
sns.set_style('whitegrid')
#sns.countplot(x='Survived', hue='Gender', data=df_3, palette='RdBu_r')# Fixing Gender Column# This will check & indicate yellow for missing entries#sns.heatmap(df_3.isnull(), yticklabels=False, cbar=False, cmap='viridis')#sex = p.get_dummies(df_3['Gender'], drop_first=True)
sex = p.get_dummies(df_3['Gender'])
df_4 = p.concat([df_3, sex], axis=1)
print('After New addition of columns: ')
print(df_4.head())
clog.logr('3.df_4'+ var +'.csv', Ind, df_4, subdir)
# Dropping unwanted columns for our Machine Learning
df_4.drop(columns=['Gender'], inplace=True)
df_4.drop(columns=['ActiveCases'], inplace=True)
df_4.drop(columns=['Male','Other','Transgender'], inplace=True)
clog.logr('4.df_4_Mod'+ var +'.csv', Ind, df_4, subdir)
# Fixing Spread Columns
spread = p.get_dummies(df_4['ExposureStatus'], drop_first=True)
df_5 = p.concat([df_4, spread], axis=1)
print('After Spread columns:')
print(df_5.head())
clog.logr('5.df_5'+ var +'.csv', Ind, df_5, subdir)
# Dropping unwanted columns for our Machine Learning
df_5.drop(columns=['ExposureStatus'], inplace=True)
clog.logr('6.df_5_Mod'+ var +'.csv', Ind, df_5, subdir)
# Fixing Age Columns
df_5['Age'] = df_5.apply(lambda row: self.getAgeFromGroup(row), axis=1)
df_5.drop(columns=["AgeGroup"], inplace=True)
clog.logr('7.df_6'+ var +'.csv', Ind, df_5, subdir)
# Fixing Dummy Columns Name# Renaming one existing column Travel-Related with Travel_Related
df_5.rename(columns={"Travel-Related": "TravelRelated"}, inplace=True)
clog.logr('8.df_7'+ var +'.csv', Ind, df_5, subdir)
# Removing state for temporary basis
df_5.drop(columns=['State'], inplace=True)
# df_5.drop(columns=['State','Other','Transgender','Pending','TravelRelated','Male'], inplace=True)# Casting this entire dataframe into Integer# df_5_temp.apply(p.to_numeric)print('Info::')
print(df_5.info())
print("*"*60)
print(df_5.describe())
print("*"*60)
clog.logr('9.df_8'+ var +'.csv', Ind, df_5, subdir)
print('Intermediate Sample Dataframe for Age::')
print(df_5.head())
# Plotting it to Graphsns.jointplot(x="Age", y='Survived', data=df_5)
sns.jointplot(x="Age", y='Survived', data=df_5, kind='kde', color='red')
plt.xlabel("Age")
plt.ylabel("Data Point (0 - Died Vs 1 - Alive)")# Another check with Age Group
sns.countplot(x='Survived', hue='Age', data=df_5, palette='RdBu_r')
plt.xlabel("Survived(0 - Died Vs 1 - Alive)")
plt.ylabel("Total No Of Patient")
df_6 = df_5.drop(columns=['Survived'], axis=1)
clog.logr('10.df_9'+ var +'.csv', Ind, df_6, subdir)
# Train & Split Data
x_1 = df_6
y_1 = df_5['Survived']
# Now Train-Test Split of your source datafromsklearn.model_selectionimport train_test_split
# test_size => % of allocated data for your test cases# random_state => A specific set of random split on your data
X_train_1, X_test_1, Y_train_1, Y_test_1 = train_test_split(x_1, y_1, test_size=0.3, random_state=101)
# Importing Modelfromsklearn.linear_modelimport LogisticRegression
logmodel = LogisticRegression()
logmodel.fit(X_train_1, Y_train_1)
# Adding Predictions to it
predictions_1 = logmodel.predict(X_test_1)
fromsklearn.metricsimport classification_report
print('Classification Report:: ')
print(classification_report(Y_test_1, predictions_1))
fromsklearn.metricsimport confusion_matrix
print('Confusion Matrix:: ')
print(confusion_matrix(Y_test_1, predictions_1))
# This is require when you are trying to print from conventional# front & not using Jupyter notebook.
plt.show()
return0exceptExceptionas e:
x =str(e)
print('Error : ', x)
return1
Key snippets from the above script –
df_2_Mod['ActiveCases'] = df_2_Mod.apply(lambda row: self.setDefaultActiveCases(row), axis=1)df_2_Mod['ExposureStatus'] = df_2_Mod.apply(lambda row: self.setDefaultExposure(row), axis=1)df_2_Mod['Gender'] = df_2_Mod.apply(lambda row: self.setGender(row), axis=1)# Filtering all other records where we don't get any relevant information# Fetching Data fordf_3 = df_2_Mod[(df_2_Mod['age_group'] != 'Not Reported')]# Dropping unwanted columnsdf_3.drop(columns=['exposure'], inplace=True)df_3.drop(columns=['case_status'], inplace=True)df_3.drop(columns=['date_reported'], inplace=True)df_3.drop(columns=['gender'], inplace=True)# Renaming one existing columndf_3.rename(columns={"age_group": "AgeGroup"}, inplace=True)# Creating important feature# 0 - Deceased# 1 - Alivedf_3['Survived'] = df_3.apply(lambda row: self.setSurviveStatus(row), axis=1)
The above lines point to the critical transformation areas, where the application is invoking various essential business logic.
The above lines will transform the data into this –
As you can see, we’ve transformed the row values into columns with binary values. This kind of transformation is beneficial.
# Plotting it to Graphsns.jointplot(x="Age", y='Survived', data=df_5)sns.jointplot(x="Age", y='Survived', data=df_5, kind='kde', color='red')plt.xlabel("Age")plt.ylabel("Data Point (0 - Died Vs 1 - Alive)")# Another check with Age Groupsns.countplot(x='Survived', hue='Age', data=df_5, palette='RdBu_r')plt.xlabel("Survived(0 - Died Vs 1 - Alive)")plt.ylabel("Total No Of Patient")
The above lines will process the data & visualize based on that.
x_1 = df_6y_1 = df_5['Survived']
In the above snippet, we’ve assigned the features & target variable for our final logistic regression model.
# Now Train-Test Split of your source datafrom sklearn.model_selection import train_test_split# test_size => % of allocated data for your test cases# random_state => A specific set of random split on your dataX_train_1, X_test_1, Y_train_1, Y_test_1 = train_test_split(x_1, y_1, test_size=0.3, random_state=101)# Importing Modelfrom sklearn.linear_model import LogisticRegressionlogmodel = LogisticRegression()logmodel.fit(X_train_1, Y_train_1)
In the above snippet, we’re splitting the primary data & create a set of test & train data. Once we have the collection, the application will put the logistic regression model. And, finally, we’ll fit the training data.
The above lines, finally use the model & then we feed our test data.
Let’s see how it runs –
And, here is the log directory –
For better understanding, I’m just clubbing both the diagram at one place & the final outcome is showing as follows –
So, from the above picture, we can see that the maximum vulnerable patients are patients who are 80+. The next two categories that also suffered are 70+ & 60+.
Also, We’ve checked the Female Vs. Male in the following code –
sns.countplot(x='Survived', hue='Female', data=df_5, palette='RdBu_r')plt.xlabel("Survived(0 - Died Vs 1 - Alive)")plt.ylabel("Female Vs Male (Including Other Genders)")
And, the analysis represents through this –
In this case, you have to consider that the Male part includes all the other genders apart from the actual Male. Hence, I believe death for females would be more compared to people who identified themselves as males.
So, finally, we’ve done it.
During this challenging time, I would request you to follow strict health guidelines & stay healthy.
N.B.: All the data that are used here can be found in the public domain. We use this solely for educational purposes. You can find the details here.
Today, We’ll be exploring the potential business growth factor using the “Linear-Regression Machine Learning” model. We’ve prepared a set of dummy data & based on that, we’ll predict.
Let’s explore a few sample data –
So, based on these data, we would like to predict YearlyAmountSpent dependent on any one of the following features, i.e. [ Time On App / Time On Website / Flipkart Membership Duration (In Year) ].
You need to install the following packages –
pip install pandas
pip install matplotlib
pip install sklearn
We’ll be discussing only the main calling script & class script. However, we’ll be posting the parameters without discussing it. And, we won’t discuss clsL.py as we’ve already discussed that in our previous post.
1. clsConfig.py (This script contains all the parameter details.)
#################################################### Written By: SATYAKI DE ######## Written On: 15-May-2020 ######## ######## Objective: This script is a config ######## file, contains all the keys for ######## Machine-Learning. Application will ######## process these information & perform ######## various analysis on Linear-Regression. ####################################################importosimportplatformasplclassclsConfig(object):
Curr_Path = os.path.dirname(os.path.realpath(__file__))
os_det = pl.system()
if os_det =="Windows":
sep ='\\'else:
sep ='/'
config = {
'APP_ID': 1,
'ARCH_DIR': Curr_Path + sep +'arch'+ sep,
'PROFILE_PATH': Curr_Path + sep +'profile'+ sep,
'LOG_PATH': Curr_Path + sep +'log'+ sep,
'REPORT_PATH': Curr_Path + sep +'report',
'FILE_NAME': Curr_Path + sep +'Data'+ sep +'FlipkartCustomers.csv',
'SRC_PATH': Curr_Path + sep +'Data'+ sep,
'APP_DESC_1': 'IBM Watson Language Understand!',
'DEBUG_IND': 'N',
'INIT_PATH': Curr_Path
}
2. clsLinearRegression.py (This is the main script, which will invoke the Machine-Learning API & return 0 if successful.)
################################################## Written By: SATYAKI DE ######## Written On: 15-May-2020 ######## Modified On 15-May-2020 ######## ######## Objective: Main scripts for Linear ######## Regression. ##################################################importpandasaspimportnumpyasnpimportregexasreimportmatplotlib.pyplotaspltfromclsConfigimport clsConfig as cf
# %matplotlib inline -- for Jupyter NotebookclassclsLinearRegression:
def__init__(self):
self.fileName = cf.config['FILE_NAME']
defpredictResult(self):
try:
inputFileName =self.fileName
# Reading from Input File
df = p.read_csv(inputFileName)
print()
print('Projecting sample rows: ')
print(df.head())
print()
x_row = df.shape[0]
x_col = df.shape[1]
print('Total Number of Rows: ', x_row)
print('Total Number of columns: ', x_col)
# Adding Features
x = df[['TimeOnApp', 'TimeOnWebsite', 'FlipkartMembershipInYear']]
# Target Variable - Trying to predict
y = df['YearlyAmountSpent']
# Now Train-Test Split of your source datafromsklearn.model_selectionimport train_test_split
# test_size => % of allocated data for your test cases# random_state => A specific set of random split on your data
X_train, X_test, Y_train, Y_test = train_test_split(x, y, test_size=0.4, random_state=101)
# Importing Modelfromsklearn.linear_modelimport LinearRegression
# Creating an Instance
lm = LinearRegression()
# Train or Fit my model on Training Data
lm.fit(X_train, Y_train)
# Creating a prediction value
flipKartSalePrediction = lm.predict(X_test)
# Creating a scatter plot based on Actual Value & Predicted Value
plt.scatter(Y_test, flipKartSalePrediction)
# Adding meaningful Label
plt.xlabel('Actual Values')
plt.ylabel('Predicted Values')
# Checking Individual Metricsfromsklearnimport metrics
print()
mea_val = metrics.mean_absolute_error(Y_test, flipKartSalePrediction)
print('Mean Absolute Error (MEA): ', mea_val)
mse_val = metrics.mean_squared_error(Y_test, flipKartSalePrediction)
print('Mean Square Error (MSE): ', mse_val)
rmse_val = np.sqrt(metrics.mean_squared_error(Y_test, flipKartSalePrediction))
print('Square root Mean Square Error (RMSE): ', rmse_val)
print()
# Check Variance Score - R^2 Valueprint('Variance Score:')
var_score =str(round(metrics.explained_variance_score(Y_test, flipKartSalePrediction) *100, 2)).strip()
print('Our Model is', var_score, '% accurate. ')
print()
# Finding Coeficent on X_train.columnsprint()
print('Finding Coeficent: ')
cedf = p.DataFrame(lm.coef_, x.columns, columns=['Coefficient'])
print('Printing the All the Factors: ')
print(cedf)
print()
# Getting the Max Value from it
cedf['MaxFactorForBusiness'] = cedf['Coefficient'].max()
# Filtering the max Value to identify the biggest Business factor
dfMax = cedf[(cedf['MaxFactorForBusiness'] == cedf['Coefficient'])]
# Dropping the derived column
dfMax.drop(columns=['MaxFactorForBusiness'], inplace=True)
dfMax = dfMax.reset_index()
print(dfMax)
# Extracting Actual Business Factor from Pandas dataframe
str_factor_temp =str(dfMax.iloc[0]['index'])
str_factor = re.sub("([a-z])([A-Z])", "\g<1> \g<2>", str_factor_temp)
str_value =str(round(float(dfMax.iloc[0]['Coefficient']),2))
print()
print('*'*80)
print('Major Busienss Activity - (', str_factor, ') - ', str_value, '%')
print('*'*80)
print()
# This is require when you are trying to print from conventional# front & not using Jupyter notebook.
plt.show()
return0exceptExceptionas e:
x =str(e)
print('Error : ', x)
return1
Our application creating a subset of the main datagram, which contains all the features.
# Target Variable - Trying to predicty = df['YearlyAmountSpent']
Now, the application is setting the target variable into ‘Y.’
# Now Train-Test Split of your source datafrom sklearn.model_selection import train_test_split# test_size => % of allocated data for your test cases# random_state => A specific set of random split on your dataX_train, X_test, Y_train, Y_test = train_test_split(x, y, test_size=0.4, random_state=101)
As per “Supervised Learning,” our application is splitting the dataset into two subsets. One is to train the model & another segment is to test your final model. However, you can divide the data into three sets that include the performance statistics for a large dataset. In our case, we don’t need that as this data is significantly less.
# Train or Fit my model on Training Datalm.fit(X_train, Y_train)
Our application is now training/fit the data into the model.
# Creating a scatter plot based on Actual Value & Predicted Valueplt.scatter(Y_test, flipKartSalePrediction)
Our application projected the outcome based on the predicted data in a scatterplot graph.
Also, the following concepts captured by using our program. For more details, I’ve provided the external link for your reference –
Finally, extracting the coefficient to find out, which particular feature will lead Flikkart for better sale & growth by taking the maximum of coefficient value month the all features are as shown below –
cedf = p.DataFrame(lm.coef_, x.columns, columns=['Coefficient'])# Getting the Max Value from itcedf['MaxFactorForBusiness'] = cedf['Coefficient'].max()# Filtering the max Value to identify the biggest Business factordfMax = cedf[(cedf['MaxFactorForBusiness'] == cedf['Coefficient'])]# Dropping the derived columndfMax.drop(columns=['MaxFactorForBusiness'], inplace=True)dfMax = dfMax.reset_index()
Note that we’ve used a regular expression to split the camel-case column name from our feature & represent that with a much more meaningful name without changing the column name.
# Extracting Actual Business Factor from Pandas dataframestr_factor_temp = str(dfMax.iloc[0]['index'])str_factor = re.sub("([a-z])([A-Z])", "\g<1> \g<2>", str_factor_temp)str_value = str(round(float(dfMax.iloc[0]['Coefficient']),2))print('Major Busienss Activity - (', str_factor, ') - ', str_value, '%')
3. callLinear.py (This is the first calling script.)
################################################## Written By: SATYAKI DE ######## Written On: 15-May-2020 ######## Modified On 15-May-2020 ######## ######## Objective: Main calling scripts. ##################################################fromclsConfigimport clsConfig as cf
importclsLasclimportloggingimportdatetimeimportclsLinearRegressionascw# Disbling Warningdefwarn(*args, **kwargs):
passimportwarnings
warnings.warn = warn
# Lookup functions from# Azure cloud SQL DB
var = datetime.datetime.now().strftime("%Y-%m-%d_%H-%M-%S")
defmain():
try:
ret_1 =0
general_log_path =str(cf.config['LOG_PATH'])
# Enabling Logging Info
logging.basicConfig(filename=general_log_path +'MachineLearning_LinearRegression.log', level=logging.INFO)
# Initiating Log Class
l = cl.clsL()
# Moving previous day log files to archive directory
log_dir = cf.config['LOG_PATH']
curr_ver =datetime.datetime.now().strftime("%Y-%m-%d")
tmpR0 ="*"*157
logging.info(tmpR0)
tmpR9 ='Start Time: '+str(var)
logging.info(tmpR9)
logging.info(tmpR0)
print("Log Directory::", log_dir)
tmpR1 ='Log Directory::'+ log_dir
logging.info(tmpR1)
print('Machine Learning - Linear Regression Prediction : ')
print('-'*200)
# Create the instance of the Linear-Regression Class
x2 = cw.clsLinearRegression()
ret = x2.predictResult()
if ret ==0:
print('Successful Linear-Regression Prediction Generated!')
else:
print('Failed to generate Linear-Regression Prediction!')
print("-"*200)
print()
print('Finding Analysis points..')
print("*"*200)
logging.info('Finding Analysis points..')
logging.info(tmpR0)
tmpR10 ='End Time: '+str(var)
logging.info(tmpR10)
logging.info(tmpR0)
exceptValueErroras e:
print(str(e))
logging.info(str(e))
exceptExceptionas e:
print("Top level Error: args:{0}, message{1}".format(e.args, e.message))
if __name__ =="__main__":
main()
Key snippet from the above script –
# Create the instance of the Linear-Regressionx2 = cw.clsLinearRegression()ret = x2.predictResult()
In the above snippet, our application initially creating an instance of the main class & finally invokes the “predictResult” method.
Let’s run our application –
Step 1:
First, the application will fetch the following sample rows from our source file – if it is successful.
Step 2:
Then, It will create the following scatterplot by executing the following snippet –
# Creating a scatter plot based on Actual Value & Predicted Valueplt.scatter(Y_test, flipKartSalePrediction)
Note that our model is pretty accurate & it has a balanced success rate compared to our predicted numbers.
Step 3:
Finally, it is successfully able to project the critical feature are shown below –
From the above picture, you can see that our model is pretty accurate (89% approx).
Also, highlighted red square identifying the key-features & their confidence score & finally, the projecting the winner feature marked in green.
So, as per that, we’ve come to one conclusion that Flipkart’s business growth depends on the tenure of their subscriber, i.e., old members are prone to buy more than newer members.
Let’s look into our directory structure –
So, we’ve done it.
I’ll be posting another new post in the coming days. Till then, Happy Avenging! 😀
Note: All the data posted here are representational data & available over the internet & for educational purpose only.
Today, I’ll be discussing the following topic – “How to analyze text using IBM Watson implementing through Python.”
IBM has significantly improved in the field of Visual Image Analysis or Text language analysis using its IBM Watson cloud platform. In this particular topic, we’ll be exploring the natural languages only.
To access IBM API, we need to first create an IBM Cloud account from this site.
Let us quickly go through the steps to create the IBM Language Understanding service. Click the Catalog on top of your browser menu as shown in the below picture –
After that, click the AI option on your left-hand side of the panel marked in RED.
Click the Watson-Studio & later choose the plan. In our case, We’ll select the “Lite” option as IBM provided this platform for all the developers to explore their cloud for free.
Clicking the create option will lead to a blank page of Watson Studio as shown below –
And, now, we need to click the Get Started button to launch it. This will lead to Create Project page, which can be done using the following steps –
Now, clicking the create a project will lead you to the next screen –
You can choose either an empty project, or you can create it from a sample file. In this case, we’ll be selecting the first option & this will lead us to the below page –
And, then you will click the “Create” option, which will lead you to the next screen –
Now, you need to click “Add to Project.” This will give you a variety of services that you want to explore/use from the list. If you want to create your own natural language classifier, which you can do that as follows –
Once, you click it – you need to select the associate service –
Here, you need to click the hyperlink, which prompts to the next screen –
You need to check the price for both the Visual & Natural Language Classifier. They are pretty expensive. The visual classifier has the Lite plan. However, it has limitations of output.
Clicking the “Create” will prompt to the next screen –
After successful creation, you will be redirected to the following page –
Now, We’ll be adding our “Natural Language Understand” for our test –
This will prompt the next screen –
Once, it is successful. You will see the service registered as shown below –
If you click the service marked in RED, it will lead you to another page, where you will get the API Key & Url. You need both of this information in Python application to access this API as shown below –
Now, we’re ready with the necessary cloud set-up. After this, we need to install the Python package for IBM Cloud as shown below –
We’ve noticed that, recently, IBM has launched one upgraded package. Hence, we installed that one as well. I would recommend you to install this second package directly instead of the first one shown above –
Now, we’re done with our set-up.
Let’s see the directory structure –
We’ll be discussing only the main calling script & class script. However, we’ll be posting the parameters without discussing it. And, we won’t discuss clsL.py as we’ve already discussed that in our previous post.
1. clsConfig.py (This script contains all the parameter details.)
################################################## Written By: SATYAKI DE ######## Written On: 04-Apr-2020 ######## ######## Objective: This script is a config ######## file, contains all the keys for ######## IBM Cloud API. Application will ######## process these information & perform ######## various analysis on IBM Watson cloud.##################################################importosimportplatformasplclassclsConfig(object):
Curr_Path = os.path.dirname(os.path.realpath(__file__))
os_det = pl.system()
if os_det =="Windows":
sep ='\\'else:
sep ='/'
config = {
'APP_ID': 1,
'SERVICE_URL': "https://api.eu-gb.natural-language-understanding.watson.cloud.ibm.com/instances/xxxxxxxxxxxxxxXXXXXXXXXXxxxxxxxxxxxxxxxx",
'API_KEY': "Xxxxxxxxxxxxxkdkdfifd984djddkkdkdkdsSSdkdkdd",
'API_TYPE': "application/json",
'CACHE': "no-cache",
'CON': "keep-alive",
'ARCH_DIR': Curr_Path + sep +'arch'+ sep,
'PROFILE_PATH': Curr_Path + sep +'profile'+ sep,
'LOG_PATH': Curr_Path + sep +'log'+ sep,
'REPORT_PATH': Curr_Path + sep +'report',
'SRC_PATH': Curr_Path + sep +'Src_File'+ sep,
'APP_DESC_1': 'IBM Watson Language Understand!',
'DEBUG_IND': 'N',
'INIT_PATH': Curr_Path
}
Note that you will be placing your API_KEY & URL here, as shown in the configuration file.
2. clsIBMWatson.py (This is the main script, which will invoke the IBM Watson API based on the input from the user & return 0 if successful.)
################################################## Written By: SATYAKI DE ######## Written On: 04-Apr-2020 ######## Modified On 04-Apr-2020 ######## ######## Objective: Main scripts to invoke ######## IBM Watson Language Understand API. ##################################################importloggingfromclsConfigimport clsConfig as cf
importclsLasclimportjsonfromibm_watsonimport NaturalLanguageUnderstandingV1
fromibm_cloud_sdk_core.authenticatorsimport IAMAuthenticator
fromibm_watson.natural_language_understanding_v1import Features, EntitiesOptions, KeywordsOptions, SentimentOptions, CategoriesOptions, ConceptsOptions
fromibm_watsonimport ApiException
classclsIBMWatson:
def__init__(self):
self.api_key = cf.config['API_KEY']
self.service_url = cf.config['SERVICE_URL']
defcalculateExpressionFromUrl(self, inputUrl, inputVersion):
try:
api_key =self.api_key
service_url =self.service_url
print('-'*60)
print('Beginning of the IBM Watson for Input Url.')
print('-'*60)
authenticator = IAMAuthenticator(api_key)
# Authentication via service credentials provided in our config files
service = NaturalLanguageUnderstandingV1(version=inputVersion, authenticator=authenticator)
service.set_service_url(service_url)
response = service.analyze(
url=inputUrl,
features=Features(entities=EntitiesOptions(),
sentiment=SentimentOptions(),
concepts=ConceptsOptions())).get_result()
print(json.dumps(response, indent=2))
return0except ApiException as ex:
print('-'*60)
print("Method failed for Url with status code "+str(ex.code) +": "+ ex.message)
print('-'*60)
return1defcalculateExpressionFromText(self, inputText, inputVersion):
try:
api_key =self.api_key
service_url =self.service_url
print('-'*60)
print('Beginning of the IBM Watson for Input Url.')
print('-'*60)
authenticator = IAMAuthenticator(api_key)
# Authentication via service credentials provided in our config files
service = NaturalLanguageUnderstandingV1(version=inputVersion, authenticator=authenticator)
service.set_service_url(service_url)
response = service.analyze(
text=inputText,
features=Features(entities=EntitiesOptions(),
sentiment=SentimentOptions(),
concepts=ConceptsOptions())).get_result()
print(json.dumps(response, indent=2))
return0except ApiException as ex:
print('-'*60)
print("Method failed for Url with status code "+str(ex.code) +": "+ ex.message)
print('-'*60)
return1
Some of the key lines from the above snippet –
authenticator = IAMAuthenticator(api_key)# Authentication via service credentials provided in our config filesservice = NaturalLanguageUnderstandingV1(version=inputVersion, authenticator=authenticator)service.set_service_url(service_url)
By providing the API Key & Url, the application is initiating the service for Watson.
Based on your type of input, it will bring the features of entities, sentiment & concepts here. Apart from that, you can additionally check the following features as well – Keywords & Categories.
3. callIBMWatsonAPI.py (This is the first calling script. Based on user choice, it will receive input either as Url or as the plain text & then analyze it.)
################################################## Written By: SATYAKI DE ######## Written On: 04-Apr-2020 ######## Modified On 04-Apr-2020 ######## ######## Objective: Main calling scripts. ##################################################fromclsConfigimport clsConfig as cf
importclsLasclimportloggingimportdatetimeimportclsIBMWatsonascw# Disbling Warningdefwarn(*args, **kwargs):
passimportwarnings
warnings.warn = warn
# Lookup functions from# Azure cloud SQL DB
var = datetime.datetime.now().strftime("%Y-%m-%d_%H-%M-%S")
defmain():
try:
ret_1 =0
general_log_path =str(cf.config['LOG_PATH'])
# Enabling Logging Info
logging.basicConfig(filename=general_log_path +'IBMWatson_NaturalLanguageAnalysis.log', level=logging.INFO)
# Initiating Log Class
l = cl.clsL()
# Moving previous day log files to archive directory
log_dir = cf.config['LOG_PATH']
curr_ver =datetime.datetime.now().strftime("%Y-%m-%d")
tmpR0 ="*"*157
logging.info(tmpR0)
tmpR9 ='Start Time: '+str(var)
logging.info(tmpR9)
logging.info(tmpR0)
print("Log Directory::", log_dir)
tmpR1 ='Log Directory::'+ log_dir
logging.info(tmpR1)
print('Welcome to IBM Wantson Language Understanding Calling Program: ')
print('-'*60)
print('Please Press 1 for Understand the language from Url.')
print('Please Press 2 for Understand the language from your input-text.')
input_choice =int(input('Please provide your choice:'))
# Create the instance of the IBM Watson Class
x2 = cw.clsIBMWatson()
# Let's pass this to our map sectionif input_choice ==1:
textUrl =str(input('Please provide the complete input url:'))
ret_1 = x2.calculateExpressionFromUrl(textUrl, curr_ver)
elif input_choice ==2:
inputText =str(input('Please provide the input text:'))
ret_1 = x2.calculateExpressionFromText(inputText, curr_ver)
else:
print('Invalid options!')
if ret_1 ==0:
print('Successful IBM Watson Language Understanding Generated!')
else:
print('Failed to generate IBM Watson Language Understanding!')
print("-"*60)
print()
print('Finding Analysis points..')
print("*"*157)
logging.info('Finding Analysis points..')
logging.info(tmpR0)
tmpR10 ='End Time: '+str(var)
logging.info(tmpR10)
logging.info(tmpR0)
exceptValueErroras e:
print(str(e))
print("Invalid option!")
logging.info("Invalid option!")
exceptExceptionas e:
print("Top level Error: args:{0}, message{1}".format(e.args, e.message))
if __name__ =="__main__":
main()
This script is pretty straight forward as it is first creating an instance of the main class & then based on the user input, it is calling the respective functions here.
As of now, IBM Watson can work on a list of languages, which are available here.
If you want to start from scratch, please refer to the following link.
Please find the screenshot of our application run –
Case 1 (With Url):
Case 2 (With Plain text):
Now, Don’t forget to delete all the services from your IBM Cloud.
As you can see, from the service, you need to delete all the services one-by-one as shown in the figure.
So, we’ve done it.
To explore my photography, you can visit the following link.
I’ll be posting another new post in the coming days. Till then, Happy Avenging! 😀
Note: All the data posted here are representational data & available over the internet & for educational purpose only.
Today, We’ll be discussing one more graphical package in Python, which is also known as PyQt. To faster design the GUI, we’ll be exploring another tool called Qt Designer, which is available for multiple OS platforms.
This is similar to any other GUI based IDE like Microsoft Visual Studio, where you can quickly generate your GUI template.
The majority of the internet post talks about using PyQt5 or PyQt4 packages. But, when speaking about using the .ui file inside your Python code – they either demonstrate fundamental options without any event or, they convert & generate the .ui file into .py file & then they use it. This certainly not making it very useful for many of the developers who are trying to use it for the first time. Hence, My main goal is to use the .ui file inside my Python script as it is & use all the components out of it & assign various working events.
In this post, we’ll discuss only with one script & then we’ll showcase the output in the form of video (No audio). You can verify the output for both MAC & Windows.
Before we start, let us check the directory structure between Windows & MAC –
Let us explore how the GUI should look like ->
So, as you can see that this tool is like any other GUI based tool, basically you can create anything by simply drag & drop method.
Before we start discussing our code, here is the sample basicAdv.ui file for your reference.
You need to install the following framework –
pip install PyQt5
1. GUIPyQt5.py (This script contains all the GUI details & it will invoke the instance along with the logic.)
################################################## Written By: SATYAKI DE ######## Written On: 12-Mar-2020 ######## Modified On 12-Mar-2020 ######## ######## Objective: Main calling scripts. ##################################################fromPyQt5import QtWidgets, uic, QtGui, QtCore
fromPyQt5.QtWidgetsimport*importsysclassUi(QtWidgets.QMainWindow):
def__init__(self):
# Instantiating the main classsuper(Ui, self).__init__()
# Loading the Graphical Design without# converting it to any kind of Python code
uic.loadUi('basicAdv.ui', self)
# Adding all the essential buttonsself.prtBtn =self.findChild(QtWidgets.QPushButton, 'prtBtn') # Find the buttonself.prtBtn.clicked.connect(self.printButtonClick) # Remember to pass the definition/method, not the return value!self.clrBtn =self.findChild(QtWidgets.QPushButton, 'clrBtn') # Find the buttonself.clrBtn.clicked.connect(self.clearButtonClick) # Remember to pass the definition/method, not the return value!self.addBtn =self.findChild(QtWidgets.QPushButton, 'addBtn') # Find the buttonself.addBtn.clicked.connect(self.addItem) # Remember to pass the definition/method, not the return value!self.selectImgBtn =self.findChild(QtWidgets.QPushButton, 'selectImgBtn') # Find the buttonself.selectImgBtn.clicked.connect(self.setImage) # Remember to pass the definition/method, not the return value!self.cnfBtn =self.findChild(QtWidgets.QPushButton, 'cnfBtn') # Find the buttonself.cnfBtn.clicked.connect(self.showDialog) # Remember to pass the definition/method, not the return value!# Adding other static input/output elementsself.input =self.findChild(QtWidgets.QLineEdit, 'input')
self.qlabel =self.findChild(QtWidgets.QLabel, 'qlabel')
self.lineEdit =self.findChild(QtWidgets.QLineEdit, 'lineEdit')
self.listWidget =self.findChild(QtWidgets.QListWidget, 'listWidget')
self.imageLbl =self.findChild(QtWidgets.QLabel, 'imageLbl')
# Adding Comboboxself.combo =self.findChild(QtWidgets.QComboBox, 'sComboBox') # Find the ComboBox# Adding static element to itself.combo.addItem("Sourav Ganguly")
self.combo.addItem("Kapil Dev")
self.combo.addItem("Sunil Gavaskar")
self.combo.addItem("M. S. Dhoni")
# Click Eventself.combo.activated[str].connect(self.onChanged) # Remember to pass the definition/method, not the return value!# Adding list Boxself.listwidget2 =self.findChild(QtWidgets.QListWidget, 'listwidget2') # Find the List# Adding static element to itself.listwidget2.insertItem(0, "Aamir Khan")
self.listwidget2.insertItem(1, "Shahruk Khan")
self.listwidget2.insertItem(2, "Salman Khan")
self.listwidget2.insertItem(3, "Hrittik Roshon")
self.listwidget2.insertItem(4, "Amitabh Bachhan")
# Click Eventself.listwidget2.clicked.connect(self.showIndividualElement)
# Adding Group Boxself.groupBox =self.findChild(QtWidgets.QGroupBox, 'groupBox') # Find the ComboBoxself.groupBox.setCheckable(True)
# Adding Individual Radio Buttonself.rdButton1 =self.findChild(QtWidgets.QRadioButton, 'rdButton1') # Find the buttonself.rdButton1.setChecked(True)
self.rdButton1.toggled.connect(lambda: self.printRadioButtonClick(self.rdButton1)) # Remember to pass the definition/method, not the return value!self.rdButton2 =self.findChild(QtWidgets.QRadioButton, 'rdButton2') # Find the buttonself.rdButton2.toggled.connect(lambda: self.printRadioButtonClick(self.rdButton2)) # Remember to pass the definition/method, not the return value!self.rdButton3 =self.findChild(QtWidgets.QRadioButton, 'rdButton3') # Find the buttonself.rdButton3.toggled.connect(lambda: self.printRadioButtonClick(self.rdButton3)) # Remember to pass the definition/method, not the return value!self.rdButton4 =self.findChild(QtWidgets.QRadioButton, 'rdButton4') # Find the buttonself.rdButton4.toggled.connect(lambda: self.printRadioButtonClick(self.rdButton4)) # Remember to pass the definition/method, not the return value!self.show()
defprintRadioButtonClick(self, radioOption):
if radioOption.text() =='China':
if radioOption.isChecked() ==True:
print(radioOption.text() +' is selected')
else:
print(radioOption.text() +' is deselected')
if radioOption.text() =='India':
if radioOption.isChecked() ==True:
print(radioOption.text() +' is selected')
else:
print(radioOption.text() +' is deselected')
if radioOption.text() =='Japan':
if radioOption.isChecked() ==True:
print(radioOption.text() +' is selected')
else:
print(radioOption.text() +' is deselected')
if radioOption.text() =='France':
if radioOption.isChecked() ==True:
print(radioOption.text() +' is selected')
else:
print(radioOption.text() +' is deselected')
defprintButtonClick(self):
# This is executed when the button is pressedprint('Input text:'+self.input.text())
defclearButtonClick(self):
# This is executed when the button is pressedself.input.clear()
defonChanged(self, text):
self.qlabel.setText(text)
self.qlabel.adjustSize()
self.lineEdit.clear() # Clear the textdefaddItem(self):
value =self.lineEdit.text() # Get the value of the lineEditself.lineEdit.clear() # Clear the textself.listWidget.addItem(value) # Add the value we got to the listdefsetImage(self):
fileName, _ = QtWidgets.QFileDialog.getOpenFileName(None, "Select Image", "", "Image Files (*.png *.jpg *jpeg *.bmp);;All Files (*)") # Ask for fileif fileName: # If the user gives a file
pixmap = QtGui.QPixmap(fileName) # Setup pixmap with the provided image
pixmap = pixmap.scaled(self.imageLbl.width(), self.imageLbl.height(), QtCore.Qt.KeepAspectRatio) # Scale pixmapself.imageLbl.setPixmap(pixmap) # Set the pixmap onto the labelself.imageLbl.setAlignment(QtCore.Qt.AlignCenter) # Align the label to centerdefshowDialog(self):
msgBox = QMessageBox()
msgBox.setIcon(QMessageBox.Information)
msgBox.setText("Message box pop up window")
msgBox.setWindowTitle("MessageBox Example")
msgBox.setStandardButtons(QMessageBox.Ok | QMessageBox.Cancel)
msgBox.buttonClicked.connect(self.msgButtonClick)
returnValue = msgBox.exec()
if returnValue == QMessageBox.Ok:
print('OK clicked')
defmsgButtonClick(self, i):
print("Button clicked is:", i.text())
defshowIndividualElement(self, qmodelindex):
item =self.listwidget2.currentItem()
print(item.text())
if __name__ =="__main__":
importsys
app = QtWidgets.QApplication(sys.argv)
window = Ui()
window.show()
sys.exit(app.exec_())
Let us explore a few key lines from this script. Rests are almost identical.
# Loading the Graphical Design without# converting it to any kind of Python codeuic.loadUi('basicAdv.ui', self)
Loading the GUI created using Qt Designer into the Python environment.
# Adding all the essential buttonsself.prtBtn = self.findChild(QtWidgets.QPushButton, 'prtBtn') # Find the buttonself.prtBtn.clicked.connect(self.printButtonClick) # Remember to pass the definition/method, not the return value!
In this case, we’re dynamically binding the component from the GUI by using the findChild method & then on the next line, we’re invoking the appropriate event associated with that. In this case, it is – self.printButtonClick.
The printButtonClick as mentioned earlier is a method & that contains the following snippet –
def printButtonClick(self): # This is executed when the button is pressed print('Input text:' + self.input.text())
As you can see, this event will capture the text from the input textbox & print it on our terminal.
Here is the snippet for those widgets, which is part of only input/output & they generally don’t have an event of their own. But, we need to bind them with our Python application.
Group Box, along with the radio button, works slightly different than our drop-down list.
For each radio button, we’ll have a dedicated text value that represents a different country in this context.
And, our application will bind all the radio button & then they will use one standard method for all of these four options as shown below –
# Adding Individual Radio Buttonself.rdButton1 = self.findChild(QtWidgets.QRadioButton, 'rdButton1') # Find the buttonself.rdButton1.setChecked(True)self.rdButton1.toggled.connect(lambda: self.printRadioButtonClick(self.rdButton1)) # Remember to pass the definition/method, not the return value!self.rdButton2 = self.findChild(QtWidgets.QRadioButton, 'rdButton2') # Find the buttonself.rdButton2.toggled.connect(lambda: self.printRadioButtonClick(self.rdButton2)) # Remember to pass the definition/method, not the return value!self.rdButton3 = self.findChild(QtWidgets.QRadioButton, 'rdButton3') # Find the buttonself.rdButton3.toggled.connect(lambda: self.printRadioButtonClick(self.rdButton3)) # Remember to pass the definition/method, not the return value!self.rdButton4 = self.findChild(QtWidgets.QRadioButton, 'rdButton4') # Find the buttonself.rdButton4.toggled.connect(lambda: self.printRadioButtonClick(self.rdButton4)) # Remember to pass the definition/method, not the return value!
Also, note that, by default, rdButton1 is set to True i.e., it will be selected when the form load initially.
Let’s explore the printRadioButtonClick event.
def printRadioButtonClick(self, radioOption): if radioOption.text() == 'China': if radioOption.isChecked() == True: print(radioOption.text() + ' is selected') else: print(radioOption.text() + ' is deselected') if radioOption.text() == 'India': if radioOption.isChecked() == True: print(radioOption.text() + ' is selected') else: print(radioOption.text() + ' is deselected') if radioOption.text() == 'Japan': if radioOption.isChecked() == True: print(radioOption.text() + ' is selected') else: print(radioOption.text() + ' is deselected') if radioOption.text() == 'France': if radioOption.isChecked() == True: print(radioOption.text() + ' is selected') else: print(radioOption.text() + ' is deselected')
This will capture the radio button option & based on the currently clicked button, it will fetch the text out of it. Finally, that will match with the logic here & based on that, our application will display the output.
Finally, the Image process is slightly different.
Initially, our application will load the component from the .ui file & bind them with the Python environment –
Image load option will only work when the user clicks the button that triggers the following sets of actions –
self.selectImgBtn = self.findChild(QtWidgets.QPushButton, 'selectImgBtn') # Find the buttonself.selectImgBtn.clicked.connect(self.setImage) # Remember to pass the definition/method, not the return value!
Let’s explore the setImage method –
def setImage(self): fileName, _ = QtWidgets.QFileDialog.getOpenFileName(None, "Select Image", "", "Image Files (*.png *.jpg *jpeg *.bmp);;All Files (*)") # Ask for file if fileName: # If the user gives a file pixmap = QtGui.QPixmap(fileName) # Setup pixmap with the provided image pixmap = pixmap.scaled(self.imageLbl.width(), self.imageLbl.height(), QtCore.Qt.KeepAspectRatio) # Scale pixmap self.imageLbl.setPixmap(pixmap) # Set the pixmap onto the label self.imageLbl.setAlignment(QtCore.Qt.AlignCenter) # Align the label to center
This will prompt the corresponding dialogue box for choosing the right images out of the respective O/S.
Last but not least, the use of MsgBox, which can be extremely useful for many GUI based programming.
This msgbox doesn’t exist in the form. However, we’re creating it on the event of the “Confirm Button” as shown below –
self.cnfBtn = self.findChild(QtWidgets.QPushButton, 'cnfBtn') # Find the buttonself.cnfBtn.clicked.connect(self.showDialog) # Remember to pass the definition/method, not the return value!
This will prompt the showDialog method to trigger –
def showDialog(self): msgBox = QMessageBox() msgBox.setIcon(QMessageBox.Information) msgBox.setText("Message box pop up window") msgBox.setWindowTitle("MessageBox Example") msgBox.setStandardButtons(QMessageBox.Ok | QMessageBox.Cancel) msgBox.buttonClicked.connect(self.msgButtonClick) returnValue = msgBox.exec() if returnValue == QMessageBox.Ok: print('OK clicked')
And, based on your options (“OK”/”Cancel”), it will prompt the final captured message in your console.
Let’s explore the videos of output from Windows O/S –
Let’s explore the video output from MAC VM –
For more information on this package – please check the following link.
So, as you can see, finally we’ve achieved it. We’ve demonstrated cross-platform GUI applications using native Python. And, here we didn’t even convert the ui design file to python script either.
Please share your feedback.
I’ll be posting another new post in the coming days. Till then, Happy Avenging! 😀
Note: All the data posted here are representational data & available over the internet & for educational purpose only.
Today, I’ll explain a relatively new GUI framework with which you can create native mobile applications across all the different platforms. Note that this framework is still in the preview phase on many fronts. And you also can contribute here in many ways.
Let’s jump into making a chat application using this. It is relatively easy to build.
You need to install the following framework –
pip install beeware==0.3.0.dev3
As I’ve told you that this package is in the preview stage. So, you need to wait for few more days to get this package available for production use.
However, the following diagram presented in Pycon explains that all –
Let’s jump into our objective.
To create the project, the following are steps that need to perform –
Functions that you need to use –
briefcase new
This will lead to several options that you need to fill as shown in the next couple of slides –
Note that, this one I’ve created in the Windows environment. So, you need to provide all these details before creating the app.
This will create a template of code as shown below –
"""Chat with my friends"""importtogafromtoga.styleimport Pack
fromtoga.style.packimport COLUMN, ROW
classSDApp(toga.App):
defstartup(self):
""" Construct and show the Toga application. Usually, you would add your application to a main content box. We then create a main window (with a name matching the app), and show the main window. """
main_box = toga.Box()
self.main_window = toga.MainWindow(title=self.formal_name)
self.main_window.content = main_box
self.main_window.show()
defmain():
return SDApp()
And, you can run this template to see the default template output by using the following command –
briefcase dev
Now, I want to take this & add some lines of codes to create a chat-based application in MAC & see how it behaves.
But, before that, the directory structure will look like this –
As you can see, SDChat is my application name. And, based on that, the following directories.
And, inside the final SDChat directory, the following files are created –
__init__.py
__main__.py
app.py
Let’s take this & modify it for MAC. To do that, we need to change app.py script & layout our all the essential GUI ingredients.
Note that I’m not going to discuss the custom bot that I created. Only, I’ll be referring to it.
1. app.py (This script contains all the GUI details & it will invoke the custom bot.)
################################################## Written By: SATYAKI DE ######## Written On: 17-Feb-2020 ######## Modified On 17-Feb-2020 ######## ######## Objective: Main calling scripts. ##################################################"""This is a Chat Application with custom made bot"""importtogafromtoga.styleimport Pack
fromtoga.style.packimport COLUMN, ROW
# My Custom Built BotfromSDChatbotsimport clsTalk2Bot as e
#-- NewclassSDChat(toga.App):
defstartup(self):
""" Construct and show the Toga application. Usually, you would add your application to a main content box. We then create a main window (with a name matching the app), and show the main window. """self.chat = toga.DetailedList(data=[], style=Pack(flex=1))
self.chat.data.append(icon = toga.Icon('resources/brutus.png'), title='SDChat', subtitle='Hi! How are you doing today?')
self.text_input = toga.TextInput(style=Pack(flex=1))
#send_button = toga.Button('Send')
send_button = toga.Button(
'Send',
on_press=self.greet,
style=Pack(padding_right=5)
)
input_box = toga.Box(
children=[self.text_input, send_button],
style=Pack(direction=ROW, alignment='center', padding=5)
)
main_box = toga.Box(children=[self.chat, input_box], style=Pack(direction=COLUMN))
# main_box.add(send_button)self.main_window = toga.MainWindow(title=self.formal_name)
self.main_window.content = main_box
self.main_window.show()
defgreet(self, widget):
print('Value: ', self.text_input.value)
input_text =self.text_input.value
self.chat.data.append(icon=toga.Icon('resources/user.png'), title='You', subtitle = input_text)
# Chatbot
y = e.clsTalk2Bot()
ret_val = y.TalkNow(input_text)
self.chat.data.append(icon=toga.Icon('resources/brutus.png'), title='SDChat', subtitle=ret_val)
self.text_input.value =''self.chat.scroll_to_bottom()
defmain():
return SDChat()
Let’s discuss a couple of essential lines from the above snippet –
self.chat = toga.DetailedList(data=[], style=Pack(flex=1))self.chat.data.append(icon = toga.Icon('resources/brutus.png'), title='SDChat', subtitle='Hi! How are you doing today?')
This is the main display box, where you can see all the chat details. And, also, by default, it will prompt the initial conversion starter.
Here is the button that you are creating. As you can see, almost all the places I’ve provided the “Style,” which is key to your object alignment inside your mobile app.
As you can see, here, our application will capture the user input & based on that, our program will pass the input text to our chatbot. Also, you can see once that communication & response achieved, the input box will be cleared & the control will move down to the end of the chat screen. This is required. Otherwise, the user won’t be able to view the latest communication.
So, as you can see that, this extremely easy to create & you can enhance it as per your need.
For more information on this framework, please go through the following link ->
Today, I’ll be presenting a different kind of post here. I’ll be trying to predict health issues for senior citizens based on “realtime weather data” by blending open-source population data using some mock risk factor calculation. At the end of the post, I’ll be plotting these numbers into some graphs for better understanding.
Let’s drive!
For this first, we need realtime weather data. To do that, we need to subscribe to the data from OpenWeather API. For that, you have to register as a developer & you’ll receive a similar email from them once they have approved –
So, from the above picture, you can see that, you’ll be provided one API key & also offered a couple of useful API documentation. I would recommend exploring all the links before you try to use it.
You can also view your API key once you logged into their console. You can also create multiple API keys & the screen should look something like this –
For security reasons, I’ll be hiding my own keys & the same should be applicable for you as well.
I would say many of these free APIs might have some issues. So, I would recommend you to start testing the open API through postman before you jump into the Python development. Here is the glimpse of my test through the postman –
Once, I can see that the API is returning the result. I can work on it.
Apart from that, one needs to understand that these API might have limited use & also you need to know the consequences in terms of price & tier in case if you exceeded the limit. Here is the detail for this API –
For our demo, I’ll be using the Free tire only.
Let’s look into our other source data. We got the top 10 city population-wise over there internet. Also, we have collected sample Senior Citizen percentage against sex ratio across those cities. We have masked these values on top of that as this is just for education purposes.
1. CityDetails.csv
Here is the glimpse of this file –
So, this file only contains the total population across the top 10 cities in the USA.
2. SeniorCitizen.csv
This file contains the Sex ratio of Senior citizens across those top 10 cities by population.
Again, we are not going to discuss any script, which we’ve already discussed here.
Hence, we’re skipping clsL.py here.
1. clsConfig.py (This script contains all the parameters of the server.)
In the above snippet, our application first preparing the payload & the parameters received from our param script. And then invoke the GET method to extract the real-time data in the form of JSON & finally sending the JSON payload to the primary calling function.
3. clsMap.py (This script contains the main logic to prepare the MAP using seaborn package & try to plot our custom made risk factor by blending the realtime data with our statistical data received over the internet.)
################################################## Written By: SATYAKI DE ######## Written On: 19-Jan-2020 ######## Modified On 19-Jan-2020 ######## ######## Objective: Main scripts to invoke ######## plot into the Map. ##################################################importseabornassnsimportloggingfromclsConfigimport clsConfig as cf
importpandasaspimportclsLascl# This library requires later# to print the chartimportmatplotlib.pyplotaspltclassclsMap:
def__init__(self):
self.src_file = cf.config['SRC_FILE_1']
defcalculateRisk(self, row):
try:
# Let's assume some logic# 1. By default, 30% of Senior Citizen# prone to health Issue for each City# 2. Male Senior Citizen is 19% more prone# to illness than female.# 3. If humidity more than 70% or less# than 40% are 22% main cause of illness# 4. If feels like more than 280 or# less than 260 degree are 17% more prone# to illness.# Finally, this will be calculated per 1K# people around 10 blocks
str_sex =str(row['Sex'])
int_humidity =int(row['humidity'])
int_feelsLike =int(row['feels_like'])
int_population =int(str(row['Population']).replace(',',''))
float_srcitizen =float(row['SeniorCitizen'])
confidance_score =0.0
SeniorCitizenPopulation = (int_population * float_srcitizen)
if str_sex =='Male':
confidance_score = (SeniorCitizenPopulation *0.30*0.19) + confidance_score
else:
confidance_score = (SeniorCitizenPopulation *0.30*0.11) + confidance_score
if ((int_humidity >70) | (int_humidity <40)):
confidance_score = confidance_score + (int_population *0.30* float_srcitizen) *0.22if ((int_feelsLike >280) | (int_feelsLike <260)):
confidance_score = confidance_score + (int_population *0.30* float_srcitizen) *0.17
final_score =round(round(confidance_score, 2) / (1000*10), 2)
return final_score
exceptExceptionas e:
x =str(e)
return x
defsetMap(self, dfInput):
try:
resVal =0
df = p.DataFrame()
debug_ind ='Y'
src_file =self.src_file
# Initiating Log Class
l = cl.clsL()
df = dfInput
# Creating a subset of desired columns
dfMod = df[['CityName', 'temp', 'Population', 'humidity', 'feels_like']]
l.logr('5.dfSuppliment.csv', debug_ind, dfMod, 'log')
# Fetching Senior Citizen Data
df = p.read_csv(src_file, index_col=False)
# Merging two frames
dfMerge = p.merge(df, dfMod, on=['CityName'])
l.logr('6.dfMerge.csv', debug_ind, dfMerge, 'log')
# Getting RiskFactor quotient from our custom made logic
dfMerge['RiskFactor'] = dfMerge.apply(lambda row: self.calculateRisk(row), axis=1)
l.logr('7.dfRiskFactor.csv', debug_ind, dfMerge, 'log')
# Generating Map plotss# sns.lmplot(x='RiskFactor', y='SeniorCitizen', data=dfMerge, hue='Sex')# sns.lmplot(x='RiskFactor', y='SeniorCitizen', data=dfMerge, hue='Sex', markers=['o','v'], scatter_kws={'s':25})
sns.lmplot(x='RiskFactor', y='SeniorCitizen', data=dfMerge, col='Sex')
# This is required when you are running# through normal Python & not through# Jupyter Notebook
plt.show()
return resVal
exceptExceptionas e:
x =str(e)
print(x)
logging.info(x)
resVal = x
return resVal
Key lines from the above codebase –
# Creating a subset of desired columnsdfMod = df[['CityName', 'temp', 'Population', 'humidity', 'feels_like']]l.logr('5.dfSuppliment.csv', debug_ind, dfMod, 'log')# Fetching Senior Citizen Datadf = p.read_csv(src_file, index_col=False)# Merging two framesdfMerge = p.merge(df, dfMod, on=['CityName'])l.logr('6.dfMerge.csv', debug_ind, dfMerge, 'log')# Getting RiskFactor quotient from our custom made logicdfMerge['RiskFactor'] = dfMerge.apply(lambda row: self.calculateRisk(row), axis=1)l.logr('7.dfRiskFactor.csv', debug_ind, dfMerge, 'log')
Combining our Senior Citizen data with already processed data coming from our primary calling script. Also, here the application is calculating our custom logic to find out the risk factor figures. If you want to go through that, I’ve provided the logic to derive it. However, this is just a demo to find out similar figures. You should not rely on the logic that I’ve used (It is kind of my observation of life till now. :D).
The below lines are only required when you are running seaborn, not via Jupyter notebook.
plt.show()
4. callOpenMapWeatherAPI.py (This is the first calling script. This script also calls the realtime API & then blend the first file with it & pass the only relevant columns of data to our Map script to produce the graph.)
################################################## Written By: SATYAKI DE ######## Written On: 19-Jan-2020 ######## Modified On 19-Jan-2020 ######## ######## Objective: Main calling scripts. ##################################################fromclsConfigimport clsConfig as cf
importpandasaspimportclsLasclimportloggingimportdatetimeimportjsonimportclsWeatherasctimportreimportnumpyasnpimportclsMapascm# Disbling Warningdefwarn(*args, **kwargs):
passimportwarnings
warnings.warn = warn
# Lookup functions from# Azure cloud SQL DB
var = datetime.datetime.now().strftime("%Y-%m-%d_%H-%M-%S")
defgetMainWeather(row):
try:
# Using regular expression to fetch time part only
lkp_Columns =str(row['weather'])
jpayload =str(lkp_Columns).replace("'", '"')
#jpayload = json.dumps(lkp_Columns)
payload = json.loads(jpayload)
df_lkp = p.io.json.json_normalize(payload)
df_lkp.columns = df_lkp.columns.map(lambda x: x.split(".")[-1])
str_main_weather =str(df_lkp.iloc[0]['main'])
return str_main_weather
exceptExceptionas e:
x =str(e)
str_main_weather = x
return str_main_weather
defgetMainDescription(row):
try:
# Using regular expression to fetch time part only
lkp_Columns =str(row['weather'])
jpayload =str(lkp_Columns).replace("'", '"')
#jpayload = json.dumps(lkp_Columns)
payload = json.loads(jpayload)
df_lkp = p.io.json.json_normalize(payload)
df_lkp.columns = df_lkp.columns.map(lambda x: x.split(".")[-1])
str_description =str(df_lkp.iloc[0]['description'])
return str_description
exceptExceptionas e:
x =str(e)
str_description = x
return str_description
defmain():
try:
dfSrc = p.DataFrame()
df_ret = p.DataFrame()
ret_2 =''
debug_ind ='Y'
general_log_path =str(cf.config['LOG_PATH'])
# Enabling Logging Info
logging.basicConfig(filename=general_log_path +'consolidatedIR.log', level=logging.INFO)
# Initiating Log Class
l = cl.clsL()
# Moving previous day log files to archive directory
arch_dir = cf.config['ARCH_DIR']
log_dir = cf.config['LOG_PATH']
col_list = cf.config['COL_LIST']
col_list_1 = cf.config['COL_LIST_1']
col_list_2 = cf.config['COL_LIST_2']
tmpR0 ="*"*157
logging.info(tmpR0)
tmpR9 ='Start Time: '+str(var)
logging.info(tmpR9)
logging.info(tmpR0)
print("Archive Directory:: ", arch_dir)
print("Log Directory::", log_dir)
tmpR1 ='Log Directory::'+ log_dir
logging.info(tmpR1)
df2 = p.DataFrame()
src_file = cf.config['SRC_FILE']
# Fetching data from source file
df = p.read_csv(src_file, index_col=False)
# Creating a list of City Name from the source file
city_list = df['CityName'].tolist()
# Declaring an empty dictionary
merge_dict = {}
merge_dict['city'] = df2
start_pos =1
src_file_name ='1.'+ cf.config['SRC_FILE_INIT']
for i in city_list:
x1 = ct.clsWeather()
ret_2 = x1.searchQry(i)
# Capturing the JSON Payload
res = json.loads(ret_2)
# Converting dictionary to Pandas Dataframe# df_ret = p.read_json(ret_2, orient='records')
df_ret = p.io.json.json_normalize(res)
df_ret.columns = df_ret.columns.map(lambda x: x.split(".")[-1])
# Removing any duplicate columns
df_ret = df_ret.loc[:, ~df_ret.columns.duplicated()]
# l.logr(str(start_pos) + '.1.' + src_file_name, debug_ind, df_ret, 'log')
start_pos = start_pos +1# If all the conversion successful# you won't get any gust column# from OpenMap response. Hence, we# need to add dummy reason column# to maintain the consistent structuresif'gust'notin df_ret.columns:
df_ret = df_ret.assign(gust=999999)[['gust'] + df_ret.columns.tolist()]
# Resetting the column orders as per JSON
column_order = col_list
df_mod_ret = df_ret.reindex(column_order, axis=1)
if start_pos ==1:
merge_dict['city'] = df_mod_ret
else:
d_frames = [merge_dict['city'], df_mod_ret]
merge_dict['city'] = p.concat(d_frames)
start_pos +=1for k, v in merge_dict.items():
l.logr(src_file_name, debug_ind, merge_dict[k], 'log')
# Now opening the temporary file
temp_log_file = log_dir + src_file_name
dfNew = p.read_csv(temp_log_file, index_col=False)
# Extracting Complex columns
dfNew['WeatherMain'] = dfNew.apply(lambda row: getMainWeather(row), axis=1)
dfNew['WeatherDescription'] = dfNew.apply(lambda row: getMainDescription(row), axis=1)
l.logr('2.dfNew.csv', debug_ind, dfNew, 'log')
# Removing unwanted columns & Renaming key columns
dfNew.drop(['weather'], axis=1, inplace=True)
dfNew.rename(columns={'name': 'CityName'}, inplace=True)
l.logr('3.dfNewMod.csv', debug_ind, dfNew, 'log')
# Now joining with the main csv# to get the complete picture
dfMain = p.merge(df, dfNew, on=['CityName'])
l.logr('4.dfMain.csv', debug_ind, dfMain, 'log')
# Let's extract only relevant columns
dfSuppliment = dfMain[['CityName', 'Population', 'State', 'country', 'feels_like', 'humidity', 'pressure', 'temp', 'temp_max', 'temp_min', 'visibility', 'deg', 'gust', 'speed', 'WeatherMain', 'WeatherDescription']]
l.logr('5.dfSuppliment.csv', debug_ind, dfSuppliment, 'log')
# Let's pass this to our map section
x2 = cm.clsMap()
ret_3 = x2.setMap(dfSuppliment)
if ret_3 ==0:
print('Successful Map Generated!')
else:
print('Please check the log for further issue!')
print("-"*60)
print()
print('Finding Story points..')
print("*"*157)
logging.info('Finding Story points..')
logging.info(tmpR0)
tmpR10 ='End Time: '+str(var)
logging.info(tmpR10)
logging.info(tmpR0)
exceptValueErroras e:
print(str(e))
print("No relevant data to proceed!")
logging.info("No relevant data to proceed!")
exceptExceptionas e:
print("Top level Error: args:{0}, message{1}".format(e.args, e.message))
if __name__ =="__main__":
main()
Key snippet from the above script –
# Capturing the JSON Payloadres = json.loads(ret_2)# Converting dictionary to Pandas Dataframedf_ret = p.io.json.json_normalize(res)df_ret.columns = df_ret.columns.map(lambda x: x.split(".")[-1])
Once the application received the JSON response from the realtime API, the application is converting it to pandas dataframe.
# Removing any duplicate columnsdf_ret = df_ret.loc[:, ~df_ret.columns.duplicated()]
Since this is a complex JSON response. The application might encounter duplicate columns, which might cause a problem later. Hence, our app is removing all these duplicate columns as they are not required for our cases.
if 'gust' not in df_ret.columns:
    df_ret = df_ret.assign(gust=999999)[['gust'] + df_ret.columns.tolist()]
There is a possibility that the application might not receive all the desired attributes from the realtime API. Hence, the above lines will check & add a dummy column named gust for those records in case if they are not present in the JSON response.
These few lines required as our API has a limitation of responding with only one city at a time. Hence, in this case, we’re retrieving one town at a time & finally merge them into a single dataframe before creating a temporary source file for the next step.
At this moment our data should look like this –
Let’s check the weather column. We need to extract the main & description for our dashboard, which will be coming in the next installment.
The above lines extracting the weather column & replacing the single quotes with the double quotes before the application is trying to convert that to JSON. Once it converted to JSON, the json_normalize will easily serialize it & create individual columns out of it. Once you have them captured inside the pandas dataframe, you can extract the unique values & store them & return them to your primary calling function.
# Let's pass this to our map sectionx2 = cm.clsMap()ret_3 = x2.setMap(dfSuppliment)if ret_3 == 0: print('Successful Map Generated!')else: print('Please check the log for further issue!')
In the above lines, the application will invoke the Map class to calculate the remaining logic & then plotting the data into the seaborn graph.
Let’s just briefly see the central directory structure –
Here is the log directory –
And, finally, the source directory should look something like this –
Today, I’ll present a way to get the best route from Indian Railways train between two specific sources & destination using third-party API.
This approach is particularly beneficial if you want to integrate this logic in Azure Function or Lambda Function or any serverless functions.
Before we dig into the details. Let us explore what kind of cloud-based architecture we can implement this.
Fig: 1 (Cloud Architecture)
In this case, I’ve considered Azure as the implementation platform.
Let’s discuss how the events will take place. At first, a user searches for the best routes between two fixed stations. The user has to provide the source & destination stations. The request will go through the Azure Firewall after validating the initial authentication. As part of the API service, it will check for similar queries & if it is there, then it will fetch it from the cache & send it back to the user through their mobile application. However, for the first time, it will retrieve the information from the DB & keep a copy in the cache. This part also managed through a load balancer for high-level availability. However, periodically system will push the data from the cache to the DB with the updated information.
Let’s see the program directory structure –
Let’s discuss our code –
1. clsConfig.py (This script contains all the parameters for the main Indian Railway API & try to get the response between two railway stations. Hence, the name comes into the picture.)
################################################## Written By: SATYAKI DE ######## Written On: 12-Oct-2019 ######## ######## Objective: This script is a config ######## file, contains all the keys for ######## azure cosmos db. Application will ######## process these information & perform ######## various CRUD operation on Cosmos DB. ##################################################importosimportplatformasplclassclsConfig(object):
Curr_Path = os.path.dirname(os.path.realpath(__file__))
os_det = pl.system()
if os_det =="Windows":
sep ='\\'else:
sep ='/'
config = {
'APP_ID': 1,
'URL': "https://trains.p.rapidapi.com/",
'RAPID_API_HOST': "trains.p.rapidapi.com",
'RAPID_API_KEY': "hrfjjdfjfjfjfjxxxxxjffjjfjfjfjfjfjfjf",
'RAPID_API_TYPE': "application/json",
'ARCH_DIR': Curr_Path + sep +'arch'+ sep,
'PROFILE_PATH': Curr_Path + sep +'profile'+ sep,
'LOG_PATH': Curr_Path + sep +'log'+ sep,
'REPORT_PATH': Curr_Path + sep +'report',
'APP_DESC_1': 'Indian Railway Train Schedule Search',
'DEBUG_IND': 'N',
'INIT_PATH': Curr_Path,
'COL_LIST': ['name','train_num','train_from','train_to','classes','departTime','arriveTime','Mon','Tue','Wed','Thu','Fri','Sat','Sun']
}
As of now, I’ve replaced the API Key with the dummy value.
2. clsIndianRailway.py (This script will invoke the main Indian Railway API & try to get the response between two railway stations. Hence, the name comes into the picture.)
The first four lines are to receive the parameter values. Our application needs to frame the search query, which is done in the IPayload variable. After that, our app will convert it into a json object type.
Now, the application will prepare the headers & send the request & received the response. Finally, that response will be sent by this script to the main callee application after extracting part of the response & converting that back to JSON are as follows –
3. callIndianRailwayAPI.py (This is the main script which invokes the main Indian Railway API & tries to get the response between two railway stations. Hence, the name comes into the picture.)
################################################## Written By: SATYAKI DE ######## Written On: 20-Dec-2019 ######## Modified On 20-Dec-2019 ######## ######## Objective: Main calling scripts. ##################################################fromclsConfigimport clsConfig as cf
importpandasaspimportclsLasclimportloggingimportdatetimeimportjsonimportclsIndianRailwayasctimportreimportnumpyasnp# Disbling Warningdefwarn(*args, **kwargs):
passimportwarnings
warnings.warn = warn
# Lookup functions from# Azure cloud SQL DB
var = datetime.datetime.now().strftime("%Y-%m-%d_%H-%M-%S")
defgetArriveTimeOnly(row):
try:
# Using regular expression to fetch time part only
lkp_arriveTime =str(row['arriveTime'])
str_arr_time, remain = lkp_arriveTime.split('+')
return str_arr_time
exceptExceptionas e:
x =str(e)
str_arr_time =''return str_arr_time
defgetArriveDateDiff(row):
try:
# Using regular expression to fetch time part only
lkp_arriveTime =str(row['arriveTime'])
first_half, str_date_diff_init = lkp_arriveTime.split('+')
# Replacing the text part from it & only capturing the integer part
str_date_diff =int(re.sub(r"[a-z]","",str_date_diff_init, flags=re.I))
return str_date_diff
exceptExceptionas e:
x =str(e)
str_date_diff =0return str_date_diff
defgetArriveTimeDiff(row):
try:
# Using regular expression to fetch time part only
lkp_arriveTimeM =str(row['arriveTimeM'])
str_time_diff_init =int(re.sub(r'[^\w\s]', '', lkp_arriveTimeM))
# Replacing the text part from it & only capturing the integer part
str_time_diff = (2400- str_time_diff_init)
return str_time_diff
exceptExceptionas e:
x =str(e)
str_time_diff =0return str_time_diff
defmain():
try:
dfSrc = p.DataFrame()
df_ret = p.DataFrame()
ret_2 =''
debug_ind ='Y'
col_list = cf.config['COL_LIST']
general_log_path =str(cf.config['LOG_PATH'])
# Enabling Logging Info
logging.basicConfig(filename=general_log_path +'consolidatedIR.log', level=logging.INFO)
# Initiating Log Class
l = cl.clsL()
# Moving previous day log files to archive directory
arch_dir = cf.config['ARCH_DIR']
log_dir = cf.config['LOG_PATH']
tmpR0 ="*"*157
logging.info(tmpR0)
tmpR9 ='Start Time: '+str(var)
logging.info(tmpR9)
logging.info(tmpR0)
print("Archive Directory:: ", arch_dir)
print("Log Directory::", log_dir)
tmpR1 ='Log Directory::'+ log_dir
logging.info(tmpR1)
# Query using parameters
rawQry =str(input('Please enter the name of the train service that you want to find out (Either by Name or by Number): '))
x1 = ct.clsIndianRailway()
ret_2 = x1.searchQry(rawQry)
# Capturing the JSON Payload
res = json.loads(ret_2)
# Converting dictionary to Pandas Dataframe# df_ret = p.read_json(ret_2, orient='records')
df_ret = p.io.json.json_normalize(res)
df_ret.columns = df_ret.columns.map(lambda x: x.split(".")[-1])
# Resetting the column orders as per JSON# df_ret = df_ret[list(res[0].keys())]
column_order = col_list
df_mod_ret = df_ret.reindex(column_order, axis=1)
# Sorting the source data for better viewing
df_mod_resp = df_mod_ret.sort_values(by=['train_from','train_to','train_num'])
l.logr('1.IndianRailway_'+ var +'.csv', debug_ind, df_mod_resp, 'log')
# Fetching Data for Delhi To Howrah
df_del_how = df_mod_resp[(df_mod_resp['train_from'] =='NDLS') & (df_mod_resp['train_to'] =='HWH')]
l.logr('2.IndianRailway_Delhi2Howrah_'+ var +'.csv', debug_ind, df_del_how, 'log')
# Splitting Arrive time into two separate fields for better calculation
df_del_how['arriveTimeM'] = df_del_how.apply(lambda row: getArriveTimeOnly(row), axis=1)
df_del_how['arriveTimeDayDiff'] = df_del_how.apply(lambda row: getArriveDateDiff(row), axis=1)
df_del_how['arriveTimeDiff'] = df_del_how.apply(lambda row: getArriveTimeDiff(row), axis=1)
l.logr('3.IndianRailway_Del2How_Mod_'+ var +'.csv', debug_ind, df_del_how, 'log')
# To fetch the best route which saves time
lstTimeDayDiff = df_del_how['arriveTimeDayDiff'].values.tolist()
min_lstTimeDayDiff =int(min(lstTimeDayDiff))
df_min_timedaydiff = df_del_how[(df_del_how['arriveTimeDayDiff'] == min_lstTimeDayDiff)]
l.logr('4.IndianRailway_Del2How_TimeCalc_'+ var +'.csv', debug_ind, df_min_timedaydiff, 'log')
# Now application will check the maximum arrivetimediff, this will bring the record# which arrives early at Howrah station
lstTimeDiff = df_min_timedaydiff['arriveTimeDiff'].values.tolist()
max_lstTimeDiff =int(max(lstTimeDiff))
df_best_route = df_min_timedaydiff[(df_min_timedaydiff['arriveTimeDiff'] == max_lstTimeDiff)]
# Dropping unwanted columns
df_best_route.drop(columns=['arriveTimeM'], inplace=True)
df_best_route.drop(columns=['arriveTimeDayDiff'], inplace=True)
df_best_route.drop(columns=['arriveTimeDiff'], inplace=True)
l.logr('5.IndianRailway_Del2How_BestRoute_'+ var +'.csv', debug_ind, df_best_route, 'log')
print("-"*60)
print('Realtime Indian Railway Data:: ')
logging.info('Realtime Indian Railway Data:: ')
print(df_mod_resp)
print()
print('Best Route from Delhi -> Howrah:: ')
print(df_best_route)
print()
# Checking execution status
ret_val_2 = df_best_route.shape[0]
if ret_val_2 ==0:
print("Indian Railway hasn't returned any rows. Please check your queries!")
logging.info("Indian Railway hasn't returned any rows. Please check your queries!")
print("*"*157)
logging.info(tmpR0)
else:
print("Successfuly row feteched!")
logging.info("Successfuly row feteched!")
print("*"*157)
logging.info(tmpR0)
print('Finding Story points..')
print("*"*157)
logging.info('Finding Story points..')
logging.info(tmpR0)
tmpR10 ='End Time: '+str(var)
logging.info(tmpR10)
logging.info(tmpR0)
exceptValueError:
print("No relevant data to proceed!")
logging.info("No relevant data to proceed!")
exceptExceptionas e:
print("Top level Error: args:{0}, message{1}".format(e.args, e.message))
if __name__ =="__main__":
main()
Key snippet to explore –
# Query using parametersrawQry = str(input('Please enter the name of the train service that you want to find out (Either by Name or by Number): '))
In this case, we make it interactive mode. However, in the actual scenario, you would receive these values from your mobile application.
# Capturing the JSON Payload res = json.loads(ret_2)
The above four lines initially invoke the API & receive the JSON response.
# Converting dictionary to Pandas Dataframedf_ret = p.io.json.json_normalize(res)df_ret.columns = df_ret.columns.map(lambda x: x.split(".")[-1])# Resetting the column orders as per JSONcolumn_order = col_listdf_mod_ret = df_ret.reindex(column_order, axis=1)# Sorting the source data for better viewingdf_mod_resp = df_mod_ret.sort_values(by=['train_from','train_to','train_num'])
In these last five lines, our application will convert the JSON & serialize it into pandas dataframe, which is sorted after that.
The result will look like this –
This is exceptionally critical, as this will allow you to achieve your target. Without flattening the data, you won’t get to your goal.
# Fetching Data for Delhi To Howrahdf_del_how = df_mod_resp[(df_mod_resp['train_from'] == 'NDLS') & (df_mod_resp['train_to'] == 'HWH')]
As the line suggested, our application will pick-up only those records between New Delhi & Howrah. Thus, we’ve used our filter to eliminate additional records. And, the data will look like this –
Now, we need to identify the minimum time taken by anyone of the two records. For that, we’ll be doing some calculations to fetch the minimum time taken by the application.
# Splitting Arrive time into two separate fields for better calculationdf_del_how['arriveTimeM'] = df_del_how.apply(lambda row: getArriveTimeOnly(row), axis=1)df_del_how['arriveTimeDayDiff'] = df_del_how.apply(lambda row: getArriveDateDiff(row), axis=1)df_del_how['arriveTimeDiff'] = df_del_how.apply(lambda row: getArriveTimeDiff(row), axis=1)
To do that, we’ll be generating a couple of derived columns (shown above), which we’ll be using the fetch the shortest duration. And, the data should look like this –
These are the two fields, which we’re using for our calculation. First, we’re splitting arriveTime into two separate columns i.e. arriveTimeM & arriveTimeDayDiff. However, arriveTimeDiff is a calculated field.
So, our logic to find the best routes –
arriveTimeDayDiff = Take the minimum of the records. If you have multiple candidates, then we’ll pick all of them. In this case, we’ll get two records.
ArrivalDiff = (24:00 – <Train’s Arrival Time>), then take the maximum of the value
Note that, in this case, we haven’t considered the departure time. You can add that logic to improvise & correct your prediction.
The above steps can be seen in the following snippet –
# To fetch the best route which saves timelstTimeDayDiff = df_del_how['arriveTimeDayDiff'].values.tolist()min_lstTimeDayDiff = int(min(lstTimeDayDiff))df_min_timedaydiff = df_del_how[(df_del_how['arriveTimeDayDiff'] == min_lstTimeDayDiff)]l.logr('4.IndianRailway_Del2How_TimeCalc_' + var + '.csv', debug_ind, df_min_timedaydiff, 'log')# Now application will check the maximum arrivetimediff, this will bring the record# which arrives early at Howrah stationlstTimeDiff = df_min_timedaydiff['arriveTimeDiff'].values.tolist()max_lstTimeDiff = int(max(lstTimeDiff))df_best_route = df_min_timedaydiff[(df_min_timedaydiff['arriveTimeDiff'] == max_lstTimeDiff)]
Let’s see how it runs –
As you can see that NDLS (New Delhi), we’ve three records marked in the GREEN square box. However, as destination HWH (Howrah), we’ve only two records marked in the RED square box. However, as part of our calculation, we’ll pick the record marked with the BLUE square box.
Let’s see how the log directory generates all the files –
Let’s see the final output in our csv file –
So, finally, we’ve achieved it. 😀
Let me know – how do you like this post. Please share your suggestion & comments.
I’ll be back with another installment from the Python verse.
Till then – Happy Avenging!
Note: All the data posted here are representational data & available over the internet & for educational purpose only.
In the above function, we’ve prepared a dummy calculation logic for TAX calculation. And, finally, we’ll be extracting two digits numeric digits after decimal by invoking the two_digit_decimal function.
def two_digit_decimal(self, n1):
    n = round(n1, 2)
    return n
This function will return two digits after decimal places.
In the above function, we’ve prepared a dummy calculation logic for TAX calculation. And, finally, we’ll be extracting two digits numeric digits after decimal by invoking the two_digit_decimal function.
Let’s run our application –
Let’s provide input say 1234 as shown in the above figures & click the Generate Tax button marked in RED. This will prompt the following screen.
Let’s explore if someone provides invalid input –
As expected, this will throw a proper warning to its application user.
So, we’ve done it. Building our first python based GUI application across multiple platforms.
Please share your review.
So, we’ll come out with another new post in the coming days!
N.B.: This is demonstrated for RnD/study purposes. All the data posted here are representational data & available over the internet & for educational purpose only.


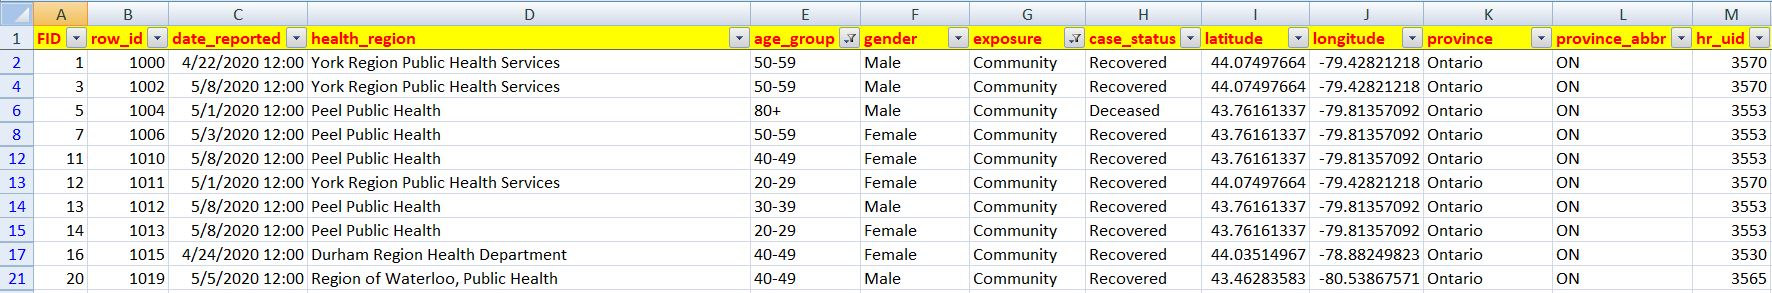


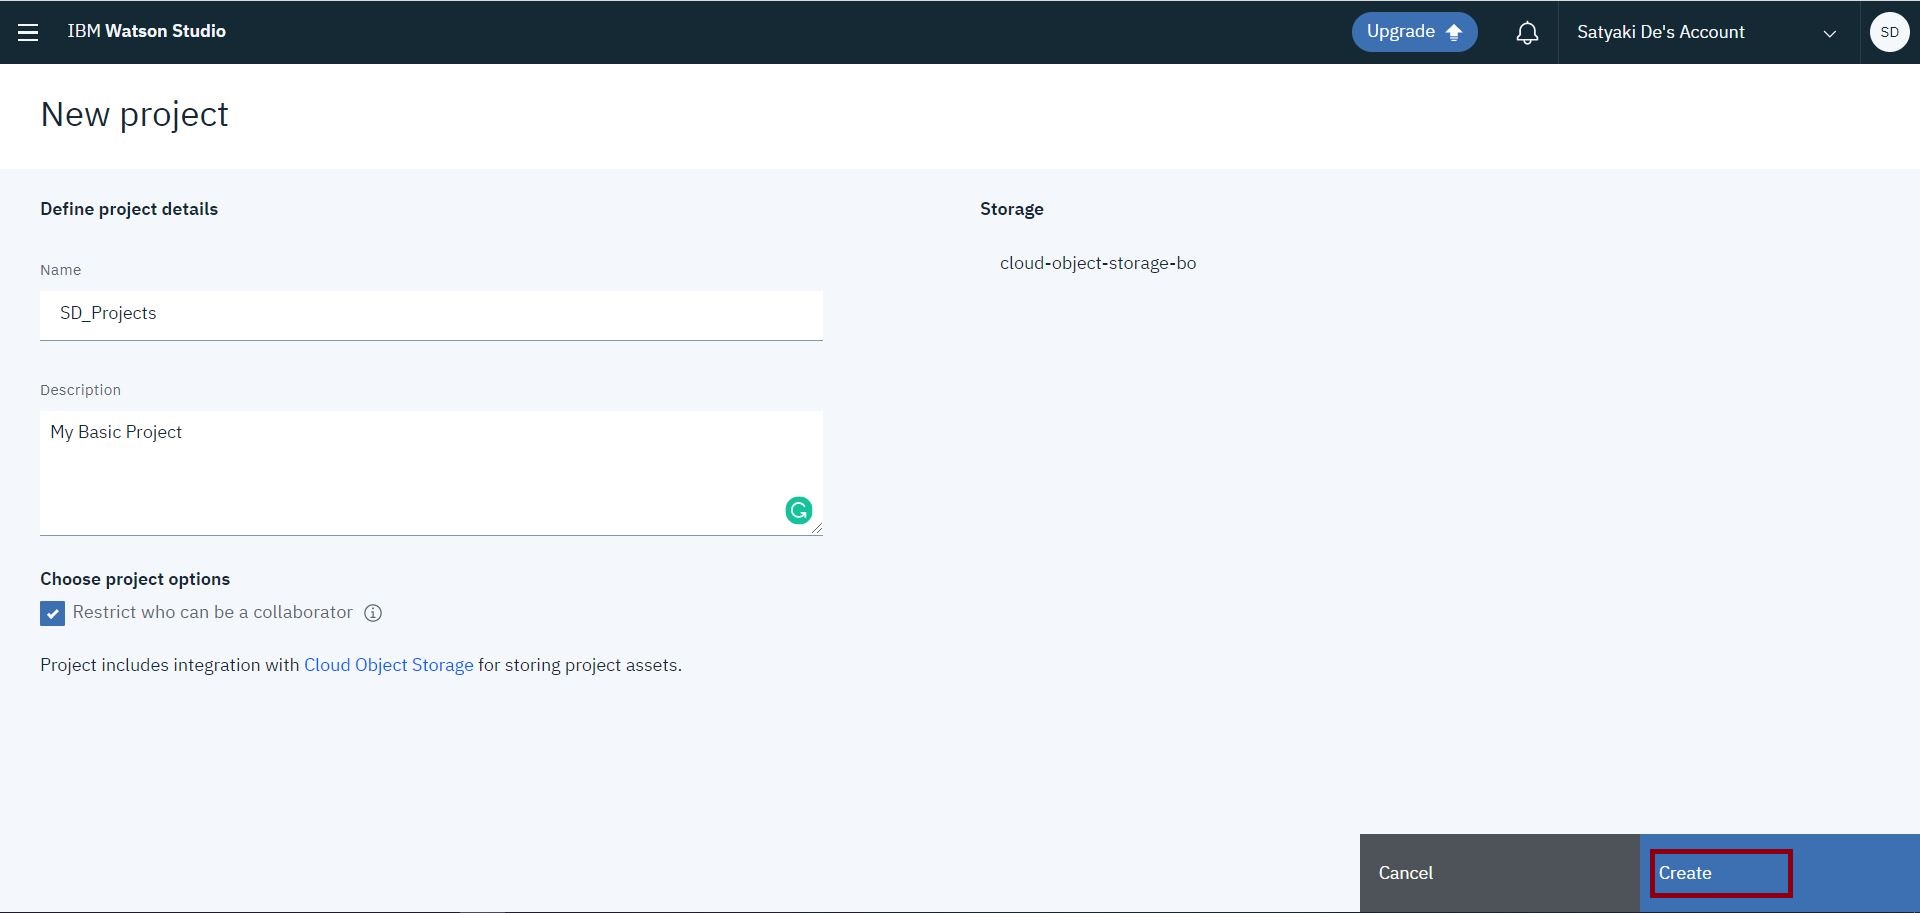


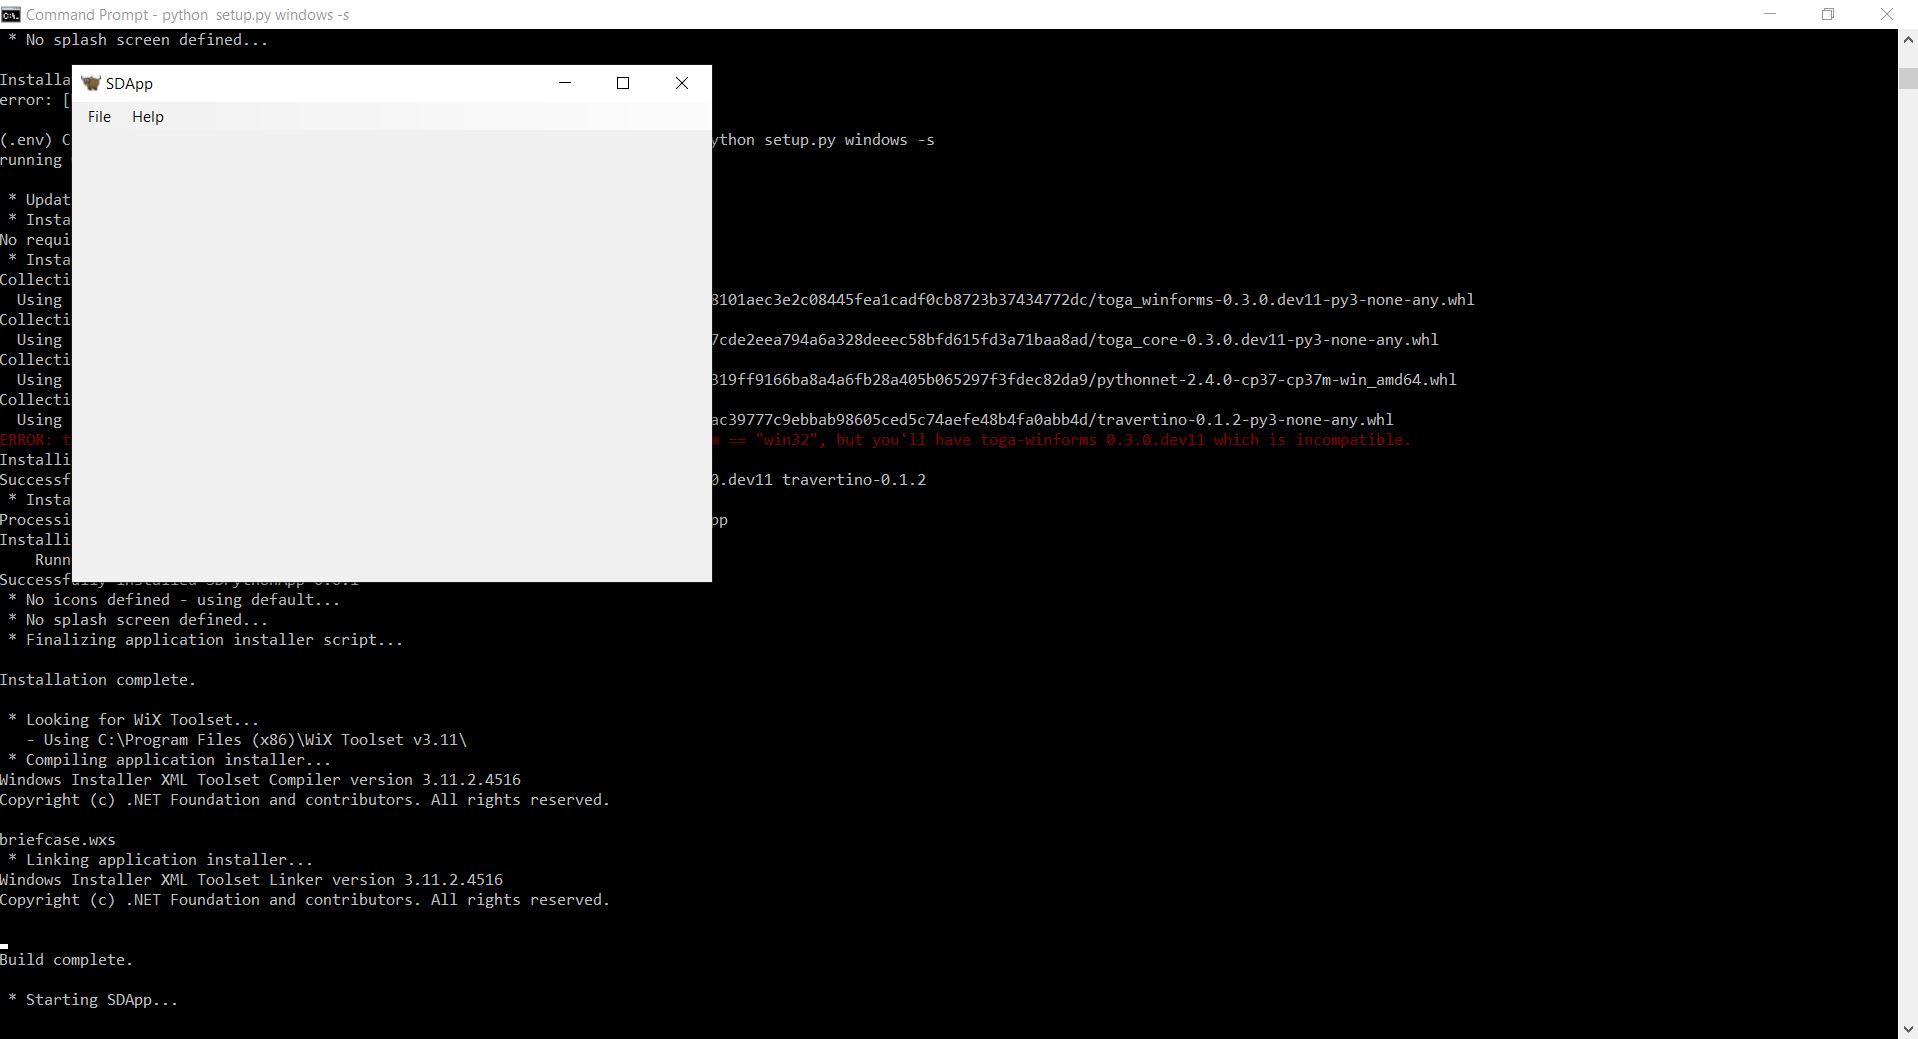


You must be logged in to post a comment.