This site mainly deals with various use cases demonstrated using Python, Data Science, Cloud basics, SQL Server, Oracle, Teradata along with SQL & their implementation. Expecting yours active participation & time. This blog can be access from your TP, Tablet & mobile also. Please provide your feedback.
Today, I’ll be using another exciting installment of Computer Vision. The application will read the real-time human hand gesture to control WebCAM’s zoom-in or zoom-out capability.
Why don’t we see the demo first before jumping into the technical details?
Demo
Architecture:
Let us understand the architecture –
Broad Diagram
As one can see, the application reads individual frames from WebCAM & then map the human hand gestures with a media pipe. And finally, calculate the distance between particular pipe points projected on human hands.
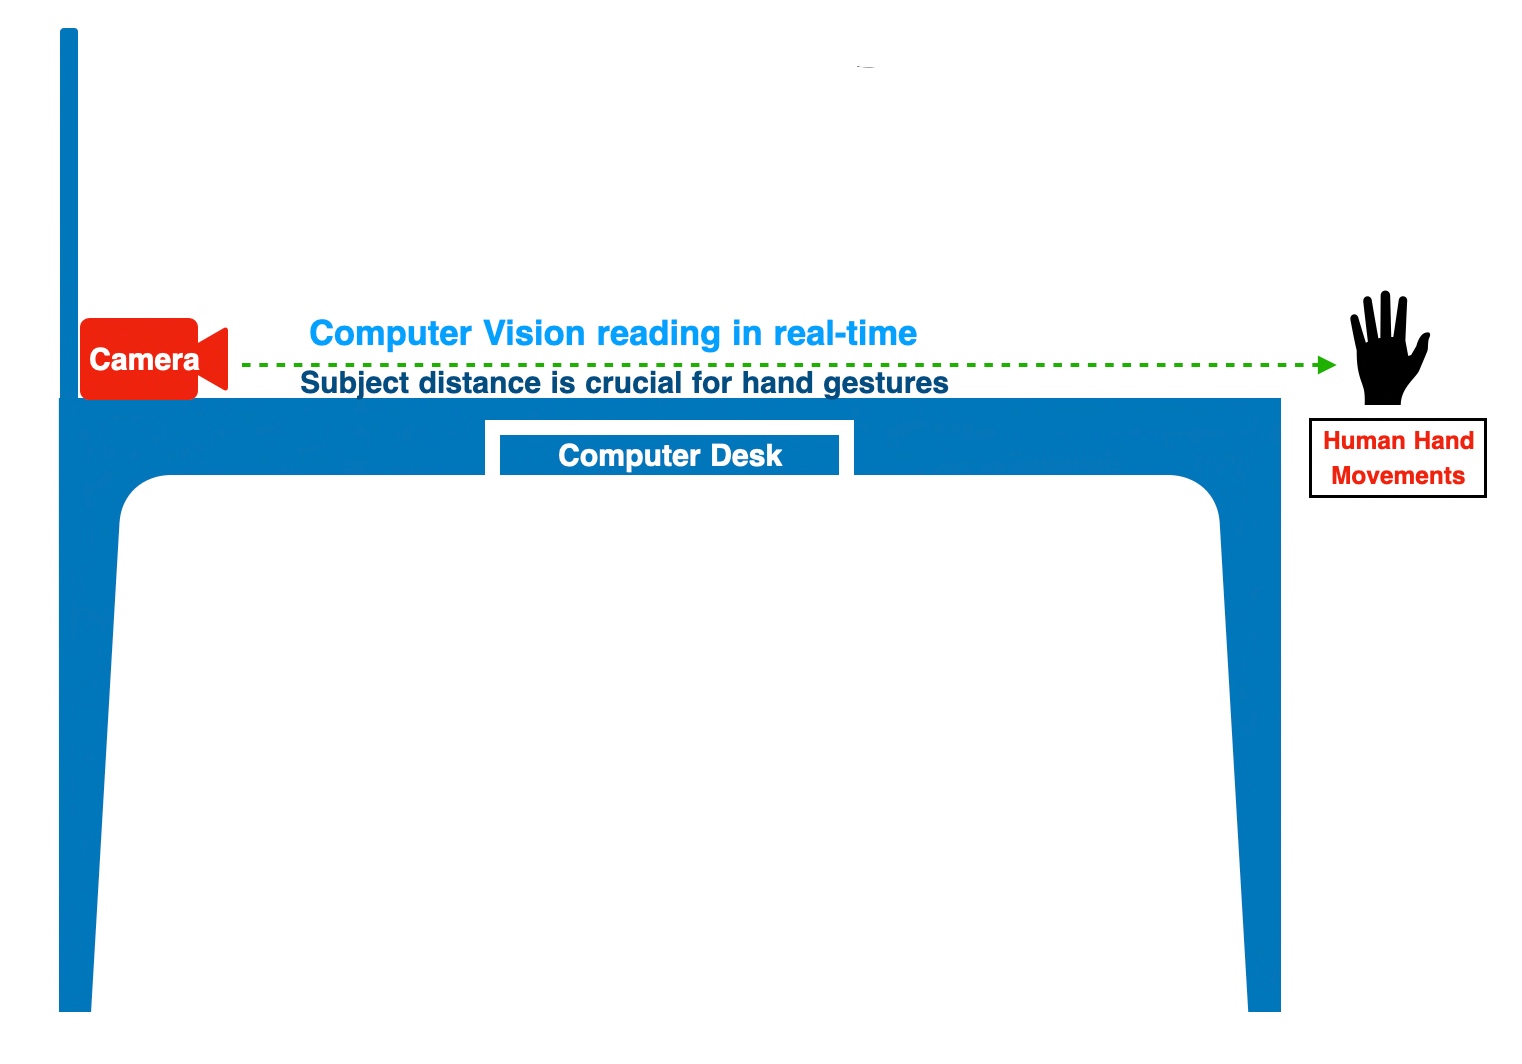
Let’s take another depiction of the experiment to better understand the above statement.
Camera & Subject Position
Python Packages:
Following are the python packages that are necessary to develop this brilliant use case –
pip install mediapipe
pip install opencv-python
CODE:
Let us now understand the code. For this use case, we will only discuss three python scripts. However, we need more than these three. However, we have already discussed them in some of the early posts. Hence, we will skip them here.
clsConfig.py (Configuration script for the application.)
This file contains hidden or bidirectional Unicode text that may be interpreted or compiled differently than what appears below. To review, open the file in an editor that reveals hidden Unicode characters.
Learn more about bidirectional Unicode characters
2. clsVideoZoom.py (This script will zoom the video streaming depending upon the hand gestures.)
This file contains hidden or bidirectional Unicode text that may be interpreted or compiled differently than what appears below. To review, open the file in an editor that reveals hidden Unicode characters.
Learn more about bidirectional Unicode characters
The above method will zoom in & zoom out depending upon the scale value that the human hand gesture will receive.
cap = cv2.VideoCapture(0)
detector = hms.clsHandMotionScanner(detectionCon=0.7)
The following lines will read the individual frames from webCAM. Instantiate another open-source customized class, which will find the hand’s position.
To understand the above lines, let’s look into the following diagram –
Source: Mediapipe
As one can see, the thumbs tip value is 4 & Index fingertip is 8. The application will mark these points with a solid circle.
lenVal = math.hypot(x2-x1, y2-y1)
The above line will calculate the distance between the thumbs tip & index fingertip.
# Camera Zoom Range is 0.01, 1

minVal = self.minVal
maxVal = self.maxVal

zRange = np.interp(lenVal, [50, 270], [minVal, maxVal])
zRangeBar = np.interp(lenVal, [50, 270], [400, 150])
In the above lines, the application will translate the values captured between the two fingertips & then translate them into a more meaningful camera zoom range from 0.01 to 1.
if lenVal < 50:
    cv2.circle(img, (cx,cy), 15, (0,255,0), cv2.FILLED)
The application will not consider a value below 50 as 0.01 for the WebCAM start value.
The application will capture the frame rate & share the original video frame and the test frame, where it will zoom in or out depending on the hand gesture.
3. clsHandMotionScanner.py (This is an enhance version of open source script, which will capture the hand position.)
This file contains hidden or bidirectional Unicode text that may be interpreted or compiled differently than what appears below. To review, open the file in an editor that reveals hidden Unicode characters.
Learn more about bidirectional Unicode characters
def findHands(self, img, draw=True):
    try:
        # Send rgb image to hands
        imgRGB = cv2.cvtColor(img,cv2.COLOR_BGR2RGB)
        self.results = self.hands.process(imgRGB)

        # process the frame
        if self.results.multi_hand_landmarks:
            for handLms in self.results.multi_hand_landmarks:

                if draw:
                    #Draw dots and connect them
                    self.mpDraw.draw_landmarks(img,handLms,self.mpHands.HAND_CONNECTIONS)

        return img
    except Exception as e:
        x = str(e)
        print('Error: ', x)

        return img
The above function will identify individual key points & marked them as dots on top of human hands.
def findPosition(self, img, handNo=0, draw=True):
      try:
          lmlist = []

          # check wether any landmark was detected
          if self.results.multi_hand_landmarks:
              #Which hand are we talking about
              myHand = self.results.multi_hand_landmarks[handNo]
              # Get id number and landmark information
              for id, lm in enumerate(myHand.landmark):
                  # id will give id of landmark in exact index number
                  # height width and channel
                  h,w,c = img.shape
                  #find the position - center
                  cx,cy = int(lm.x*w), int(lm.y*h)
                  lmlist.append([id,cx,cy])

              # Draw circle for 0th landmark
              if draw:
                  cv2.circle(img,(cx,cy), 15 , (255,0,255), cv2.FILLED)

          return lmlist
      except Exception as e:
          x = str(e)
          print('Error: ', x)

          lmlist = []
          return lmlist
The above line will capture the position of each media pipe point along with the x & y coordinate & store them in a list, which will be later parsed for main use case.
4. viewHandMotion.py (Main calling script.)
This file contains hidden or bidirectional Unicode text that may be interpreted or compiled differently than what appears below. To review, open the file in an editor that reveals hidden Unicode characters.
Learn more about bidirectional Unicode characters
The above lines are self-explanatory. So, I’m not going to discuss anything on this script.
FOLDER STRUCTURE:
Here is the folder structure that contains all the files & directories in MAC O/S –
Directory
So, we’ve done it.
You will get the complete codebase in the following Github link.
I’ll bring some more exciting topic in the coming days from the Python verse. Please share & subscribe my post & let me know your feedback.
Till then, Happy Avenging! 🙂
Note: All the data & scenario posted here are representational data & scenarios & available over the internet & for educational purpose only. Some of the images (except my photo) that we’ve used are available over the net. We don’t claim the ownership of these images. There is an always room for improvement & especially the prediction quality.
Today, I’ll be using another exciting installment of Computer Vision. Our focus will be on getting a sense of human emotions. Let me explain. This post will demonstrate how to read/detect human emotions by analyzing computer vision videos. We will be using part of a Bengali Movie called “Ganashatru (An enemy of the people)” entirely for educational purposes & also as a tribute to the great legendary director late Satyajit Roy. To know more about him, please click the following link.
Why don’t we see the demo first before jumping into the technical details?
Demo
Architecture:
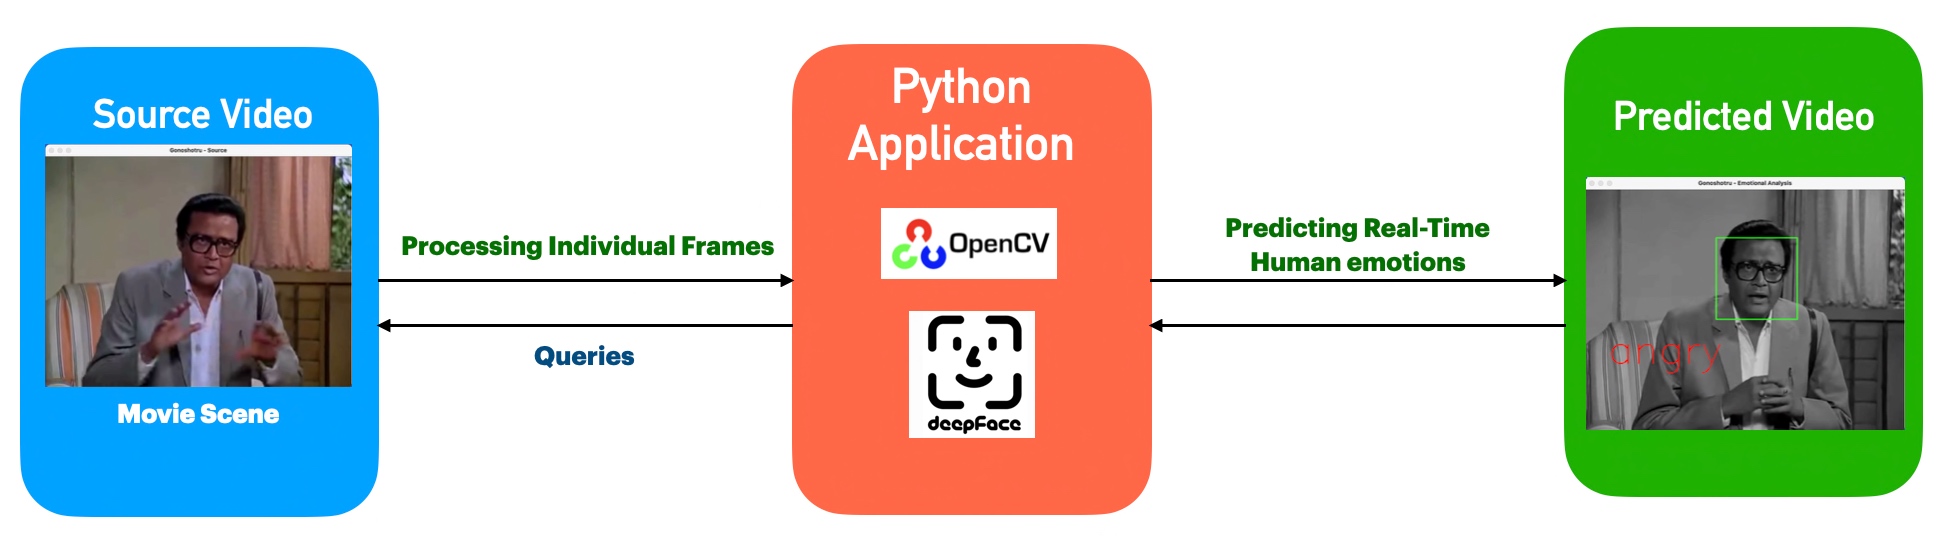
Let us understand the architecture –
Process Flow
From the above diagram, one can see that the application, which uses both the Open-CV & DeepFace, analyzes individual frames from the source. Then predicts the emotions & adds the label in the target B&W frames. Finally, it creates another video by correctly mixing the source audio.
Python Packages:
Following are the python packages that are necessary to develop this brilliant use case –
Let us now understand the code. For this use case, we will only discuss three python scripts. However, we need more than these three. However, we have already discussed them in some of the early posts. Hence, we will skip them here.
clsConfig.py (This script will play the video along with audio in sync.)
This file contains hidden or bidirectional Unicode text that may be interpreted or compiled differently than what appears below. To review, open the file in an editor that reveals hidden Unicode characters.
Learn more about bidirectional Unicode characters
All the above inputs are generic & used as normal parameters.
clsFaceEmotionDetect.py (This python class will track the human emotions after splitting the audio from the video & put that label on top of the video frame.)
This file contains hidden or bidirectional Unicode text that may be interpreted or compiled differently than what appears below. To review, open the file in an editor that reveals hidden Unicode characters.
Learn more about bidirectional Unicode characters
def convert_video_to_audio_ffmpeg(self, video_file, output_ext="mp3"):
    try:
        """Converts video to audio directly using `ffmpeg` command
        with the help of subprocess module"""
        filename, ext = os.path.splitext(video_file)
        subprocess.call(["ffmpeg", "-y", "-i", video_file, f"{filename}.{output_ext}"],
                        stdout=subprocess.DEVNULL,
                        stderr=subprocess.STDOUT)

        return 0
    except Exception as e:
        x = str(e)
        print('Error: ', x)

        return 1
The above snippet represents an Audio extraction function that will extract the audio from the source file & store it in the specified directory.
# Loading the haarcascade xml class
faceCascade = cv2.CascadeClassifier(cv2.data.haarcascades + 'haarcascade_frontalface_default.xml')
Now, Loading is one of the best classes for face detection, which our applications require.
fvs = FileVideoStream(videoFile).start()
Using FileVideoStream will enable our application to process the video faster than cv2.VideoCapture() method.
# start the FPS timer
fps = FPS().start()
The application then invokes the FPS.Start() that will initiate the FPS timer.
# loop over frames from the video file stream
while fvs.more():
The application will check using fvs.more() to find the EOF of the video file. Until then, it will try to read individual frames.
try:
    frame = fvs.read()
except Exception as e:
    x = str(e)
    print('Error: ', x)
The application will read individual frames. In case of any issue, it will capture the correct error without terminating the main program at the beginning. This exception strategy is beneficial when there is no longer any frame to read & yet due to the end frame issue, the entire application throws an error.
At this point, the application is resizing the frame for better resolution & performance. Furthermore, identify this video feed as a source.
# Enforce Detection to False will continue the sequence even when there is no face
result = DeepFace.analyze(frame, enforce_detection=False, actions = ['emotion'])
Finally, the application has used the deepface machine-learning API to analyze the subject face & trying to predict its emotions.
detectMultiScale function can use to detect the faces. This function will return a rectangle with coordinates (x, y, w, h) around the detected face.
It takes three common arguments — the input image, scaleFactor, and minNeighbours.
scaleFactor specifies how much the image size reduces with each scale. There may be more faces near the camera in a group photo than others. Naturally, such faces would appear more prominent than the ones behind. This factor compensates for that.
minNeighbours specifies how many neighbors each candidate rectangle should have to retain. One may have to tweak these values to get the best results. This parameter specifies the number of neighbors a rectangle should have to be called a face.
# Draw a rectangle around the face
for (x, y, w, h) in faces:
    cv2.rectangle(frame, (x, y), (x + w, y + h), (0,255,0), 2)
As discussed above, the application is now calculating the square’s boundary after receiving the values of x, y, w, & h.
# Use puttext method for inserting live emotion on video
cv2.putText(frame, result['dominant_emotion'], (50,390), font, 3, (0,0,255), 2, cv2.LINE_4)
Finally, capture the dominant emotion from the deepface API & post it on top of the target video.
# display the size of the queue on the frame
cv2.imwrite(temp_path+'frame-' + str(cnt) + ImageFileExtn, frame)

# show the frame and update the FPS counter
cv2.imshow("Gonoshotru - Emotional Analysis", frame)
fps.update()
Also, writing individual frames into a temporary folder, where later they will be consumed & mixed with the source audio.
if cv2.waitKey(2) & 0xFF == ord('q'):
    break
At any given point, if the user wants to quit, the above snippet will allow them by simply pressing either the escape-button or ‘q’-button from the keyboard.
clsVideoPlay.py (This script will play the video along with audio in sync.)
This file contains hidden or bidirectional Unicode text that may be interpreted or compiled differently than what appears below. To review, open the file in an editor that reveals hidden Unicode characters.
Learn more about bidirectional Unicode characters
cap = cv2.VideoCapture(file)
player = MediaPlayer(file)
In the above snippet, the application first reads the video & at the same time, it will create an instance of the MediaPlayer.
play_time = int(cap.get(cv2.CAP_PROP_POS_MSEC))
The application uses cv2.CAP_PROP_POS_MSEC to synchronize video and audio.
peopleEmotionRead.py (This is the main calling python script that will invoke the class to initiate the model to read the real-time human emotions from video.)
This file contains hidden or bidirectional Unicode text that may be interpreted or compiled differently than what appears below. To review, open the file in an editor that reveals hidden Unicode characters.
Learn more about bidirectional Unicode characters
The key-snippet from the above script are as follows –
# Instantiating all the three classes

x1 = fed.clsFaceEmotionDetect()
x2 = fv.clsFrame2Video()
x3 = vp.clsVideoPlay()
As one can see from the above snippet, all the major classes are instantiated & loaded into the memory.
# Execute all the pass
r1 = x1.readEmotion(debugInd, var)
r2 = x2.convert2Vid(debugInd, var)
r3 = x3.stream(debugInd, var)
All the responses are captured into the corresponding variables, which later check for success status.
Let us capture & compare the emotions in a screenshot for better understanding –
Emotion Analysis
So, one can see that most of the frames from the video & above-posted frame correctly identify the human emotions.
FOLDER STRUCTURE:
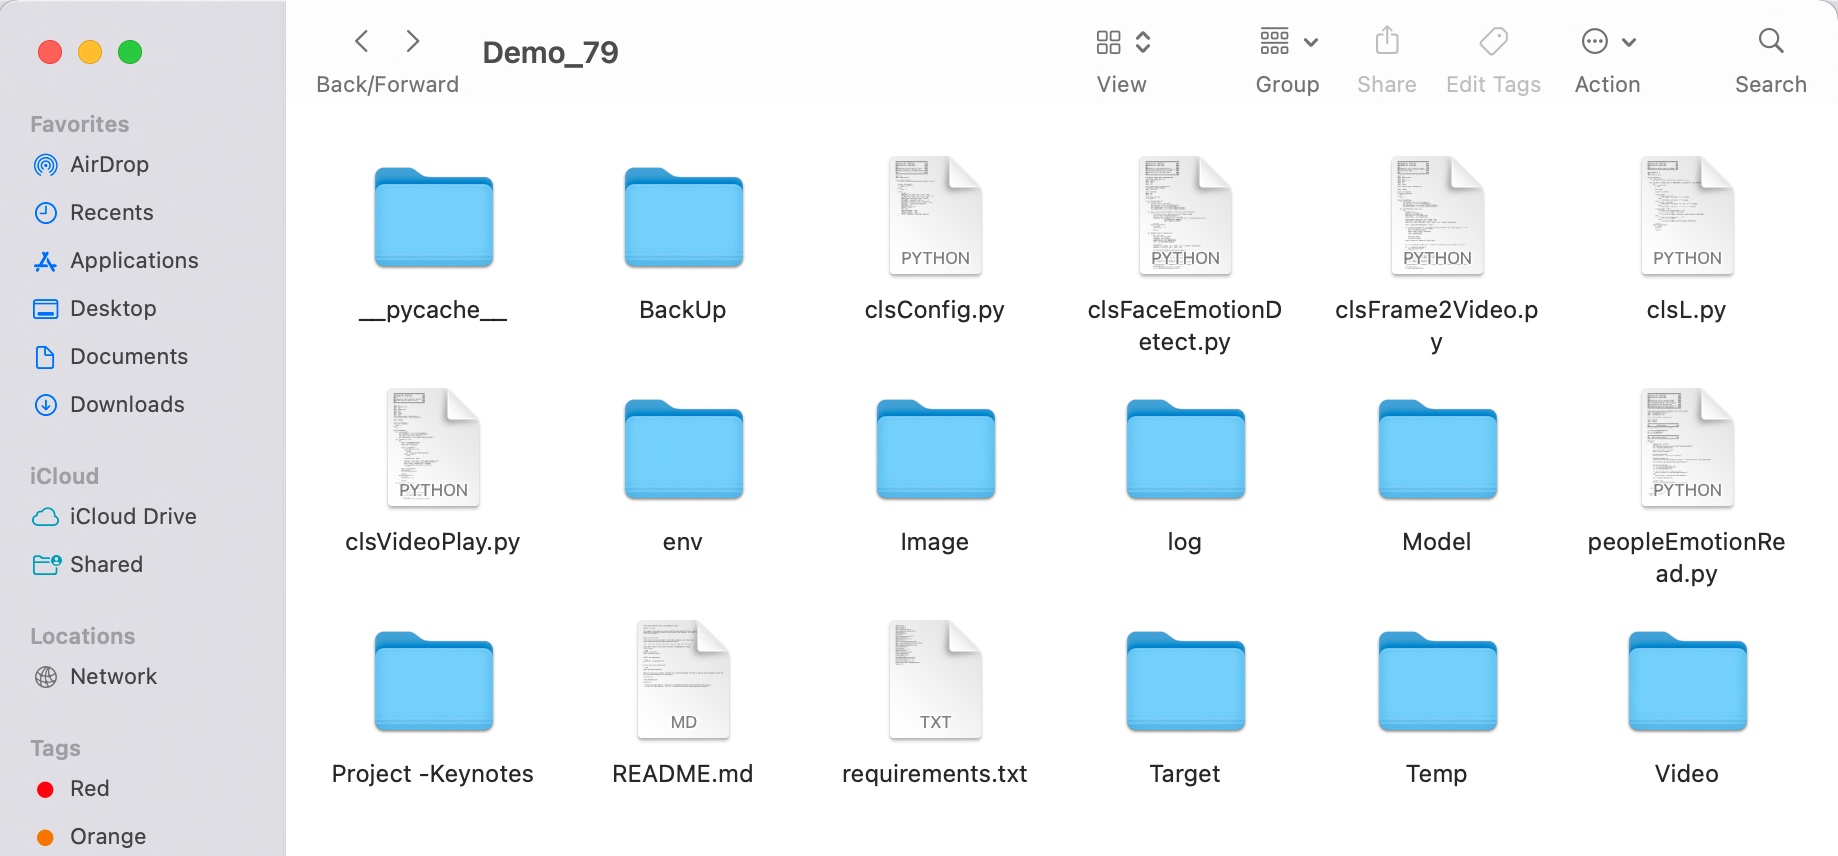
Here is the folder structure that contains all the files & directories in MAC O/S –
Directory
So, we’ve done it.
You will get the complete codebase in the following Github link.
If you want to know more about this legendary director & his famous work, please visit the following link.
I’ll bring some more exciting topic in the coming days from the Python verse. Please share & subscribe my post & let me know your feedback.
Till then, Happy Avenging! 😀
Note: All the data & scenario posted here are representational data & scenarios & available over the internet & for educational purpose only. Some of the images (except my photo) that we’ve used are available over the net. We don’t claim the ownership of these images. There is an always room for improvement & especially the prediction quality.
Today, I’ll be using another exciting installment of Computer Vision. Today, our focus will be to get a sense of visual counting. Let me explain. This post will demonstrate how to count the number of stacked-up coins using computer vision. And, we’re going to add more coins to see the number changes.
Why don’t we see the demo first before jumping into the technical details?
Demo
Isn’t it exciting?
Architecture:
Let us understand the architecture –
From the above diagram, one can notice that as raw video feed captured from a specific location at a measured distance. The python-based intelligent application will read the numbers & project on top of the video feed for human validations.
Let me share one more perspective of how you can configure this experiment with another diagram that I prepared for this post.
Setup Process
From the above picture, one can see that a specific distance exists between the camera & the stacked coins as that will influence the single coin width.
You can see how that changed with the following pictures –
This entire test will depend upon many factors to consider to get effective results. I provided the basic demo. However, to make it robust & dynamic, one can dynamically diagnose the distance & individual coin width before starting this project. I felt that part should be machine learning to correctly predict the particular coin width depending upon the length & number of coins stacked. I leave it to you to explore that part.
Then how does the Aruco marker comes into the picture?
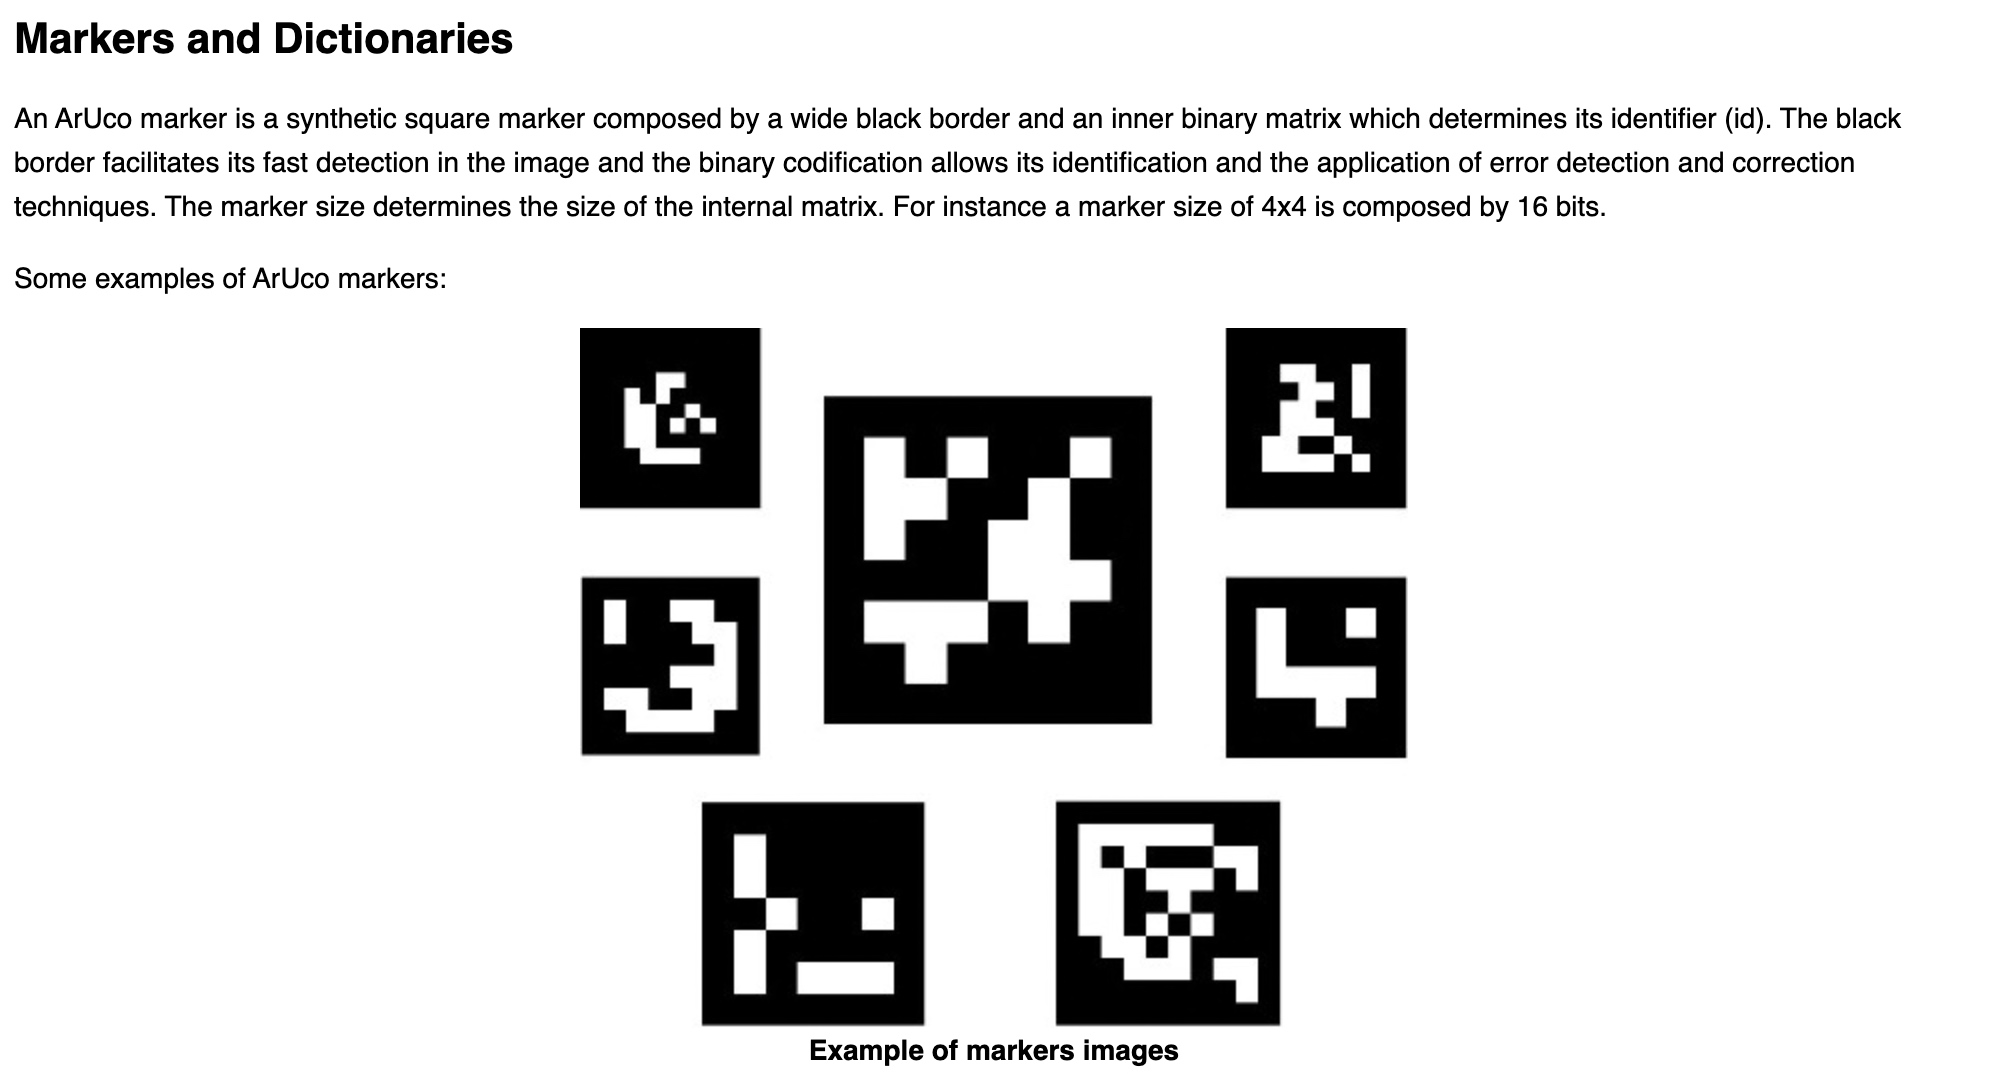
Let’s read it from the primary source side –
From: Source
Please refer to the following link if you want to know more.
For our use case, we’ll be using the following aruco marker –
Marker
How will this help us? Because we know the width & height of it. And depending upon the placement & overall pixel area size, our application can then identify the pixel to centimeter ratio & which will enable us to predict any other objects’ height & width. Once we have that, the application will divide that by the calculated width we observed for each coin from this distance. And, then the application will be able to predict the actual counts in real-time.
How can you identify the individual width?
My easy process would be to put ten quarter dollars stacked up & then you will get the height from the Computer vision. You have to divide that height by 10 to get the individual width of the coin until you build the model to predict the correct width depending upon the distance.
CODE:
Let us understand the code now –
clsConfig.py (Configuration file for the entire application.)
This file contains hidden or bidirectional Unicode text that may be interpreted or compiled differently than what appears below. To review, open the file in an editor that reveals hidden Unicode characters.
Learn more about bidirectional Unicode characters
PIC_TO_CM_MAP is the total length of the Aruco marker in centimeters involving all four sides.
CONTOUR_AREA will change depending upon the minimum size you want to identify as part of the contour.
COIN_DEF_HEIGHT needs to be revised as part of the previous steps explained.
clsAutoDetector.py (This python script will detect the contour.)
This file contains hidden or bidirectional Unicode text that may be interpreted or compiled differently than what appears below. To review, open the file in an editor that reveals hidden Unicode characters.
Learn more about bidirectional Unicode characters
Key snippets from the above script are as follows –
# Find contours
conts, Oth = cv2.findContours(maskImage, cv2.RETR_EXTERNAL, cv2.CHAIN_APPROX_SIMPLE)

objectsConts = []

for cnt in conts:
    area = cv2.contourArea(cnt)
    if area > cntArea:
        objectsConts.append(cnt)
Depending upon the supplied contour area, this script will identify & mark the contour of every frame captured through WebCam.
clsCountRealtime.py (This is the main class to calculate the number of stacked coins after reading using computer vision.)
This file contains hidden or bidirectional Unicode text that may be interpreted or compiled differently than what appears below. To review, open the file in an editor that reveals hidden Unicode characters.
Learn more about bidirectional Unicode characters
It displays both the height, width & total number of coins on top of the live video.
if cv2.waitKey(1) & 0xFF == ord('q'):
    break
The above line will help the developer exit from the visual application by pressing the escape or ‘q’ key in Macbook.
visualDataRead.py (Main calling function.)
This file contains hidden or bidirectional Unicode text that may be interpreted or compiled differently than what appears below. To review, open the file in an editor that reveals hidden Unicode characters.
Learn more about bidirectional Unicode characters
# Execute all the pass
r1 = x1.learnStats(debugInd, var)

if (r1 == 0):
    print('Successfully counts number of stcaked coins!')
else:
    print('Failed to counts number of stcaked coins!')
The above code invokes the learnStats function to calculate the count of stacked coins.
FOLDER STRUCTURE:
Folder Details
So, we’ve done it.
You will get the complete codebase in the following Github link.
I’ll bring some more exciting topic in the coming days from the Python verse. Please share & subscribe my post & let me know your feedback.
Till then, Happy Avenging! 😀
Note: All the data & scenario posted here are representational data & scenarios & available over the internet & for educational purpose only. Some of the images (except my photo) that we’ve used are available over the net. We don’t claim the ownership of these images. There is an always room for improvement & especially the prediction quality.
This week we’re planning to touch on one of the exciting posts of visually reading characters from WebCAM & predict the letters using CNN methods. Before we dig deep, why don’t we see the demo run first?
Demo
Isn’t it fascinating? As we can see, the computer can record events and read like humans. And, thanks to the brilliant packages available in Python, which can help us predict the correct letter out of an Image.
What do we need to test it out?
Preferably an external WebCAM.
A moderate or good Laptop to test out this.
Python
And a few other packages that we’ll mention next block.
What Python packages do we need?
Some of the critical packages that we must need to test out this application are –
In deep learning, a convolutional neural network (CNN/ConvNet) is a class of deep neural networks most commonly applied to analyze visual imagery.
Different Steps of CNN
We can understand from the above picture that a CNN generally takes an image as input. The neural network analyzes each pixel separately. The weights and biases of the model are then tweaked to detect the desired letters (In our use case) from the image. Like other algorithms, the data also has to pass through pre-processing stage. However, a CNN needs relatively less pre-processing than most other Deep Learning algorithms.
If you want to know more about this, there is an excellent article on CNN with some on-point animations explaining this concept. Please read it here.
Where do we get the data sets for our testing?
For testing, we are fortunate enough to have Kaggle with us. We have received a wide variety of sample data, which you can get from here.
Our use-case:
Architecture
From the above diagram, one can see that the python application will consume a live video feed of any random letters (both printed & handwritten) & predict the character as part of the machine learning model that we trained.
Code:
clsConfig.py (Configuration file for the entire application.)
This file contains hidden or bidirectional Unicode text that may be interpreted or compiled differently than what appears below. To review, open the file in an editor that reveals hidden Unicode characters.
Learn more about bidirectional Unicode characters
Since we have 26 letters, we have classified it as 26 in the numOfClasses.
Since we are talking about characters, we had to come up with a process of identifying each character as numbers & then processing our entire logic. Hence, the above parameter named word_dict captured all the characters in a python dictionary & stored them. Moreover, the application translates the final number output to more appropriate characters as the prediction.
2. clsAlphabetReading.py (Main training class to teach the model to predict alphabets from visual reader.)
This file contains hidden or bidirectional Unicode text that may be interpreted or compiled differently than what appears below. To review, open the file in an editor that reveals hidden Unicode characters.
Learn more about bidirectional Unicode characters
We are splitting the data into Train, Test & Validation sets to get more accurate predictions and reshaping the raw data into the image by consuming the 784 data columns to 28×28 pixel images.
Since we are talking about characters, we had to come up with a process of identifying The following snippet will plot the character equivalent number into a matplotlib chart & showcase the overall distribution trend after splitting.
Y_Train_Num = np.int0(y)
count = np.zeros(numOfClasses, dtype='int')
for i in Y_Train_Num:
    count[i] +=1

alphabets = []
for i in word_dict.values():
    alphabets.append(i)

fig, ax = plt.subplots(1,1, figsize=(7,7))
ax.barh(alphabets, count)

plt.xlabel("Number of elements ")
plt.ylabel("Alphabets")
plt.grid()
plt.show(block=False)
plt.pause(sleepTime)
plt.close()
Note that we have tweaked the plt.show property with (block=False). This property will enable us to continue execution without human interventions after the initial pause.
# Model reshaping the training & test dataset
X_Train = X_Train.reshape(X_Train.shape[0],X_Train.shape[1],X_Train.shape[2],1)
print("Shape of Train Data: ", X_Train.shape)

X_Test = X_Test.reshape(X_Test.shape[0], X_Test.shape[1], X_Test.shape[2],1)
print("Shape of Test Data: ", X_Test.shape)

X_Validation = X_Validation.reshape(X_Validation.shape[0], X_Validation.shape[1], X_Validation.shape[2],1)
print("Shape of Validation data: ", X_Validation.shape)

# Converting the labels to categorical values
Y_Train_Catg = to_categorical(Y_Train, num_classes = numOfClasses, dtype='int')
print("Shape of Train Labels: ", Y_Train_Catg.shape)

Y_Test_Catg = to_categorical(Y_Test, num_classes = numOfClasses, dtype='int')
print("Shape of Test Labels: ", Y_Test_Catg.shape)

Y_Validation_Catg = to_categorical(Y_Validation, num_classes = numOfClasses, dtype='int')
print("Shape of validation labels: ", Y_Validation_Catg.shape)
In the above diagram, the application did reshape all three categories of data before calling the primary CNN function.
In the above snippet, the convolution layers are followed by maxpool layers, which reduce the number of features extracted. The output of the maxpool layers and convolution layers are flattened into a vector of a single dimension and supplied as an input to the Dense layer—the CNN model prepared for training the model using the training dataset.
We have used optimization parameters like Adam, RMSProp & the application we trained for eight epochs for better accuracy & predictions.
# Displaying the accuracies & losses for train & validation set
print("Validation Accuracy :", history.history['val_accuracy'])
print("Training Accuracy :", history.history['accuracy'])
print("Validation Loss :", history.history['val_loss'])
print("Training Loss :", history.history['loss'])

# Displaying the Loss Graph
plt.figure(1)
plt.plot(history.history['loss'])
plt.plot(history.history['val_loss'])
plt.legend(['training','validation'])
plt.title('Loss')
plt.xlabel('epoch')
plt.show(block=False)
plt.pause(sleepTime1)
plt.close()

# Dsiplaying the Accuracy Graph
plt.figure(2)
plt.plot(history.history['accuracy'])
plt.plot(history.history['val_accuracy'])
plt.legend(['training','validation'])
plt.title('Accuracy')
plt.xlabel('epoch')
plt.show(block=False)
plt.pause(sleepTime1)
plt.close()
Also, we have captured the validation Accuracy & Loss & plot them into two separate graphs for better understanding.
Also, the application is trying to get the accuracy of the model that we trained & validated with the training & validation data. This time we have used test data to predict the confidence score.
# Displaying some of the test images & their predicted labels
fig, ax = plt.subplots(3,3, figsize=(8,9))
axes = ax.flatten()

for i in range(9):
    axes[i].imshow(np.reshape(X_Test[i], reshapeVal1), cmap="Greys")
    pred = word_dict[np.argmax(Y_Test_Catg[i])]
    print('Prediction: ', pred)
    axes[i].set_title("Test Prediction: " + pred)
    axes[i].grid()
plt.show(block=False)
plt.pause(sleepTime1)
plt.close()
Finally, the application testing with some random test data & tried to plot the output & prediction assessment.
As a part of the last step, the application will generate the models using a pickle package & save them under a specific location, which the reader application will use.
3. trainingVisualDataRead.py (Main application that will invoke the training class to predict alphabet through WebCam using Convolutional Neural Network (CNN).)
This file contains hidden or bidirectional Unicode text that may be interpreted or compiled differently than what appears below. To review, open the file in an editor that reveals hidden Unicode characters.
Learn more about bidirectional Unicode characters
The python application will invoke the class & capture the returned value inside the r1 variable.
4. readingVisualData.py (Reading the model to predict Alphabet using WebCAM.)
This file contains hidden or bidirectional Unicode text that may be interpreted or compiled differently than what appears below. To review, open the file in an editor that reveals hidden Unicode characters.
Learn more about bidirectional Unicode characters
We have initially cloned the original video frame & then it converted from BGR2GRAYSCALE while applying the threshold on it doe better prediction outcomes. Then the image has resized & reshaped for model input. Finally, the np.argmax function extracted the class index with the highest predicted probability. Furthermore, it is translated using the word_dict dictionary to an Alphabet & displayed on top of the Live View.
Also, derive the confidence score of that probability & display that on top of the Live View.
if cv2.waitKey(1) & 0xFF == ord('q'):
    r1=0
    break
The above code will let the developer exit from this application by pressing the “Esc” or “q”-key from the keyboard & the program will terminate.
So, we’ve done it.
You will get the complete codebase in the following Github link.
I’ll bring some more exciting topic in the coming days from the Python verse. Please share & subscribe my post & let me know your feedback.
Till then, Happy Avenging! 😀
Note: All the data & scenario posted here are representational data & scenarios & available over the internet & for educational purpose only. Some of the images (except my photo) that we’ve used are available over the net. We don’t claim the ownership of these images. There is an always room for improvement & especially the prediction quality of Alphabet.









You must be logged in to post a comment.