Predicting real-time Covid-19 forecast by analyzing time-series data using Facebook machine-learning API

Hello Guys,

Today, I’ll share one of the important posts on predicting data using facebook’s relatively new machine-learning-based API. I find this API is interesting as to how it can build & anticipate the outcome.

We’ll be using one of the most acceptable API-based sources for Covid-19 & I’ll be sharing the link over here.

We’ll be using the prophet-API developed by Facebook to predict the data. You will get the details from this link.

Architecture

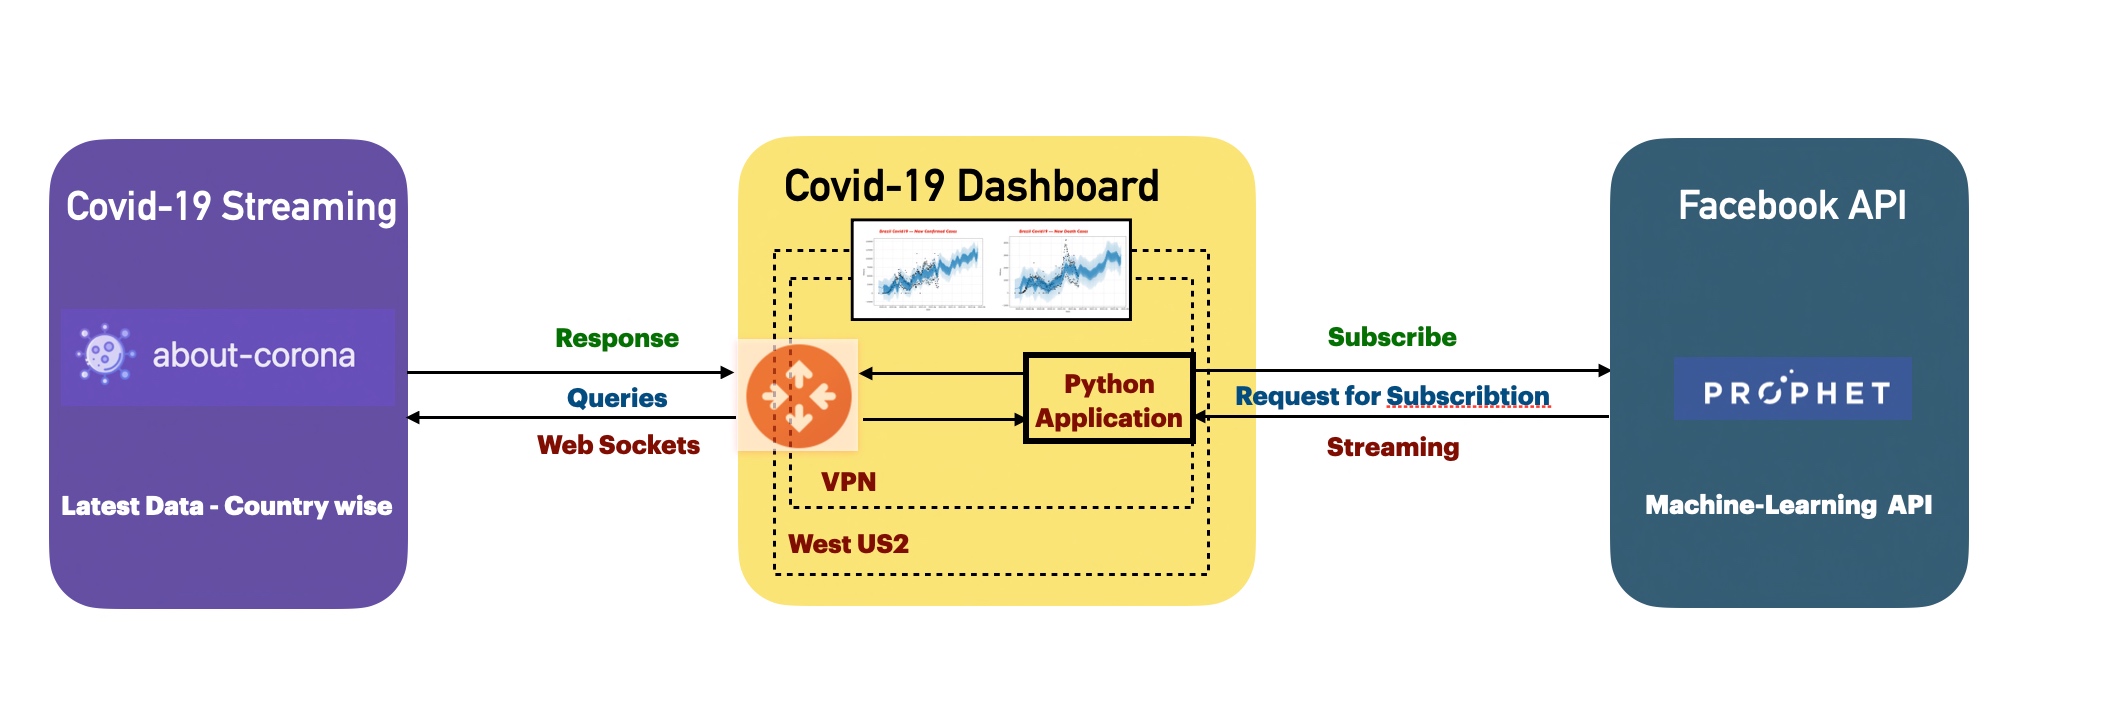
Now, let’s explore the architecture shared above.

As you can see that the application will consume the data from the third-party API named “about-corona,” & the python application will clean & transform the data. The application will send the clean data to the Facebook API (prophet) built on the machine-learning algorithm. This API is another effective time-series analysis platform given to the data scientist community.

Once the application receives the predicted model, it will visualize them using plotly & matplotlib.


I would request you to please check the demo of this application just for your reference.

Demo Run

We’ll do a time series analysis. Let us understand the basic concept of time series.

Time series is a series of data points indexed (or listed or graphed) in time order.

Therefore, the data organized by relatively deterministic timestamps and potentially compared with random sample data contain additional information that we can leverage for our business use case to make a better decision.

To use the prophet API, one needs to use & transform their data cleaner & should contain two fields (ds & y).

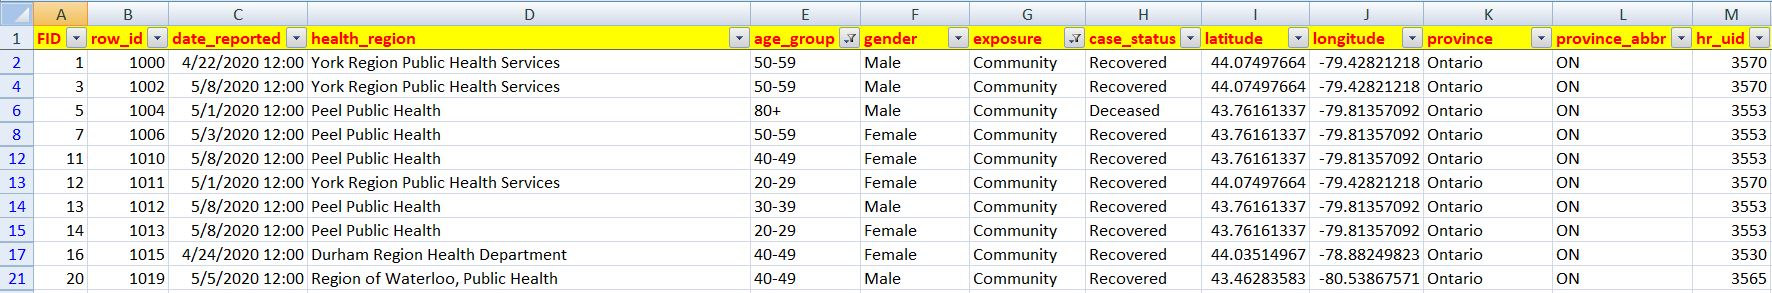
Let’s check one such use case since our source has plenty of good data points to decide. We’ve daily data of newly infected covid patients based on countries, as shown below –

Covid Cases

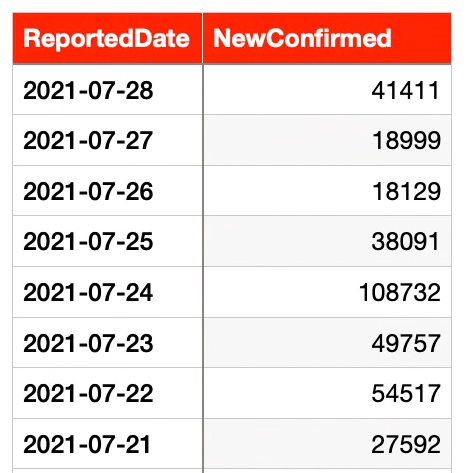
And, our clean class will transform the data into two fields –

Transformed Data

Once we fit the data into the prophet model, it will generate some additional columns, which will be used for prediction as shown below –

Generated data from prophet-api

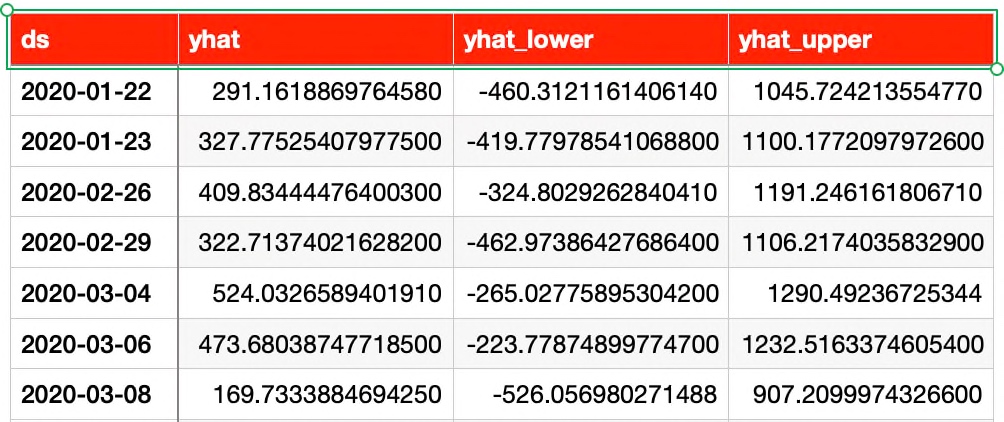
And, a sample prediction based on a similar kind of data would be identical to this –

Sample Prediction

Let us understand what packages we need to install to prepare this application –

Installing Dependency Packages – I
Installing Dependency Packages – II

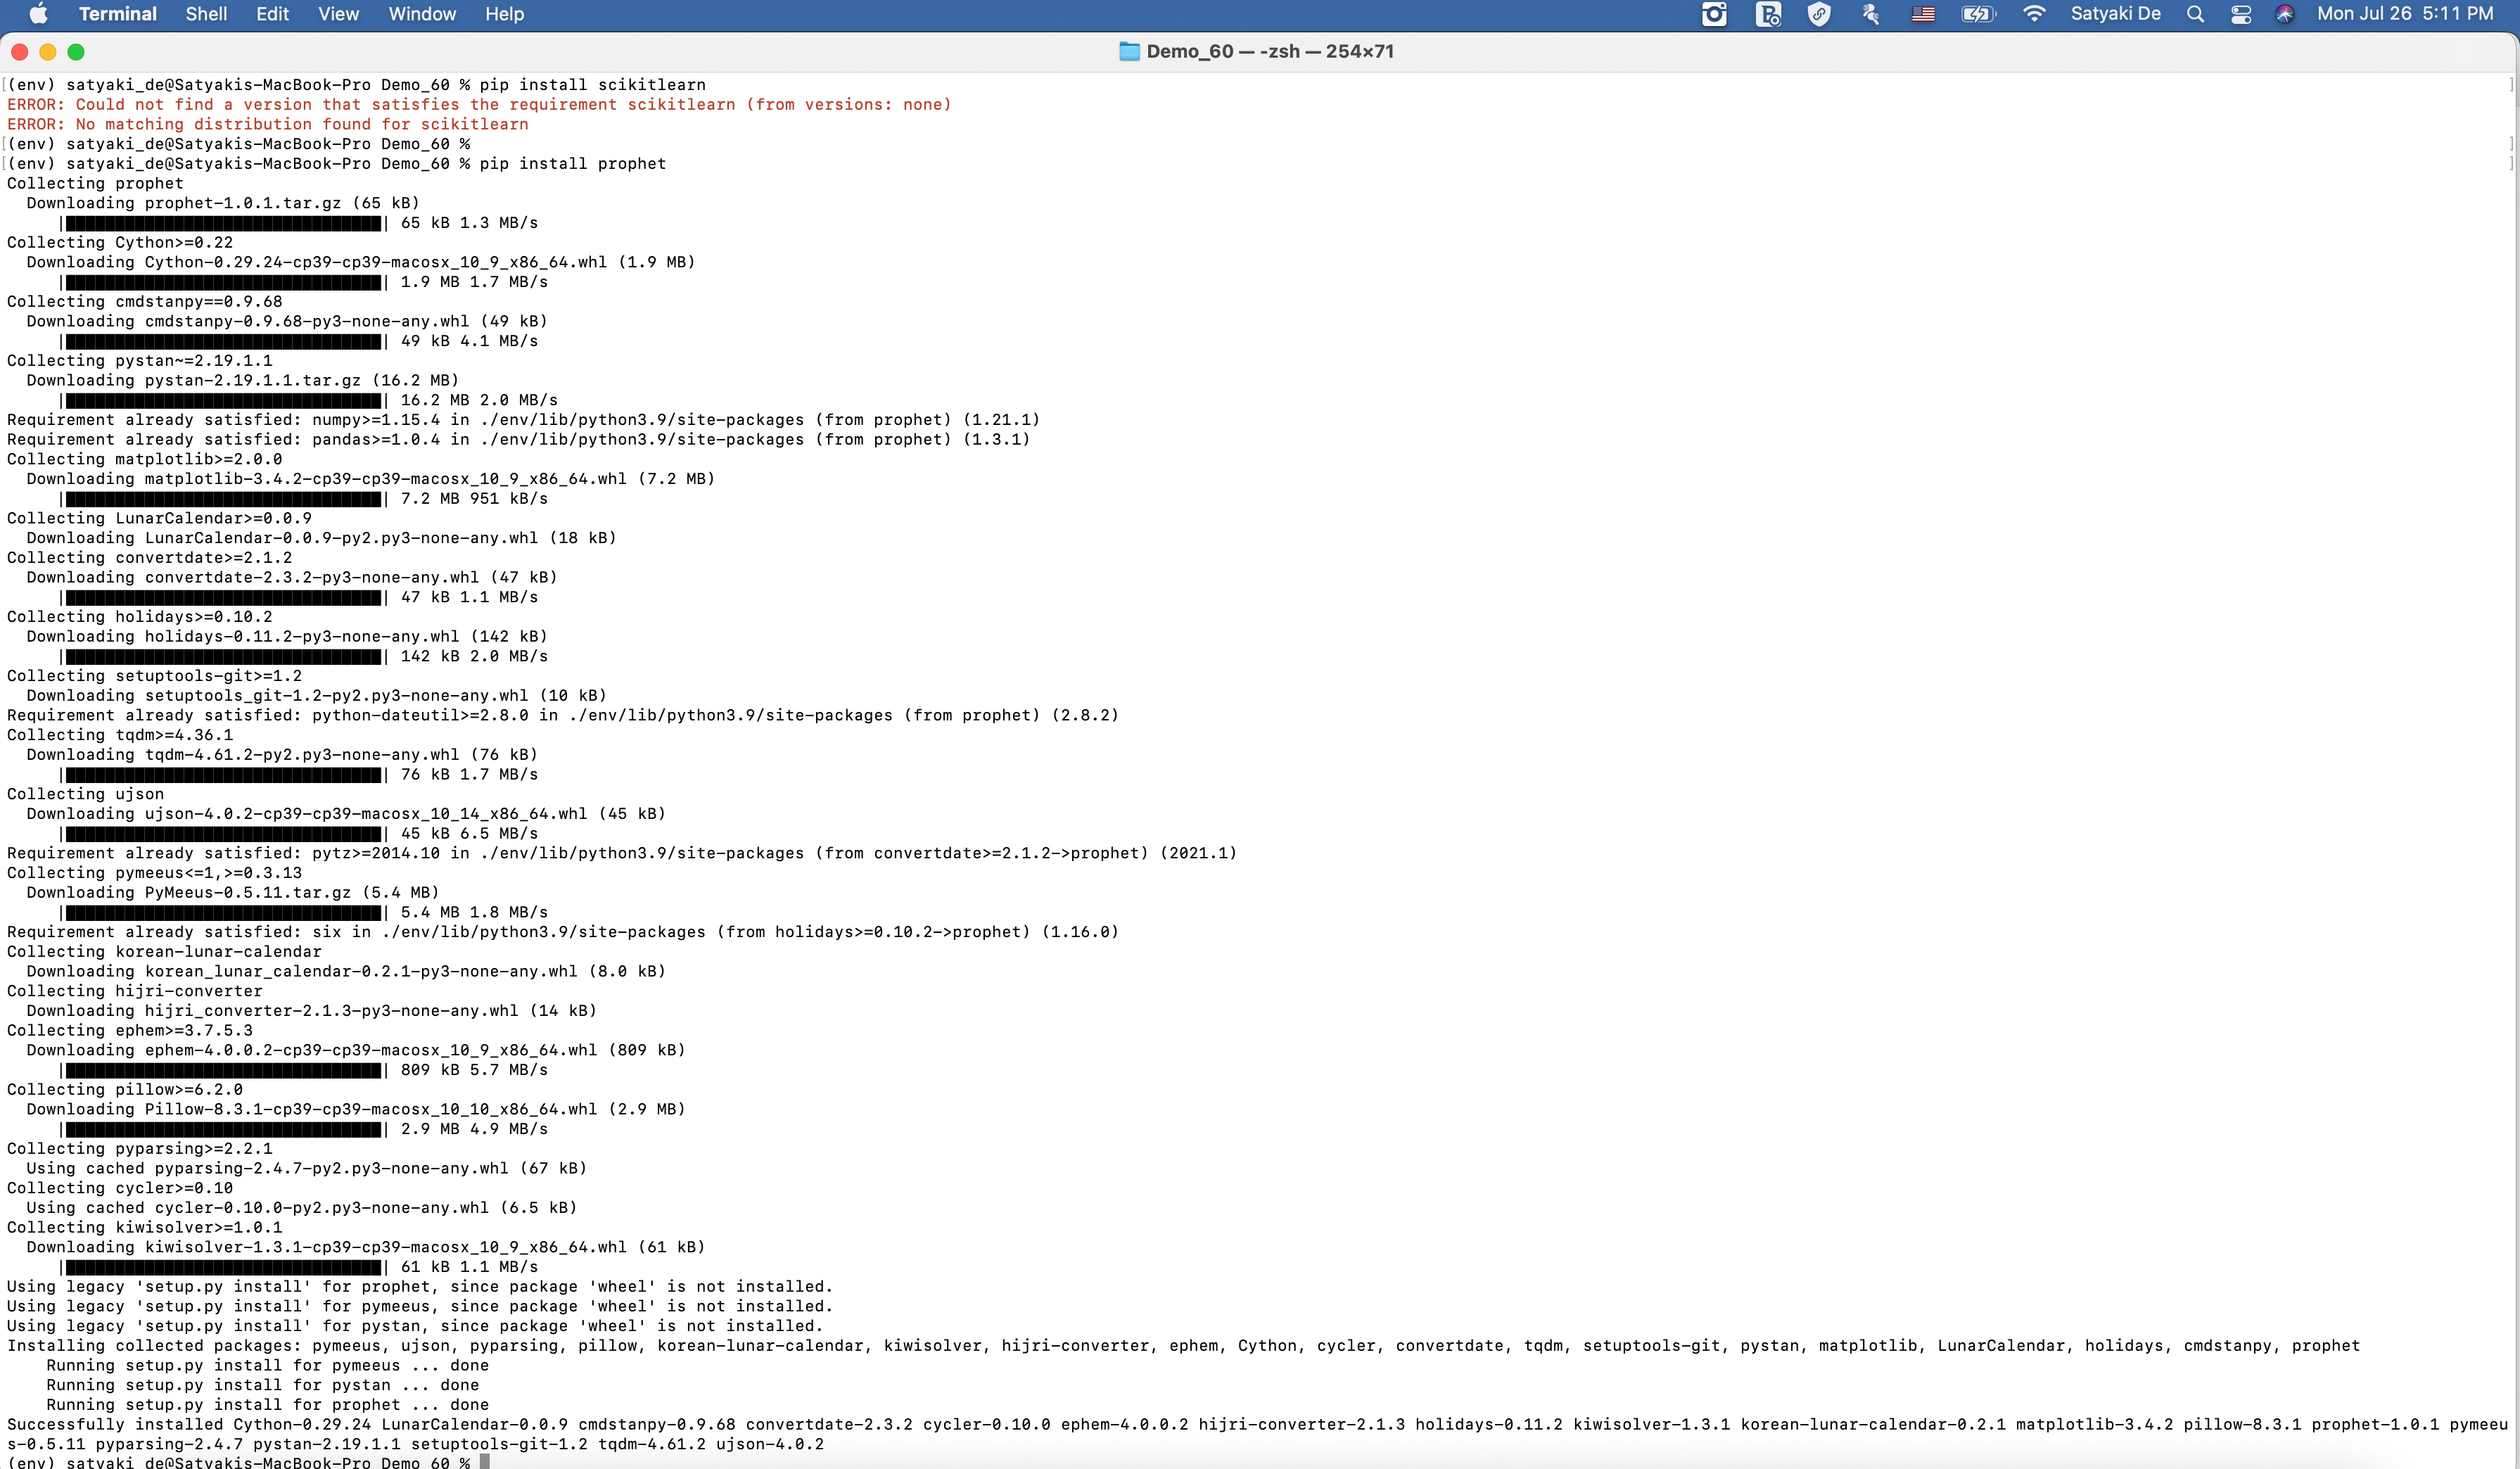
And, here is the packages –

pip install pandas
pip install matplotlib
pip install prophet

Let us now revisit the code –

1. clsConfig.py ( This native Python script contains the configuration entries. )


#####################################################
#### Written By: SATYAKI DE ####
#### Written On: 26-Jul-2021 ####
#### ####
#### Objective: This script is a config ####
#### file, contains all the keys for ####
#### for Prophet API. Application will ####
#### process these information & perform ####
#### the call to our newly developed with ####
#### APIs developed by Facebook & a open-source ####
#### project called "About-Corona". ####
#####################################################
import os
import platform as pl
class clsConfig(object):
Curr_Path = os.path.dirname(os.path.realpath(__file__))
os_det = pl.system()
if os_det == "Windows":
sep = '\\'
else:
sep = '/'
conf = {
'APP_ID': 1,
"URL":"https://corona-api.com/countries/",
"appType":"application/json",
"conType":"keep-alive",
"limRec": 10,
"CACHE":"no-cache",
"coList": "DE, IN, US, CA, GB, ID, BR",
"LOG_PATH":Curr_Path + sep + 'log' + sep,
"MAX_RETRY": 3,
"FNC": "NewConfirmed",
"TMS": "ReportedDate",
"FND": "NewDeaths"
}

view raw

clsConfig.py

hosted with ❤ by GitHub

We’re not going to discuss anything specific to this script.

2. clsL.py ( This native Python script logs the application. )


#####################################################
#### Written By: SATYAKI DE ####
#### Written On: 26-Jul-2021 ####
#### ####
#### Objective: This script is a log ####
#### file, that is useful for debugging purpose. ####
#### ####
#####################################################
import pandas as p
import os
import platform as pl
class clsL(object):
def __init__(self):
self.path = os.path.dirname(os.path.realpath(__file__))
def logr(self, Filename, Ind, df, subdir=None, write_mode='w', with_index='N'):
try:
x = p.DataFrame()
x = df
sd = subdir
os_det = pl.system()
if sd == None:
if os_det == "windows":
fullFileName = self.path + '\\' + Filename
else:
fullFileName = self.path + '/' + Filename
else:
if os_det == "windows":
fullFileName = self.path + '\\' + sd + '\\' + Filename
else:
fullFileName = self.path + '/' + sd + '/' + Filename
if (with_index == 'N'):
if ((Ind == 'Y') & (write_mode == 'w')):
x.to_csv(fullFileName, index=False)
else:
x.to_csv(fullFileName, index=False, mode=write_mode, header=None)
else:
if ((Ind == 'Y') & (write_mode == 'w')):
x.to_csv(fullFileName)
else:
x.to_csv(fullFileName, mode=write_mode, header=None)
return 0
except Exception as e:
y = str(e)
print(y)
return 3

view raw

clsL.py

hosted with ❤ by GitHub

Based on the operating system, the log class will capture potential information under the “log” directory in the form of csv for later reference purposes.

3. clsForecast.py ( This native Python script will clean & transform the data. )


##############################################
#### Written By: SATYAKI DE ####
#### Written On: 26-Jul-2021 ####
#### Modified On 26-Jul-2021 ####
#### ####
#### Objective: Calling Data Cleaning API ####
##############################################
import json
from clsConfig import clsConfig as cf
import requests
import logging
import time
import pandas as p
import clsL as cl
from prophet import Prophet
class clsForecast:
def __init__(self):
self.fnc = cf.conf['FNC']
self.fnd = cf.conf['FND']
self.tms = cf.conf['TMS']
def forecastNewConfirmed(self, srcDF, debugInd, varVa):
try:
fnc = self.fnc
tms = self.tms
var = varVa
debug_ind = debugInd
countryISO = ''
df_M = p.DataFrame()
dfWork = srcDF
# Initiating Log class
l = cl.clsL()
#Extracting the unique country name
unqCountry = dfWork['CountryCode'].unique()
for i in unqCountry:
countryISO = i.strip()
print('Country Name: ' + countryISO)
df_Comm = dfWork[[tms, fnc]]
l.logr('13.df_Comm_' + var + '.csv', debug_ind, df_Comm, 'log')
# Aligning as per Prophet naming convention
df_Comm.columns = ['ds', 'y']
l.logr('14.df_Comm_Mod_' + var + '.csv', debug_ind, df_Comm, 'log')
return df_Comm
except Exception as e:
x = str(e)
print(x)
logging.info(x)
df = p.DataFrame()
return df
def forecastNewDead(self, srcDF, debugInd, varVa):
try:
fnd = self.fnd
tms = self.tms
var = varVa
debug_ind = debugInd
countryISO = ''
df_M = p.DataFrame()
dfWork = srcDF
# Initiating Log class
l = cl.clsL()
#Extracting the unique country name
unqCountry = dfWork['CountryCode'].unique()
for i in unqCountry:
countryISO = i.strip()
print('Country Name: ' + countryISO)
df_Comm = dfWork[[tms, fnd]]
l.logr('17.df_Comm_' + var + '.csv', debug_ind, df_Comm, 'log')
# Aligning as per Prophet naming convention
df_Comm.columns = ['ds', 'y']
l.logr('18.df_Comm_Mod_' + var + '.csv', debug_ind, df_Comm, 'log')
return df_Comm
except Exception as e:
x = str(e)
print(x)
logging.info(x)
df = p.DataFrame()
return df

view raw

clsForecast.py

hosted with ❤ by GitHub

Let’s explore the critical snippet out of this script –

df_Comm = dfWork[[tms, fnc]]

Now, the application will extract only the relevant columns to proceed.

df_Comm.columns = ['ds', 'y']

It is now assigning specific column names, which is a requirement for prophet API.

4. clsCovidAPI.py ( This native Python script will call the Covid-19 API. )


##############################################
#### Written By: SATYAKI DE ####
#### Written On: 26-Jul-2021 ####
#### Modified On 26-Jul-2021 ####
#### ####
#### Objective: Calling Covid-19 API ####
##############################################
import json
from clsConfig import clsConfig as cf
import requests
import logging
import time
import pandas as p
import clsL as cl
class clsCovidAPI:
def __init__(self):
self.url = cf.conf['URL']
self.azure_cache = cf.conf['CACHE']
self.azure_con = cf.conf['conType']
self.type = cf.conf['appType']
self.typVal = cf.conf['coList']
self.max_retries = cf.conf['MAX_RETRY']
def searchQry(self, varVa, debugInd):
try:
url = self.url
api_cache = self.azure_cache
api_con = self.azure_con
type = self.type
typVal = self.typVal
max_retries = self.max_retries
var = varVa
debug_ind = debugInd
cnt = 0
df_M = p.DataFrame()
# Initiating Log class
l = cl.clsL()
payload = {}
strMsg = 'Input Countries: ' + str(typVal)
logging.info(strMsg)
headers = {}
countryList = typVal.split(',')
for i in countryList:
# Failed case retry
retries = 1
success = False
val = ''
try:
while not success:
# Getting response from web service
try:
df_conv = p.DataFrame()
strCountryUrl = url + str(i).strip()
print('Country: ' + str(i).strip())
print('Url: ' + str(strCountryUrl))
str1 = 'Url: ' + str(strCountryUrl)
logging.info(str1)
response = requests.request("GET", strCountryUrl, headers=headers, params=payload)
ResJson = response.text
#jdata = json.dumps(ResJson)
RJson = json.loads(ResJson)
df_conv = p.io.json.json_normalize(RJson)
df_conv.drop(['data.timeline'], axis=1, inplace=True)
df_conv['DummyKey'] = 1
df_conv.set_index('DummyKey')
l.logr('1.df_conv_' + var + '.csv', debug_ind, df_conv, 'log')
# Extracting timeline part separately
Rjson_1 = RJson['data']['timeline']
df_conv2 = p.io.json.json_normalize(Rjson_1)
df_conv2['DummyKey'] = 1
df_conv2.set_index('DummyKey')
l.logr('2.df_conv_timeline_' + var + '.csv', debug_ind, df_conv2, 'log')
# Doing Cross Join
df_fin = df_conv.merge(df_conv2, on='DummyKey', how='outer')
l.logr('3.df_fin_' + var + '.csv', debug_ind, df_fin, 'log')
# Merging with the previous Country Code data
if cnt == 0:
df_M = df_fin
else:
d_frames = [df_M, df_fin]
df_M = p.concat(d_frames)
cnt += 1
strCountryUrl = ''
if str(response.status_code)[:1] == '2':
success = True
else:
wait = retries * 2
print("retries Fail! Waiting " + str(wait) + " seconds and retrying!")
str_R1 = "retries Fail! Waiting " + str(wait) + " seconds and retrying!"
logging.info(str_R1)
time.sleep(wait)
retries += 1
# Checking maximum retries
if retries == max_retries:
success = True
raise Exception
except Exception as e:
x = str(e)
print(x)
logging.info(x)
pass
except Exception as e:
pass
l.logr('4.df_M_' + var + '.csv', debug_ind, df_M, 'log')
return df_M
except Exception as e:
x = str(e)
print(x)
logging.info(x)
df = p.DataFrame()
return df

view raw

clsCovidAPI.py

hosted with ❤ by GitHub

Let us explore the key snippet –

countryList = typVal.split(',')

The application will fetch individual country names into a list based on the input lists from the configure script.

response = requests.request("GET", strCountryUrl, headers=headers, params=payload)
ResJson = response.text

RJson = json.loads(ResJson)

df_conv = p.io.json.json_normalize(RJson)
df_conv.drop(['data.timeline'], axis=1, inplace=True)
df_conv['DummyKey'] = 1
df_conv.set_index('DummyKey')

The application will extract the elements & normalize the JSON & convert that to a pandas dataframe & also added one dummy column, which will use for the later purpose to merge the data from another set.

# Extracting timeline part separately
Rjson_1 = RJson['data']['timeline']

df_conv2 = p.io.json.json_normalize(Rjson_1)
df_conv2['DummyKey'] = 1
df_conv2.set_index('DummyKey')

Now, the application will take the nested element & normalize that as per granular level. Also, it added the dummy column to join both of these data together.

# Doing Cross Join
df_fin = df_conv.merge(df_conv2, on='DummyKey', how='outer')

The application will Merge both the data sets to get the complete denormalized data for our use cases.

# Merging with the previous Country Code data
if cnt == 0:
    df_M = df_fin
else:
    d_frames = [df_M, df_fin]
    df_M = p.concat(d_frames)

This entire deserializing execution happens per country. Hence, the above snippet will create an individual sub-group based on the country & later does union to all the sets.

if str(response.status_code)[:1] == '2':
    success = True
else:
    wait = retries * 2
    print("retries Fail! Waiting " + str(wait) + " seconds and retrying!")
    str_R1 = "retries Fail! Waiting " + str(wait) + " seconds and retrying!"
    logging.info(str_R1)
    time.sleep(wait)
    retries += 1

# Checking maximum retries
if retries == max_retries:
    success = True
    raise  Exception

If any calls to source API fails, the application will retrigger after waiting for a specific time until it reaches its maximum capacity.

5. callPredictCovidAnalysis.py ( This native Python script is the main one to predict the Covid. )


##############################################
#### Written By: SATYAKI DE ####
#### Written On: 26-Jul-2021 ####
#### Modified On 26-Jul-2021 ####
#### ####
#### Objective: Calling multiple API's ####
#### that including Prophet-API developed ####
#### by Facebook for future prediction of ####
#### Covid-19 situations in upcoming days ####
#### for world's major hotspots. ####
##############################################
import json
import clsCovidAPI as ca
from clsConfig import clsConfig as cf
import datetime
import logging
import clsL as cl
import clsForecast as f
from prophet import Prophet
from prophet.plot import plot_plotly, plot_components_plotly
import matplotlib.pyplot as plt
import pandas as p
# Disbling Warning
def warn(*args, **kwargs):
pass
import warnings
warnings.warn = warn
# Initiating Log class
l = cl.clsL()
# Helper Function that removes underscores
def countryDet(inputCD):
try:
countryCD = inputCD
if str(countryCD) == 'DE':
cntCD = 'Germany'
elif str(countryCD) == 'BR':
cntCD = 'Brazil'
elif str(countryCD) == 'GB':
cntCD = 'United Kingdom'
elif str(countryCD) == 'US':
cntCD = 'United States'
elif str(countryCD) == 'IN':
cntCD = 'India'
elif str(countryCD) == 'CA':
cntCD = 'Canada'
elif str(countryCD) == 'ID':
cntCD = 'Indonesia'
else:
cntCD = 'N/A'
return cntCD
except:
cntCD = 'N/A'
return cntCD
def plot_picture(inputDF, debug_ind, var, countryCD, stat):
try:
iDF = inputDF
# Lowercase the column names
iDF.columns = [c.lower() for c in iDF.columns]
# Determine which is Y axis
y_col = [c for c in iDF.columns if c.startswith('y')][0]
# Determine which is X axis
x_col = [c for c in iDF.columns if c.startswith('ds')][0]
# Data Conversion
iDF['y'] = iDF[y_col].astype('float')
iDF['ds'] = iDF[x_col].astype('datetime64[ns]')
# Forecast calculations
# Decreasing the changepoint_prior_scale to 0.001 to make the trend less flexible
m = Prophet(n_changepoints=20, yearly_seasonality=True, changepoint_prior_scale=0.001)
m.fit(iDF)
forecastDF = m.make_future_dataframe(periods=365)
forecastDF = m.predict(forecastDF)
l.logr('15.forecastDF_' + var + '_' + countryCD + '.csv', debug_ind, forecastDF, 'log')
df_M = forecastDF[['ds', 'yhat', 'yhat_lower', 'yhat_upper']]
l.logr('16.df_M_' + var + '_' + countryCD + '.csv', debug_ind, df_M, 'log')
#m.plot_components(df_M)
# Getting Full Country Name
cntCD = countryDet(countryCD)
# Draw forecast results
lbl = str(cntCD) + ' – Covid – ' + stat
m.plot(df_M, xlabel = 'Date', ylabel = lbl)
# Combine all graps in the same page
plt.title(f'Covid Forecasting')
plt.title(lbl)
plt.ylabel('Millions')
plt.show()
return 0
except Exception as e:
x = str(e)
print(x)
return 1
def countrySpecificDF(counryDF, val):
try:
countryName = val
df = counryDF
df_lkpFile = df[(df['CountryCode'] == val)]
return df_lkpFile
except:
df = p.DataFrame()
return df
def main():
try:
var1 = datetime.datetime.now().strftime("%Y-%m-%d_%H-%M-%S")
print('*' *60)
DInd = 'Y'
NC = 'New Confirmed'
ND = 'New Dead'
SM = 'data process Successful!'
FM = 'data process Failure!'
print("Calling the custom Package for large file splitting..")
print('Start Time: ' + str(var1))
countryList = str(cf.conf['coList']).split(',')
# Initiating Log Class
general_log_path = str(cf.conf['LOG_PATH'])
# Enabling Logging Info
logging.basicConfig(filename=general_log_path + 'CovidAPI.log', level=logging.INFO)
# Create the instance of the Covid API Class
x1 = ca.clsCovidAPI()
# Let's pass this to our map section
retDF = x1.searchQry(var1, DInd)
retVal = int(retDF.shape[0])
if retVal > 0:
print('Successfully Covid Data Extracted from the API-source.')
else:
print('Something wrong with your API-source!')
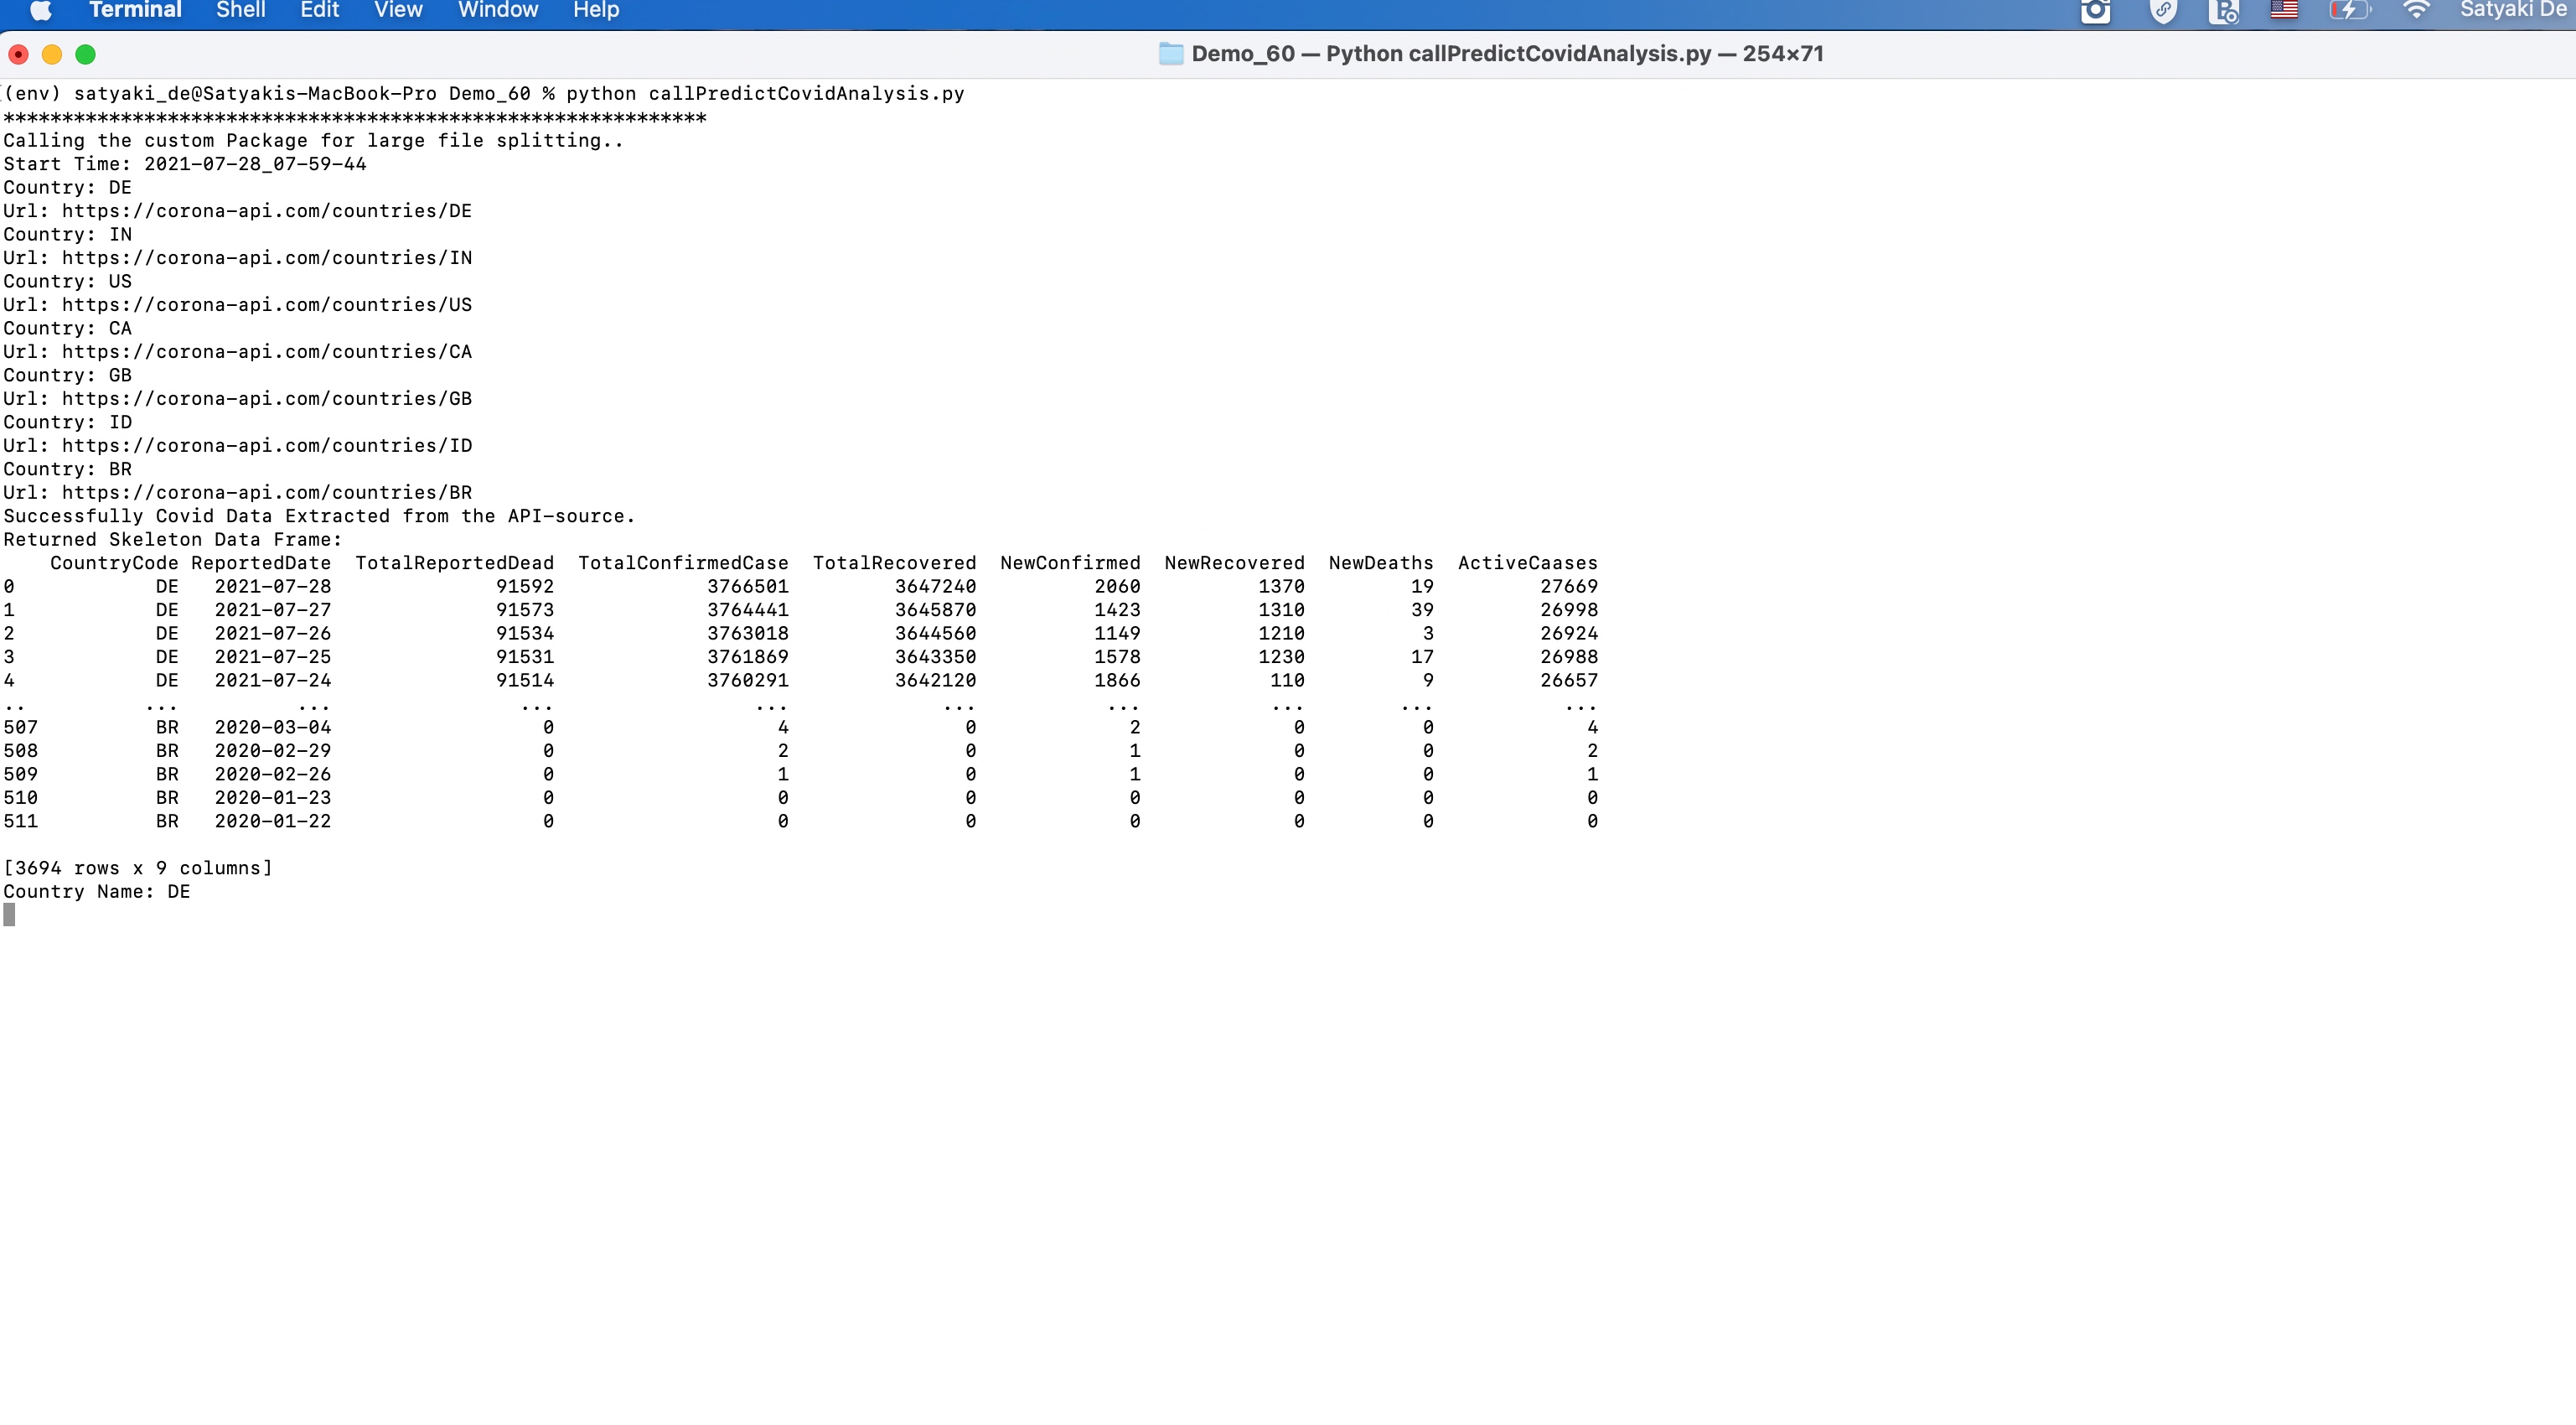
# Extracting Skeleton Data
df = retDF[['data.code', 'date', 'deaths', 'confirmed', 'recovered', 'new_confirmed', 'new_recovered', 'new_deaths', 'active']]
df.columns = ['CountryCode', 'ReportedDate', 'TotalReportedDead', 'TotalConfirmedCase', 'TotalRecovered', 'NewConfirmed', 'NewRecovered', 'NewDeaths', 'ActiveCaases']
df.dropna()
print('Returned Skeleton Data Frame: ')
print(df)
l.logr('5.df_' + var1 + '.csv', DInd, df, 'log')
# Working with forecast
# Create the instance of the Forecast API Class
x2 = f.clsForecast()
# Fetching each country name & then get the details
cnt = 6
for i in countryList:
try:
cntryIndiv = i.strip()
print('Country Porcessing: ' + str(cntryIndiv))
# Creating dataframe for each country
# Germany Main DataFrame
dfCountry = countrySpecificDF(df, cntryIndiv)
l.logr(str(cnt) + '.df_' + cntryIndiv + '_' + var1 + '.csv', DInd, dfCountry, 'log')
# Let's pass this to our map section
retDFGenNC = x2.forecastNewConfirmed(dfCountry, DInd, var1)
statVal = str(NC)
a1 = plot_picture(retDFGenNC, DInd, var1, cntryIndiv, statVal)
retDFGenNC_D = x2.forecastNewDead(dfCountry, DInd, var1)
statVal = str(ND)
a2 = plot_picture(retDFGenNC_D, DInd, var1, cntryIndiv, statVal)
cntryFullName = countryDet(cntryIndiv)
if (a1 + a2) == 0:
oprMsg = cntryFullName + ' ' + SM
print(oprMsg)
else:
oprMsg = cntryFullName + ' ' + FM
print(oprMsg)
# Resetting the dataframe value for the next iteration
dfCountry = p.DataFrame()
cntryIndiv = ''
oprMsg = ''
cntryFullName = ''
a1 = 0
a2 = 0
statVal = ''
cnt += 1
except Exception as e:
x = str(e)
print(x)
var2 = datetime.datetime.now().strftime("%Y-%m-%d_%H-%M-%S")
print('End Time: ' + str(var2))
print('*' *60)
except Exception as e:
x = str(e)
if __name__ == "__main__":
main()

Let us explore the key snippet –

def countryDet(inputCD):
    try:
        countryCD = inputCD

        if str(countryCD) == 'DE':
            cntCD = 'Germany'
        elif str(countryCD) == 'BR':
            cntCD = 'Brazil'
        elif str(countryCD) == 'GB':
            cntCD = 'United Kingdom'
        elif str(countryCD) == 'US':
            cntCD = 'United States'
        elif str(countryCD) == 'IN':
            cntCD = 'India'
        elif str(countryCD) == 'CA':
            cntCD = 'Canada'
        elif str(countryCD) == 'ID':
            cntCD = 'Indonesia'
        else:
            cntCD = 'N/A'

        return cntCD
    except:
        cntCD = 'N/A'

        return cntCD

The application is extracting the full country name based on ISO country code.

# Lowercase the column names
iDF.columns = [c.lower() for c in iDF.columns]
# Determine which is Y axis
y_col = [c for c in iDF.columns if c.startswith('y')][0]
# Determine which is X axis
x_col = [c for c in iDF.columns if c.startswith('ds')][0]

# Data Conversion
iDF['y'] = iDF[y_col].astype('float')
iDF['ds'] = iDF[x_col].astype('datetime64[ns]')

The above script will convert all the column names in lower letters & then convert & cast them with the appropriate data type.

# Forecast calculations
# Decreasing the changepoint_prior_scale to 0.001 to make the trend less flexible
m = Prophet(n_changepoints=20, yearly_seasonality=True, changepoint_prior_scale=0.001)
m.fit(iDF)

forecastDF = m.make_future_dataframe(periods=365)

forecastDF = m.predict(forecastDF)

l.logr('15.forecastDF_' + var + '_' + countryCD + '.csv', debug_ind, forecastDF, 'log')

df_M = forecastDF[['ds', 'yhat', 'yhat_lower', 'yhat_upper']]

l.logr('16.df_M_' + var + '_' + countryCD + '.csv', debug_ind, df_M, 'log')

The above snippet will use the machine-learning driven prophet-API, where the application will fit the model & then predict based on the existing data for a year. Also, we’ve identified the number of changepoints. By default, the prophet-API adds 25 changepoints to the initial 80% of the data set that trend is less flexible. 

Prophet allows you to adjust the trend in case there is an overfit or underfit. changepoint_prior_scale helps adjust the strength of the movement & decreasing the changepoint_prior_scale to 0.001 to make it less flexible.

def countrySpecificDF(counryDF, val):
    try:
        countryName = val
        df = counryDF

        df_lkpFile = df[(df['CountryCode'] == val)]

        return df_lkpFile
    except:
        df = p.DataFrame()

        return df

The application is fetching & creating the country-specific dataframe.

for i in countryList:
    try:
        cntryIndiv = i.strip()

        print('Country Porcessing: ' + str(cntryIndiv))

        # Creating dataframe for each country
        # Germany Main DataFrame
        dfCountry = countrySpecificDF(df, cntryIndiv)
        l.logr(str(cnt) + '.df_' + cntryIndiv + '_' + var1 + '.csv', DInd, dfCountry, 'log')

        # Let's pass this to our map section
        retDFGenNC = x2.forecastNewConfirmed(dfCountry, DInd, var1)

        statVal = str(NC)

        a1 = plot_picture(retDFGenNC, DInd, var1, cntryIndiv, statVal)

        retDFGenNC_D = x2.forecastNewDead(dfCountry, DInd, var1)

        statVal = str(ND)

        a2 = plot_picture(retDFGenNC_D, DInd, var1, cntryIndiv, statVal)

        cntryFullName = countryDet(cntryIndiv)

        if (a1 + a2) == 0:
            oprMsg = cntryFullName + ' ' + SM
            print(oprMsg)
        else:
            oprMsg = cntryFullName + ' ' + FM
            print(oprMsg)

        # Resetting the dataframe value for the next iteration
        dfCountry = p.DataFrame()
        cntryIndiv = ''
        oprMsg = ''
        cntryFullName = ''
        a1 = 0
        a2 = 0
        statVal = ''

        cnt += 1
    except Exception as e:
        x = str(e)
        print(x)

The above snippet will call the function to predict the data & then predict the visual representation based on plotting the data points.


Let us run the application –

Application Run

And, it will generate the visual representation as follows –

Application Run – Continue

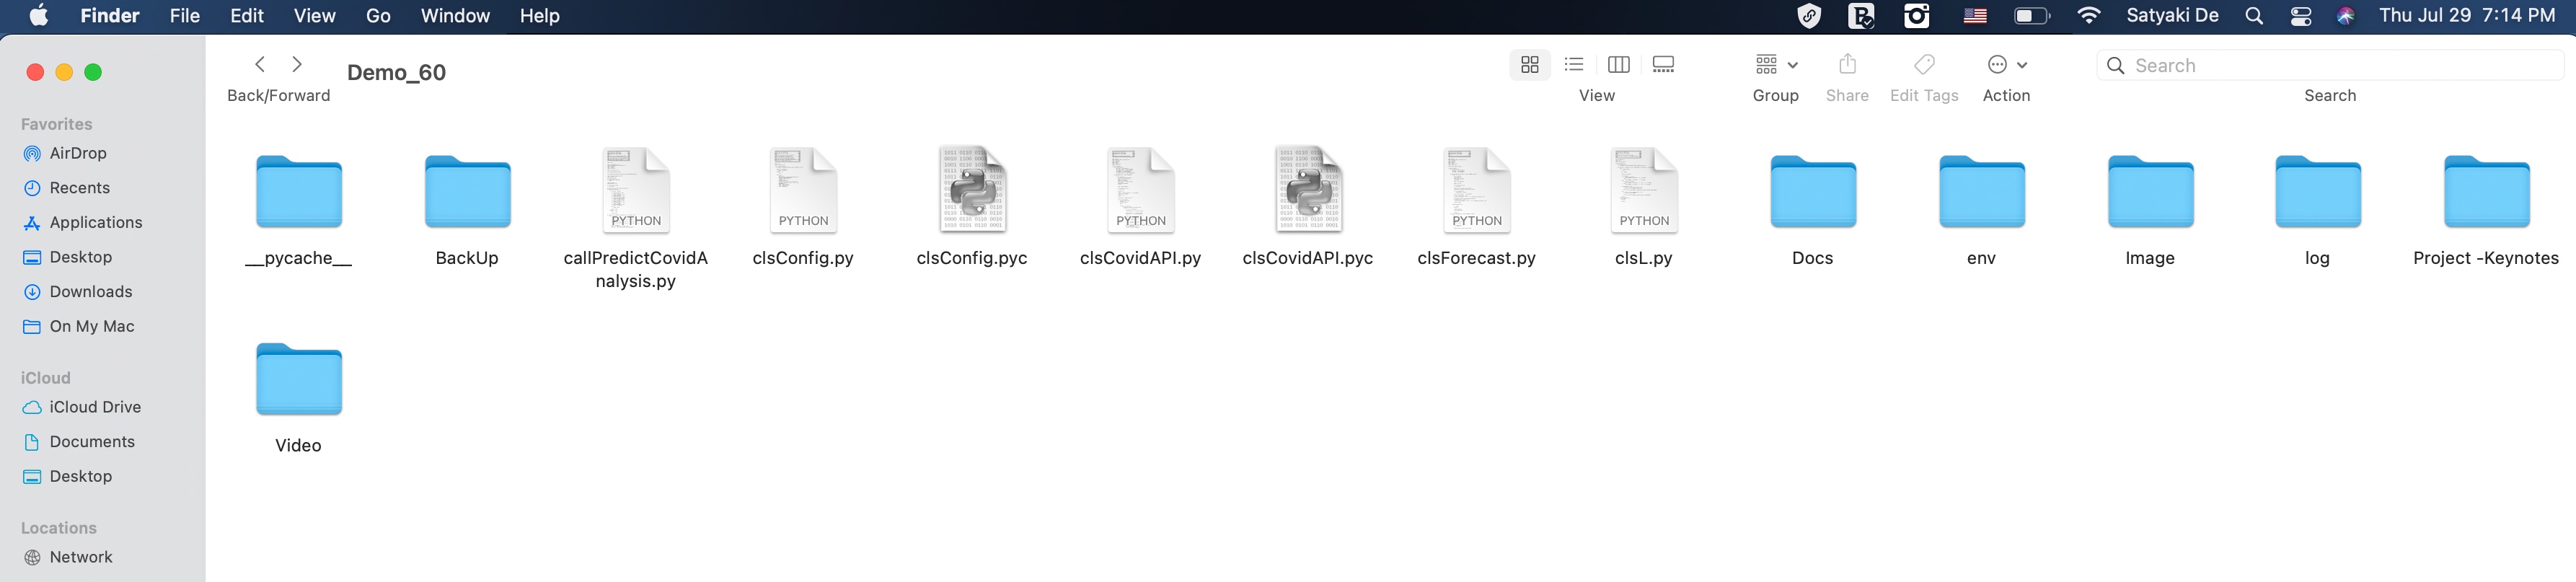
And, here is the folder structure –

Directory Structure

Let’s explore the comparison study & try to find out the outcome –

Option – 1
Option – 2
Option – 3
Option -4

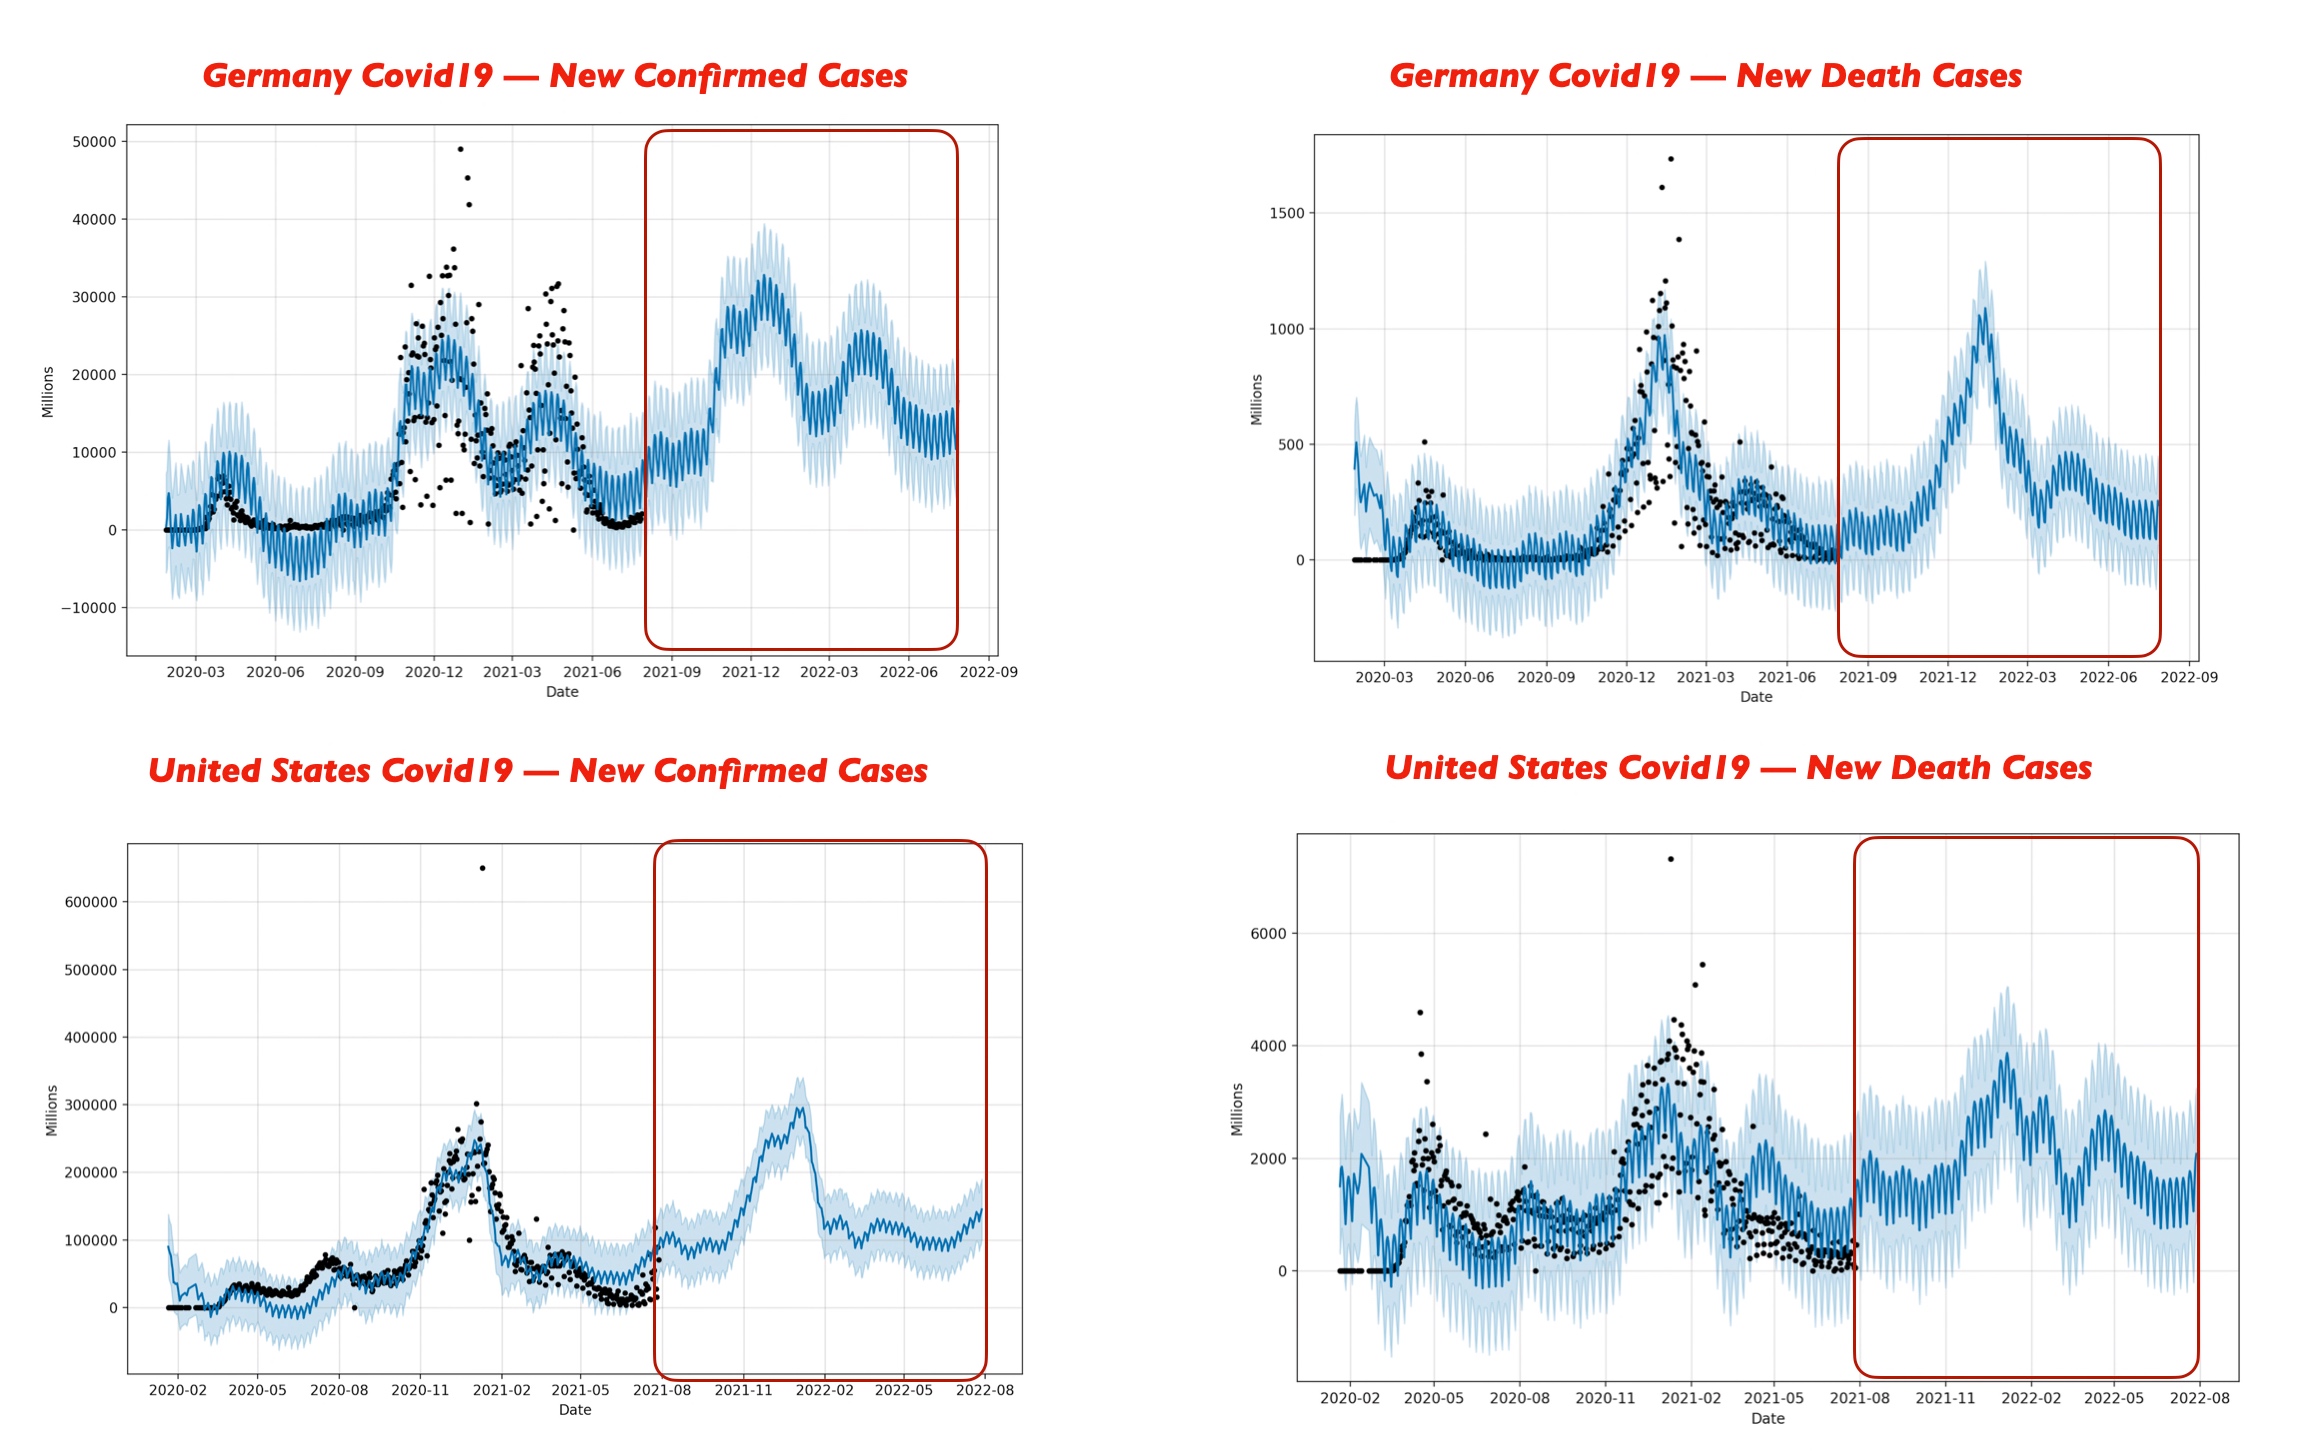
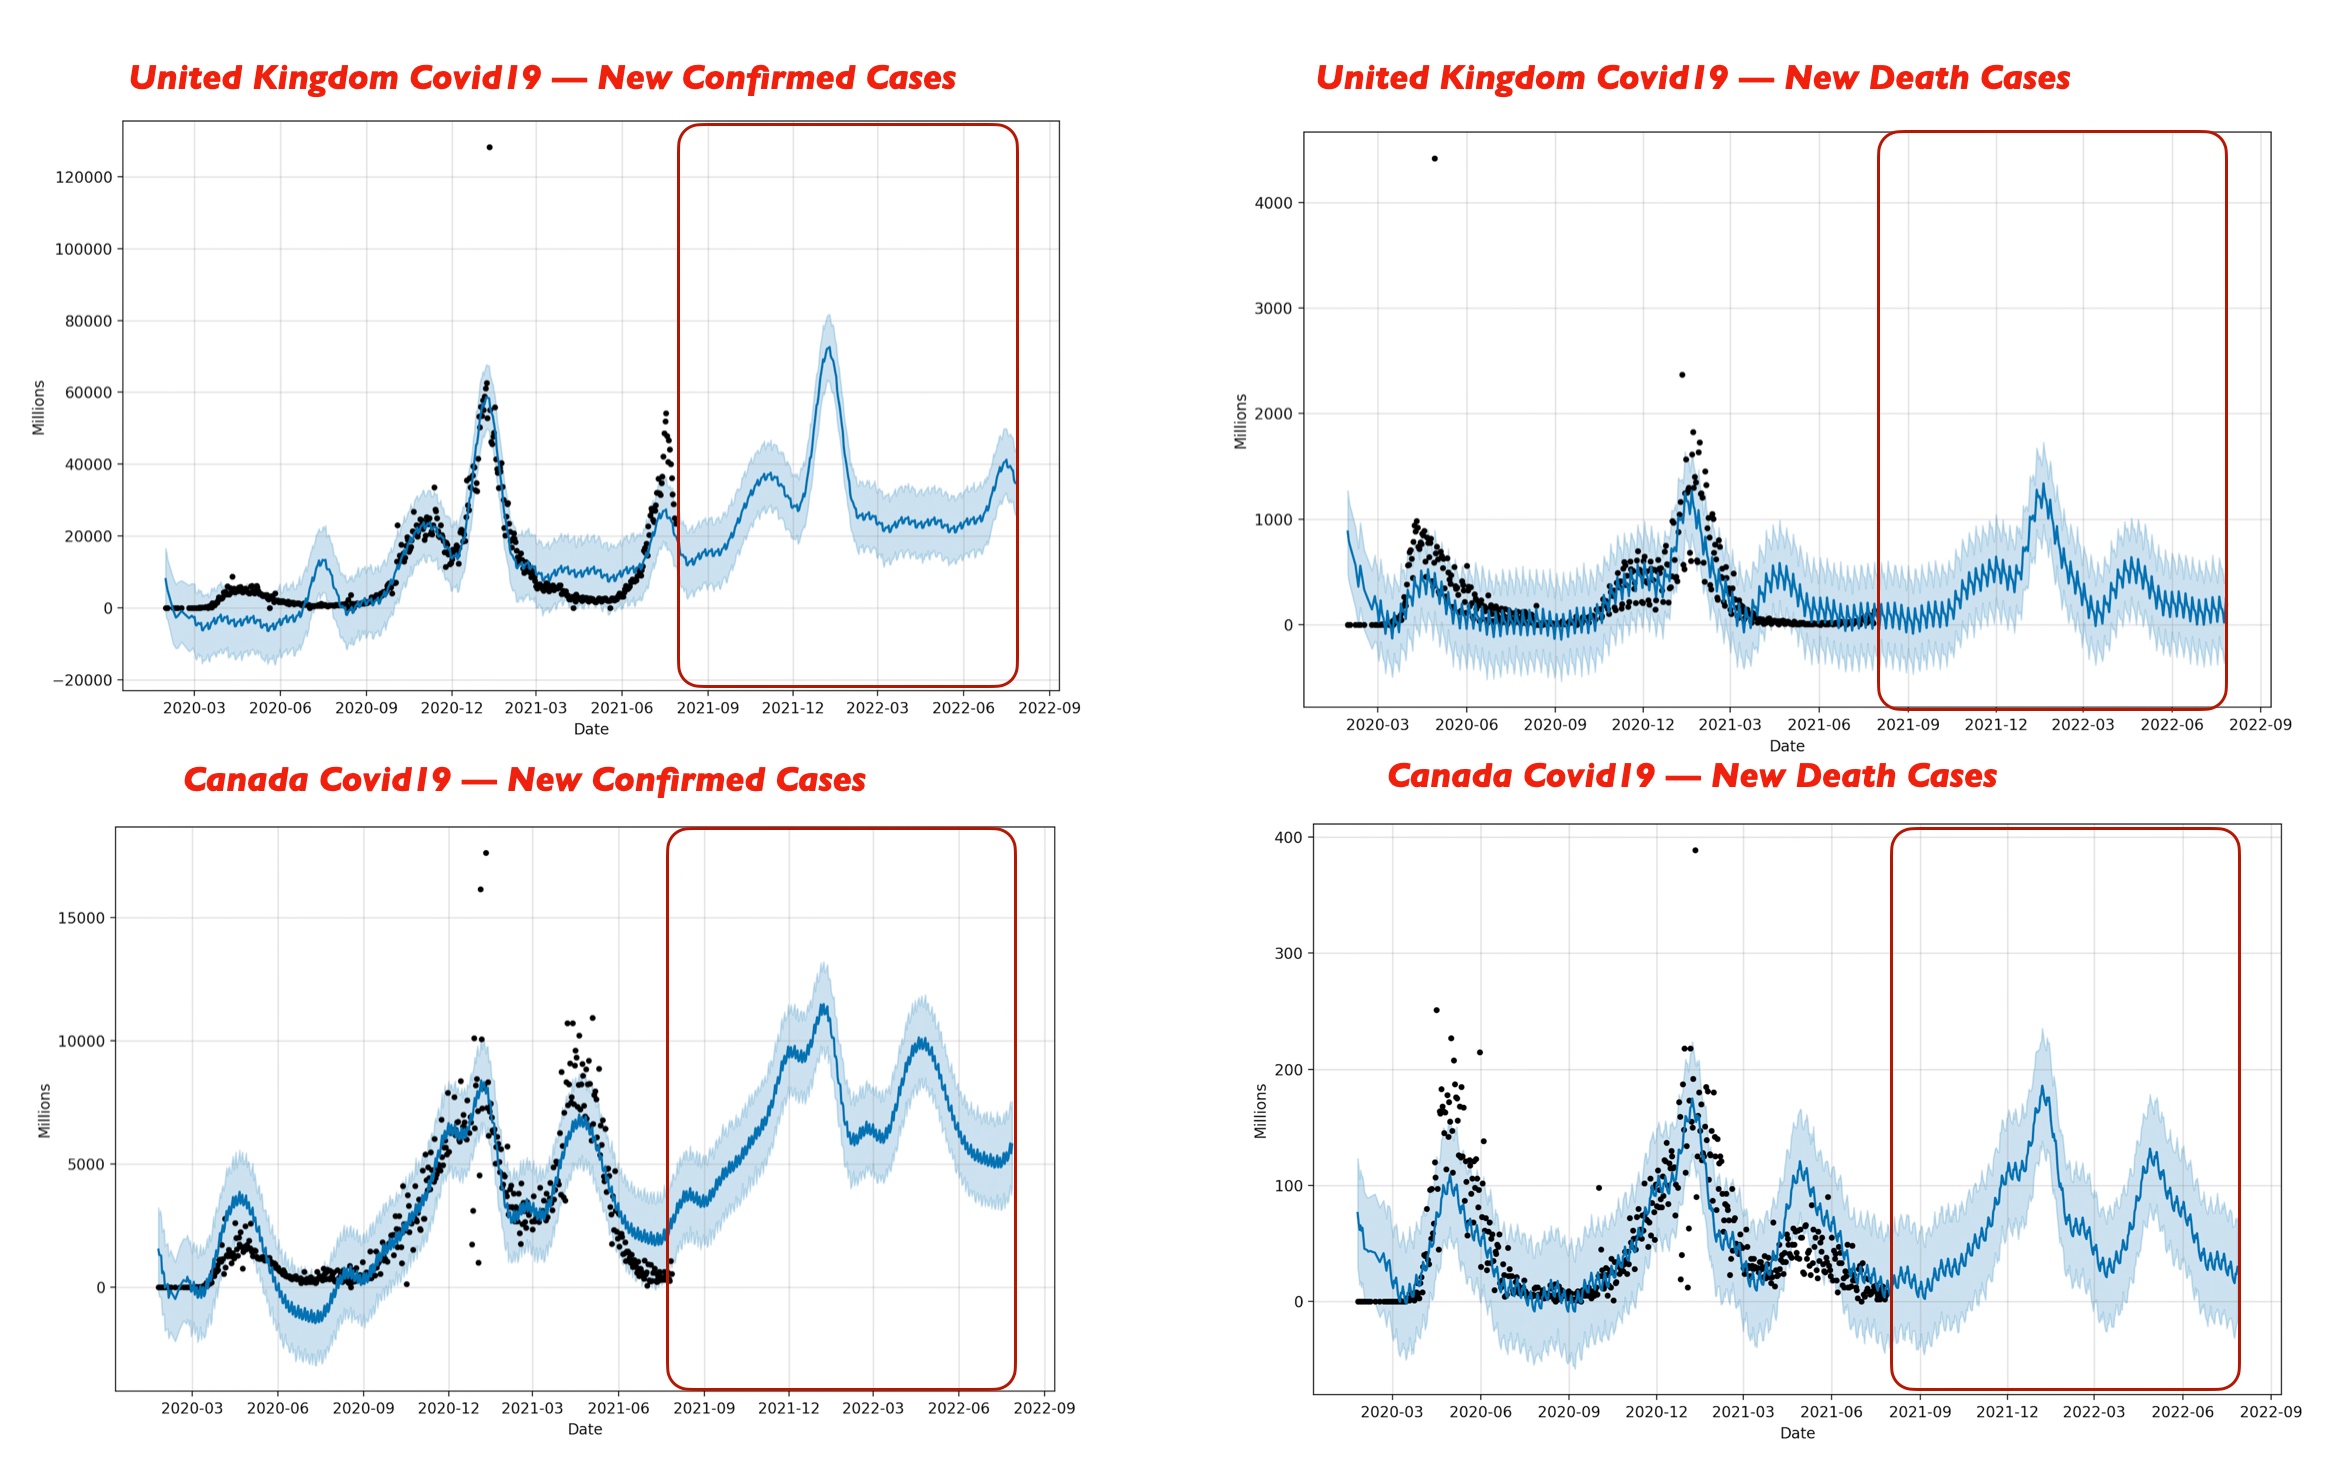
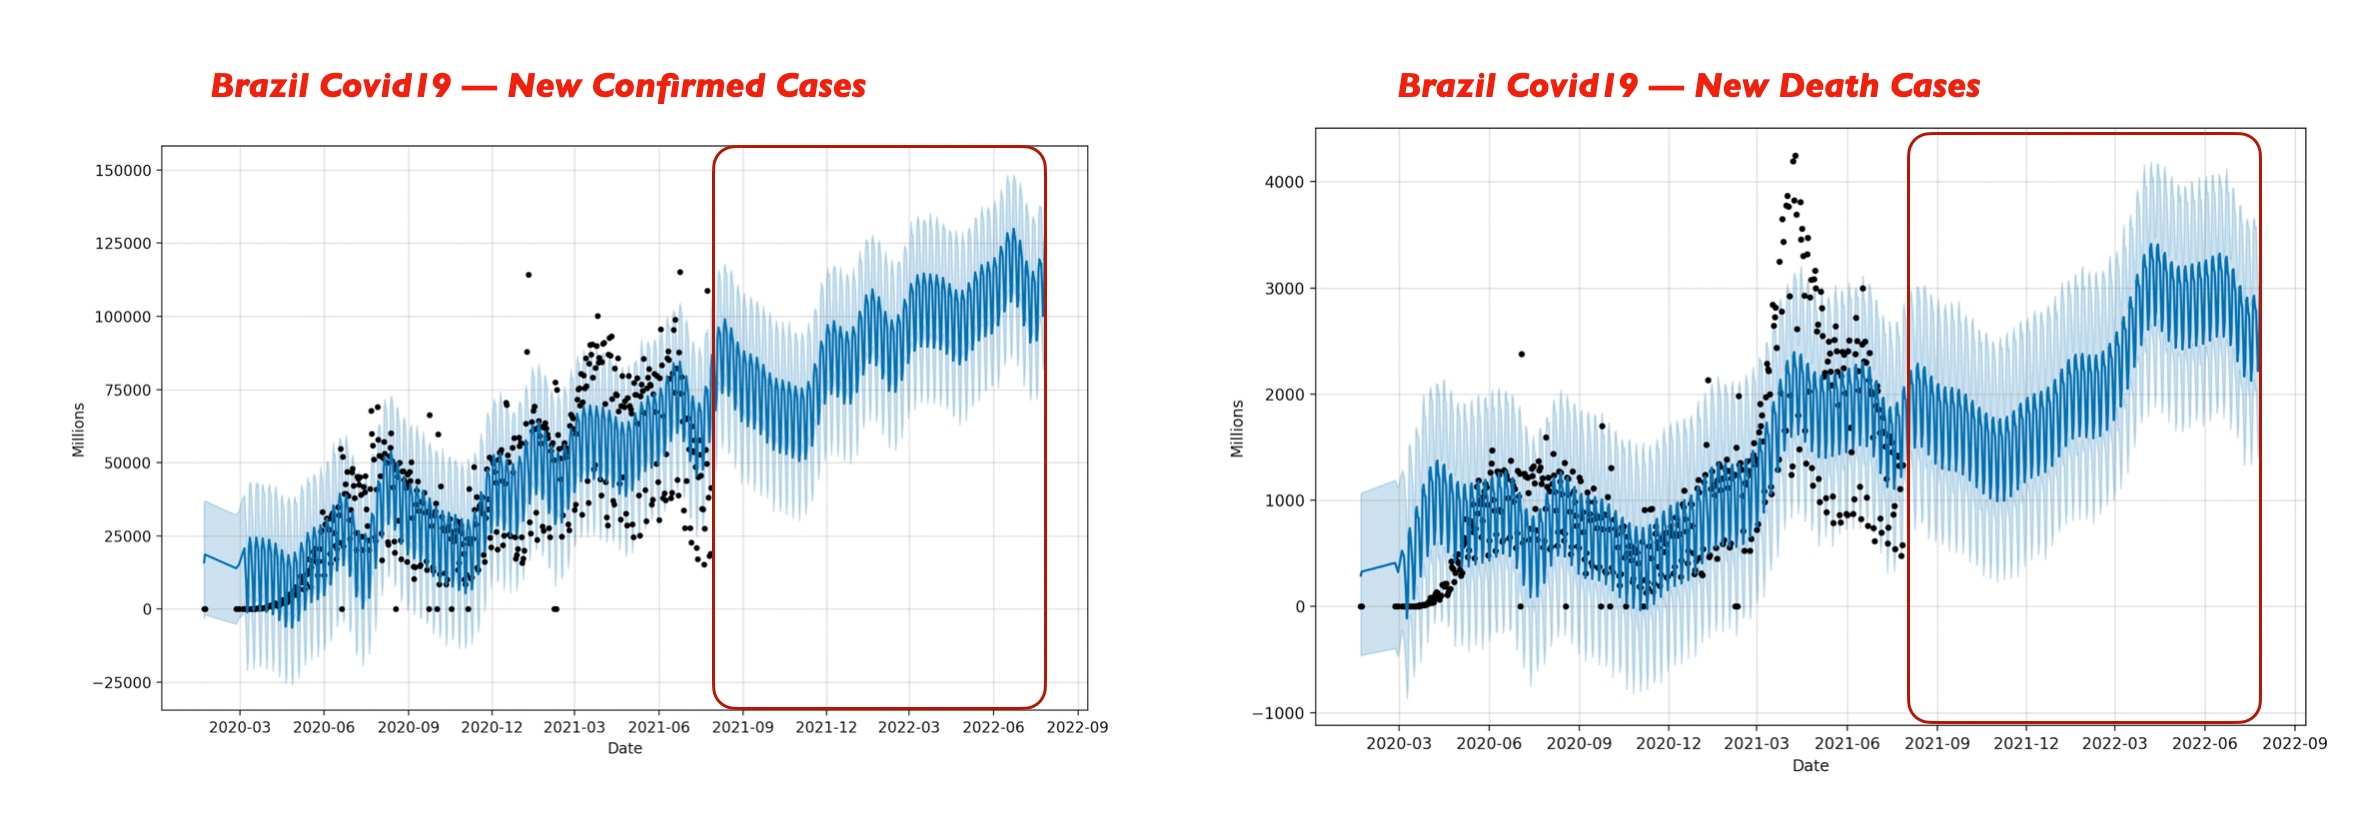
Let us analyze from the above visual data-point.


Conclusion:

Let’s explore the comparison study & try to find out the outcome –

  1. India may see a rise of new covid cases & it might cross the mark 400,000 during June 2022 & would be the highest among the countries that we’ve considered here including India, Indonesia, Germany, US, UK, Canada & Brazil. The second worst affected country might be the US during the same period. The third affected country will be Indonesia during the same period.
  2. Canada will be the least affected country during June 2022. The figure should be within 12,000.
  3. However, death case wise India is not only the leading country. The US, India & Brazil will see almost 4000 or slightly over the 4000 marks.

So, we’ve done it.


You will get the complete codebase in the following Github link.

I’ll bring some more exciting topic in the coming days from the Python verse.

Till then, Happy Avenging! 😀


Note: All the data & scenario posted here are representational data & scenarios & available over the internet & for educational purpose only.

One more thing you need to understand is that this prediction based on limited data points. The actual event may happen differently. Ideally, countries are taking a cue from this kind of analysis & are initiating appropriate measures to avoid the high-curve. And, that is one of the main objective of time series analysis.

There is always a room for improvement of this kind of models & the solution associated with it. I’ve shown the basic ways to achieve the same for the education purpose only.

Calling Twilio Voice API to deliver custom voice calls to the subscriber

Hello Guys!

It’s time to share another installment of fun & exciting posts from the world of Python-verse.

Today, We’ll be leveraging the Twilio voice API to send custom messages through phone calls directly. This service is beneficial on many occasions, including alerting the customer of potential payment reminders to pending product delivery calls to warehouse managers.


Dependent Packages:

Let us explore what packages we need for this –

Dependent Package Installation

The commands for your reference –

pip install twilio
pip install pandas

Also, you need to subscribe/register in Twilio. I’ve already shown you what to do about that. You can refer to my old post to know more about it. However, you need to reserve one phone number from which you will be calling your customers.

Buying phone numbers

As you can see, I’ve reserved one phone number to demonstrate this use case.


Let us explore the key codebase –

  1. clsVoiceAPI.py (Main class invoking the voice API)


##############################################
#### Written By: SATYAKI DE ####
#### Written On: 30-Mar-2021 ####
#### Modified On 30-Mar-2021 ####
#### ####
#### Objective: Calling Twilio Voice API ####
##############################################
import json
from clsConfig import clsConfig as cf
import logging
import os
from twilio.rest import Client
class clsVoiceAPI:
def __init__(self):
self.account_sid = cf.conf['TWILIO_ACCOUNT_SID']
self.auth_token = cf.conf['TWILIO_AUTH_TOKEN']
self.from_phone = cf.conf['FROM_PHONE']
self.to_phone = cf.conf['TO_PHONE']
def sendCall(self, msg):
try:
account_sid = self.account_sid
auth_token = self.auth_token
from_phone = self.from_phone
to_phone = self.to_phone
client = Client(account_sid, auth_token)
call = client.calls.create(
twiml='<Response><Say>' + str(msg) + '</Say></Response>',
to=str(from_phone),
from_=str(to_phone)
)
resTokenOutput = call.sid
print('Final Respone: ' + str(resTokenOutput))
resToken = 0
return resToken
except Exception as e:
x = str(e)
resToken = 1
print(x)
logging.info(x)
return resToken

view raw

clsVoiceAPI.py

hosted with ❤ by GitHub

Key snippets from the above codebase –

call = client.calls.create(
                            twiml='<Response><Say>' + str(msg) + '</Say></Response>',
                            to='+18048048844',
                            from_='+19999990396'
                        )

We’re invoking the Twilio API in the above block by giving both the calling & Callee numbers. And, we’re receiving the desired messages from our primary calling program, which the IVR will spell while calling to the customers.

2. callTwilioVoice.py (Main calling script)


#########################################################
#### Written By: SATYAKI DE ####
#### Written On: 06-Mar-2021 ####
#### Modified On 07-Mar-2021 ####
#### ####
#### Objective: Main calling scripts – ####
#### This Python script will consume an ####
#### source API data from Azure-Cloud & publish the ####
#### data into an Oracle Streaming platform, ####
#### which is compatible with Kafka. Later, another ####
#### consumer app will read the data from the stream.####
#########################################################
from clsConfig import clsConfig as cf
import clsL as cl
import logging
import datetime
import clsVoiceAPI as ca
# Disbling Warning
def warn(*args, **kwargs):
pass
import warnings
warnings.warn = warn
# Lookup functions from
# Azure cloud SQL DB
var = datetime.datetime.now().strftime("%Y-%m-%d_%H-%M-%S")
def main():
try:
# Declared Variable
ret_1 = 0
debug_ind = 'Y'
res_2 = ''
# Defining Generic Log File
general_log_path = str(cf.conf['LOG_PATH'])
# Enabling Logging Info
logging.basicConfig(filename=general_log_path + 'TwillioAPICall.log', level=logging.INFO)
# Initiating Log Class
l = cl.clsL()
# Moving previous day log files to archive directory
log_dir = cf.conf['LOG_PATH']
tmpR0 = "*" * 157
logging.info(tmpR0)
tmpR9 = 'Start Time: ' + str(var)
logging.info(tmpR9)
logging.info(tmpR0)
print()
print("Log Directory::", log_dir)
tmpR1 = 'Log Directory::' + log_dir
logging.info(tmpR1)
print('Welcome to the Twilio Voice Calling Program: ')
print('*' * 160)
print()
# Provide a short input text for calls
voiceCallText = 'Voice From Satyaki, Welcome to the Python World!'
# Create the instance of the Twilio Voice API Class
x1 = ca.clsVoiceAPI()
# Let's pass this to our map section
resSID = x1.sendCall(voiceCallText)
if resSID == 0:
print('Successfully send Audio Message!')
else:
print('Failed to send Audio Message!')
print()
print('Finished Sending Automated Calls..')
print("*" * 160)
logging.info('FFinished Sending Automated Calls..')
logging.info(tmpR0)
tmpR10 = 'End Time: ' + str(var)
logging.info(tmpR10)
logging.info(tmpR0)
except ValueError as e:
print(str(e))
print("Invalid option!")
logging.info("Invalid option!")
except Exception as e:
print("Top level Error: args:{0}, message{1}".format(e.args, e.message))
if __name__ == "__main__":
main()

Key snippets from the above codebase –

        # Create the instance of the Twilio Voice API Class
        x1 = ca.clsVoiceAPI()

        # Let's pass this to our map section
        resSID = x1.sendCall(voiceCallText)

As you can see, we’re first instantiating the class & then calling the method from it by providing the appropriate messages that will eventually deliver to our customer. You can configure dynamic content & pass it to this class.


Let us explore the directory structure –

Directory Structures

Let us see how it runs –

Running Applications

You need to make sure that you are checking your balance of your Twilio account diligently.

Checking Balance

And, here is the sneak peak of how it looks like in an video –

Actual execution

For more information on IVR, please check the following link.


Please find the git details in this link.

So, finally, we have done it.

I’ll bring some more exciting topic in the coming days from the Python verse.

Till then, Happy Avenging! 😀

Note: All the data & scenario posted here are representational data & scenarios & available over the internet & for educational purpose only.

Creating a dynamic response of an API/Microservice

Hello Guys!

Today, I’m going to discuss a potential use case, where on many occasions, different teams need almost similar kinds of data through API. However, they are not identical. Creating a fresh API/Microservice after following-up with many processes will take significant time.

What if we can create an API in such a way so that we can get the response dynamically without needing to make another one. In this post, we’ll be demonstrating a similar approach.

I’ll be using open-source Covid-API, which will be useful for several posts starting from this one.

You will get plenty of useful data from here.

We’ve chosen the following one for our use case –

API-Reference

Let’s explore the sample data first.

[
   {
      "date":20210207,
      "state":"AK",
      "positive":53279.0,
      "probableCases":null,
      "negative":null,
      "pending":null,
      "totalTestResultsSource":"totalTestsViral",
      "totalTestResults":1536911.0,
      "hospitalizedCurrently":44.0,
      "hospitalizedCumulative":1219.0,
      "inIcuCurrently":null,
      "inIcuCumulative":null,
      "onVentilatorCurrently":11.0,
      "onVentilatorCumulative":null,
      "recovered":null,
      "dataQualityGrade":"A",
      "lastUpdateEt":"2\/5\/2021 03:59",
      "dateModified":"2021-02-05T03:59:00Z",
      "checkTimeEt":"02\/04 22:59",
      "death":279.0,
      "hospitalized":1219.0,
      "dateChecked":"2021-02-05T03:59:00Z",
      "totalTestsViral":1536911.0,
      "positiveTestsViral":64404.0,
      "negativeTestsViral":1470760.0,
      "positiveCasesViral":null,
      "deathConfirmed":null,
      "deathProbable":null,
      "totalTestEncountersViral":null,
      "totalTestsPeopleViral":null,
      "totalTestsAntibody":null,
      "positiveTestsAntibody":null,
      "negativeTestsAntibody":null,
      "totalTestsPeopleAntibody":null,
      "positiveTestsPeopleAntibody":null,
      "negativeTestsPeopleAntibody":null,
      "totalTestsPeopleAntigen":null,
      "positiveTestsPeopleAntigen":null,
      "totalTestsAntigen":null,
      "positiveTestsAntigen":null,
      "fips":"02",
      "positiveIncrease":0,
      "negativeIncrease":0,
      "total":53279,
      "totalTestResultsIncrease":0,
      "posNeg":53279,
      "deathIncrease":0,
      "hospitalizedIncrease":0,
      "hash":"07a5d43f958541e9cdabb5ea34c8fb481835e130",
      "commercialScore":0,
      "negativeRegularScore":0,
      "negativeScore":0,
      "positiveScore":0,
      "score":0,
      "grade":""
   }
]

Let’s take two cases. One, where one service might need to access all the elements, there might be another, where some other service requires specific details.

Let’s explore the code base first –

  1. init.py ( This native Python-based azure-function that will consume streaming data & dynamic API response. )
###########################################
#### Written By: SATYAKI DE            ####
#### Written On: 06-Feb-2021           ####
#### Package Flask package needs to    ####
#### install in order to run this      ####
#### script.                           ####
####                                   ####
#### Objective: Main Calling scripts.  ####
####                                   ####
#### However, to meet the functionality####
#### we've enhanced as per our logic.  ####
###########################################

import logging
import json
import requests
import os
import pandas as p
import numpy as np

import azure.functions as func


def main(req: func.HttpRequest) -> func.HttpResponse:
    logging.info('Dynamic-Covid-Status HTTP trigger function processed a request.')

    try:

        # Application Variable
        url = os.environ['URL']
        appType = os.environ['appType']
        conType = os.environ['conType']

        # API-Configuration
        payload={}
        headers = {
            "Connection": conType,
            "Content-Type": appType
        }

        # Validating input parameters
        typeSel = req.params.get('typeSel')
        if not typeSel:
            try:
                req_body = req.get_json()
            except ValueError:
                pass
            else:
                typeSel = req_body.get('typeSel')
        
        typeVal = req.params.get('typeVal')
        if not typeVal:
            try:
                req_body = req.get_json()
            except ValueError:
                pass
            else:
                typeVal = req_body.get('typeVal')

        # Printing Key-Element Values
        str1 = 'typeSel: ' + str(typeSel)
        logging.info(str1)

        str2 = 'typeVal: ' + str(typeVal)
        logging.info(str2)

        # End of API-Inputs

        # Getting Covid data from the REST-API
        response = requests.request("GET", url, headers=headers, data=payload)
        ResJson  = response.text

        if typeSel == '*':
            if typeVal != '':
                # Converting it to Json
                jdata = json.loads(ResJson)

                df_ret = p.io.json.json_normalize(jdata)
                df_ret.columns = df_ret.columns.map(lambda x: x.split(".")[-1])

                rJson = df_ret.to_json(orient ='records') 

                return func.HttpResponse(rJson, status_code=200)
            else:
                x_stat = 'Failed'
                x_msg = 'Important information is missing for all values!'

                rJson = {
                    "status": x_stat,
                    "details": x_msg
                }

                xval = json.dumps(rJson)
                return func.HttpResponse(xval, status_code=200)
        elif typeSel == 'Cols':
            if typeVal != '':
                # Converting it to Json
                jdata = json.loads(ResJson)

                df_ret = p.io.json.json_normalize(jdata)
                df_ret.columns = df_ret.columns.map(lambda x: x.split(".")[-1])

                # Fetching for the selected columns
                # Extracting the columns from the list
                lstHead = []

                listX = typeVal.split (",")

                for i in listX:
                    lstHead.append(str(i).strip())

                str3 = 'Main List: ' + str(lstHead)
                logging.info(str3)

                slice_df = df_ret[np.intersect1d(df_ret.columns, lstHead)]
                rJson = slice_df.to_json(orient ='records') 
                
                return func.HttpResponse(rJson, status_code=200)
            else:
                x_stat = 'Failed'
                x_msg = 'Important information is missing for selected values!'

                rJson = {
                    "status": x_stat,
                    "details": x_msg
                }

                xval = json.dumps(rJson)
                return func.HttpResponse(xval, status_code=200)
        else:
            x_stat = 'Failed'
            x_msg = 'Important information is missing for typeSel!'

            rJson = {
                "status": x_stat,
                "details": x_msg
            }

            xval = json.dumps(rJson)
            return func.HttpResponse(xval, status_code=200)
    except Exception as e:
        x_msg = str(e)
        x_stat = 'Failed'

        rJson = {
                    "status": x_stat,
                    "details": x_msg
                }

        xval = json.dumps(rJson)
        return func.HttpResponse(xval, status_code=200)

And, Inside the azure portal it looks like –

Dynamic Function inside the Azure portal

Let’s explain the key snippet –

jdata = json.loads(ResJson)

df_ret = p.io.json.json_normalize(jdata)
df_ret.columns = df_ret.columns.map(lambda x: x.split(".")[-1])

rJson = df_ret.to_json(orient ='records') 

return func.HttpResponse(rJson, status_code=200)

In the above lines, we’re converting the response & organizing it to a pandas dataframe before converting the response to JSON.

# Fetching for the selected columns
# Extracting the columns from the list
lstHead = []

listX = typeVal.split (",")

for i in listX:
    lstHead.append(str(i).strip())

str3 = 'Main List: ' + str(lstHead)
logging.info(str3)

#slice_df = df_ret[df_ret.columns.intersection(lstHead)]
slice_df = df_ret[np.intersect1d(df_ret.columns, lstHead)]

For the second case, the above additional logic will play a significant part. Based on the supplied input in the typeVal attribute, this time, the new response will display accordingly.

Let’s see how it looks –

Azure function in Visual Studio Code
<p value="<amp-fit-text layout="fixed-height" min-font-size="6" max-font-size="72" height="80">Let's test it using Postman -Let’s test it using Postman –

Case 1 (For all the columns):

For all elements

And, the formatted output is as follows –

Formatted output for all elements

Case 2 (For selected columns):

For selected elements
<p value="<amp-fit-text layout="fixed-height" min-font-size="6" max-font-size="72" height="80">And, the formatted output is as follows -And, the formatted output is as follows –
Formatted output of Selected element case

You can find the code in the Github using the following link.


So, finally, we have done it.

I’ll bring some more exciting topic in the coming days from the Python verse.

Till then, Happy Avenging! 😀

Note: All the data & scenario posted here are representational data & scenarios & available over the internet & for educational purpose only.

Performance improvement of Python application programming

Hello guys,

Today, I’ll be demonstrating a short but significant topic. There are widespread facts that, on many occasions, Python is relatively slower than other strongly typed programming languages like C++, Java, or even the latest version of PHP.

I found a relatively old post with a comparison shown between Python and the other popular languages. You can find the details at this link.

However, I haven’t verified the outcome. So, I can’t comment on the final statistics provided on that link.

My purpose is to find cases where I can take certain tricks to improve performance drastically.

One preferable option would be the use of Cython. That involves the middle ground between C & Python & brings the best out of both worlds.

The other option would be the use of GPU for vector computations. That would drastically increase the processing power. Today, we’ll be exploring this option.

Let’s find out what we need to prepare our environment before we try out on this.

Step – 1 (Installing dependent packages):

pip install pyopencl
pip install plaidml-keras

So, we will be taking advantage of the Keras package to use our GPU. And, the screen should look like this –

Installation Process of Python-based Packages

Once we’ve installed the packages, we’ll configure the package showing on the next screen.

Configuration of Packages

For our case, we need to install pandas as we’ll be using numpy, which comes default with it.

Installation of supplemental packages

Let’s explore our standard snippet to test this use case.

Case 1 (Normal computational code in Python):

##############################################
#### Written By: SATYAKI DE               ####
#### Written On: 18-Jan-2020              ####
####                                      ####
#### Objective: Main calling scripts for  ####
#### normal execution.                    ####
##############################################

import numpy as np
from timeit import default_timer as timer

def pow(a, b, c):
    for i in range(a.size):
         c[i] = a[i] ** b[i]

def main():
    vec_size = 100000000

    a = b = np.array(np.random.sample(vec_size), dtype=np.float32)
    c = np.zeros(vec_size, dtype=np.float32)

    start = timer()
    pow(a, b, c)
    duration = timer() - start

    print(duration)

if __name__ == '__main__':
    main()

Case 2 (GPU-based computational code in Python):

#################################################
#### Written By: SATYAKI DE                  ####
#### Written On: 18-Jan-2020                 ####
####                                         ####
#### Objective: Main calling scripts for     ####
#### use of GPU to speed-up the performance. ####
#################################################

import numpy as np
from timeit import default_timer as timer

# Adding GPU Instance
from os import environ
environ["KERAS_BACKEND"] = "plaidml.keras.backend"

def pow(a, b):
    return a ** b

def main():
    vec_size = 100000000

    a = b = np.array(np.random.sample(vec_size), dtype=np.float32)
    c = np.zeros(vec_size, dtype=np.float32)

    start = timer()
    c = pow(a, b)
    duration = timer() - start

    print(duration)

if __name__ == '__main__':
    main()

And, here comes the output for your comparisons –

Case 1 Vs Case 2:

Performance Comparisons

As you can see, there is a significant improvement that we can achieve using this. However, it has limited scope. Not everywhere you get the benefits. Until or unless Python decides to work on the performance side, you better need to explore either of the two options that I’ve discussed here (I didn’t mention a lot on Cython here. Maybe some other day.).

To get the codebase you can refer the following Github link.


So, finally, we have done it.

I’ll bring some more exciting topic in the coming days from the Python verse.

Till then, Happy Avenging! 😀

Note: All the data & scenario posted here are representational data & scenarios & available over the internet & for educational purpose only.

Creating a real-time dashboard from streaming data using Python

Hi Guys,

Today, I’ll demonstrate one of the fascinating ways to capture real-time streaming data in a dashboard. It is a dream for any developer who wants to build an application involving streaming data, API & a dashboard.

Why don’t we see our run to make this thread more interesting?

Real-Time Dashboard using streaming data

Today, I’ll be using the two most essential services to achieve that goal.

Ably

H2O-Wave

Let’s discuss brief about these two services.

  • Why I used “Ably” here?

One of my scenarios is to consume real-time currency data. Even after checking paid-API, I was not getting what I was looking for. Hence, I decided to use any service, which can mimics & publish my data as streaming data through a channel. Once published, I’ll consume the posted data into my application to create this new dashboard.

Using Ably, you can leverage their cloud platform to publish & consume data with the free developer account, which is sufficient for anyone.

To better understand this, we need to understand the basic concept of “pubsub”. Here is the important page from their side that I would like to embed for your reference –

Source: Ably

To know more about this, please refer to the following link.

  • Why I used “H2O-Wave” here?

Wave_H2O is a relatively brand new framework with some outstanding capabilities to visualize your data using native Python.

  • Pre-Steps:

We need to register Ably. Some of the useful screen that we should explore more –

API-Key Page

Successful creation of an App will generate the API-Key. Make sure that you note-down the channel details as well.

Quota Limit

The above page will capture the details of usage. Since this is a free subscription, you will be blocked once you consume your limit. However, for paid users, this is one of the vital pages to control their budget.

Message Published & Consumption Visuals

Like any other cloud service, you can check your message published or consumptions here on this page.

This is the main landing page for H2O-Wave –

H2O Wave

They have a quite many example snippet. However, these samples contain random data. Hence, these are relatively easier to implement. It would take quite some effort to tailor it for your need to implement that for real-life scenarios.

Some of the important links are as follows –

  1. H2O-Wave Tour
  2. GitHub

You need to install the following libraries in Python –

pip install ably
pip install h2o-wave

We’ve two scripts. We’re not going to discuss the publish streaming data script over here. We’ll be discussing only the consumption script, which will generate the dashboard as well. If you need, you can post your message. I’ll provide it.

1. dashboard_st.py ( This native Python script will consume streaming data & create live dashboard. )

##########################################################
#### Template Written By: H2O Wave                    ####
#### Enhanced with Streaming Data By: Satyaki De      ####
#### Base Version Enhancement On: 20-Dec-2020         ####
#### Modified On 26-Dec-2020                          ####
####                                                  ####
#### Objective: This script will consume real-time    ####
#### streaming data coming out from a hosted API      ####
#### sources using another popular third-party        ####
#### service named Ably. Ably mimics pubsub Streaming ####
#### concept, which might be extremely useful for     ####
#### any start-ups.                                   ####
##########################################################

import time
from h2o_wave import site, data, ui
from ably import AblyRest
import pandas as p
import json

class DaSeries:
    def __init__(self, inputDf):
        self.Df = inputDf
        self.count_row = inputDf.shape[0]
        self.start_pos = 0
        self.end_pos = 0
        self.interval = 1


    def next(self):
        try:
            # Getting Individual Element & convert them to Series
            if ((self.start_pos + self.interval) <= self.count_row):
                self.end_pos = self.start_pos + self.interval
            else:
                self.end_pos = self.start_pos + (self.count_row - self.start_pos)

            split_df = self.Df.iloc[self.start_pos:self.end_pos]

            if ((self.start_pos > self.count_row) | (self.start_pos == self.count_row)):
                pass
            else:
                self.start_pos = self.start_pos + self.interval

            x = float(split_df.iloc[0]['CurrentExchange'])
            dx = float(split_df.iloc[0]['Change'])

            # Emptying the exisitng dataframe
            split_df = p.DataFrame(None)

            return x, dx
        except:
            x = 0
            dx = 0

            return x, dx

class CategoricalSeries:
    def __init__(self, sourceDf):
        self.series = DaSeries(sourceDf)
        self.i = 0

    def next(self):
        x, dx = self.series.next()
        self.i += 1
        return f'C{self.i}', x, dx


light_theme_colors = '$red $pink $purple $violet $indigo $blue $azure $cyan $teal $mint $green $amber $orange $tangerine'.split()
dark_theme_colors = '$red $pink $blue $azure $cyan $teal $mint $green $lime $yellow $amber $orange $tangerine'.split()

_color_index = -1
colors = dark_theme_colors

def next_color():
    global _color_index
    _color_index += 1
    return colors[_color_index % len(colors)]


_curve_index = -1
curves = 'linear smooth step stepAfter stepBefore'.split()


def next_curve():
    global _curve_index
    _curve_index += 1
    return curves[_curve_index % len(curves)]


def create_dashboard(update_freq=0.0):
    page = site['/dashboard_st']

    # Fetching the data
    client = AblyRest('XXXXX.YYYYYY:94384jjdhdh98kiidLO')
    channel = client.channels.get('sd_channel')

    message_page = channel.history()

    # Counter Value
    cnt = 0

    # Declaring Global Data-Frame
    df_conv = p.DataFrame()

    for i in message_page.items:
        print('Last Msg: {}'.format(i.data))
        json_data = json.loads(i.data)

        # Converting JSON to Dataframe
        df = p.json_normalize(json_data)
        df.columns = df.columns.map(lambda x: x.split(".")[-1])

        if cnt == 0:
            df_conv = df
        else:
            d_frames = [df_conv, df]
            df_conv = p.concat(d_frames)

        cnt += 1

    # Resetting the Index Value
    df_conv.reset_index(drop=True, inplace=True)

    print('DF:')
    print(df_conv)

    df_conv['default_rank'] = df_conv.groupby(['Currency']).cumcount() + 1
    lkp_rank = 1
    df_unique = df_conv[(df_conv['default_rank'] == lkp_rank)]

    print('Rank DF Unique:')
    print(df_unique)

    count_row = df_unique.shape[0]

    large_lines = []
    start_pos = 0
    end_pos = 0
    interval = 1

    # Converting dataframe to a desired Series
    f = CategoricalSeries(df_conv)

    for j in range(count_row):
        # Getting the series values from above
        cat, val, pc = f.next()

        # Getting Individual Element & convert them to Series
        if ((start_pos + interval) <= count_row):
            end_pos = start_pos + interval
        else:
            end_pos = start_pos + (count_row - start_pos)

        split_df = df_unique.iloc[start_pos:end_pos]

        if ((start_pos > count_row) | (start_pos == count_row)):
            pass
        else:
            start_pos = start_pos + interval

        x_currency = str(split_df.iloc[0]['Currency'])

        c = page.add(f'e{j+1}', ui.tall_series_stat_card(
            box=f'{j+1} 1 1 2',
            title=x_currency,
            value='=${{intl qux minimum_fraction_digits=2 maximum_fraction_digits=2}}',
            aux_value='={{intl quux style="percent" minimum_fraction_digits=1 maximum_fraction_digits=1}}',
            data=dict(qux=val, quux=pc),
            plot_type='area',
            plot_category='foo',
            plot_value='qux',
            plot_color=next_color(),
            plot_data=data('foo qux', -15),
            plot_zero_value=0,
            plot_curve=next_curve(),
        ))
        large_lines.append((f, c))

    page.save()

    while update_freq > 0:

        time.sleep(update_freq)

        for f, c in large_lines:
            cat, val, pc = f.next()

            c.data.qux = val
            c.data.quux = pc / 100
            c.plot_data[-1] = [cat, val]

        page.save()

create_dashboard(update_freq=0.25)

Some of the key snippets from the above codes are –

class DaSeries:
    def __init__(self, inputDf):
        self.Df = inputDf
        self.count_row = inputDf.shape[0]
        self.start_pos = 0
        self.end_pos = 0
        self.interval = 1


    def next(self):
        try:
            # Getting Individual Element & convert them to Series
            if ((self.start_pos + self.interval) <= self.count_row):
                self.end_pos = self.start_pos + self.interval
            else:
                self.end_pos = self.start_pos + (self.count_row - self.start_pos)

            split_df = self.Df.iloc[self.start_pos:self.end_pos]

            if ((self.start_pos > self.count_row) | (self.start_pos == self.count_row)):
                pass
            else:
                self.start_pos = self.start_pos + self.interval

            x = float(split_df.iloc[0]['CurrentExchange'])
            dx = float(split_df.iloc[0]['Change'])

            # Emptying the exisitng dataframe
            split_df = p.DataFrame(None)

            return x, dx
        except:
            x = 0
            dx = 0

            return x, dx

class CategoricalSeries:
    def __init__(self, sourceDf):
        self.series = DaSeries(sourceDf)
        self.i = 0

    def next(self):
        x, dx = self.series.next()
        self.i += 1
        return f'C{self.i}', x, dx

The above snippet will create a series of data out of a pandas data frame. It will consume, one-by-one record & then pass it to the dashboard for real-time updates.

# Fetching the data
client = AblyRest('XXXXX.YYYYYY:94384jjdhdh98kiidLO')
channel = client.channels.get('sd_channel')

message_page = channel.history()

In the above code, the application will consume the real-time data out of Ably’s channel.

df_conv['default_rank'] = df_conv.groupby(['Currency']).cumcount() + 1
lkp_rank = 1
df_unique = df_conv[(df_conv['default_rank'] == lkp_rank)]

In the above code, the application is uniquely identifying the first instance of currency entries, which will be passed to the initial dashboard page before consuming the array of updates.

f = CategoricalSeries(df_conv)

In the above code, the application is creating an instance of the intended categorical series.

c = page.add(f'e{j+1}', ui.tall_series_stat_card(
            box=f'{j+1} 1 1 2',
            title=x_currency,
            value='=${{intl qux minimum_fraction_digits=2 maximum_fraction_digits=2}}',
            aux_value='={{intl quux style="percent" minimum_fraction_digits=1 maximum_fraction_digits=1}}',
            data=dict(qux=val, quux=pc),
            plot_type='area',
            plot_category='foo',
            plot_value='qux',
            plot_color=next_color(),
            plot_data=data('foo qux', -15),
            plot_zero_value=0,
            plot_curve=next_curve(),
        ))
        large_lines.append((f, c))

    page.save()

The above code is a standard way to bind the streaming data with the H2O-Wave dashboard.

    while update_freq > 0:

        time.sleep(update_freq)

        for f, c in large_lines:
            cat, val, pc = f.next()

            c.data.qux = val
            c.data.quux = pc / 100
            c.plot_data[-1] = [cat, val]

        page.save()

Here are the last few snippet lines that will capture the continuous streaming data & keep updating the numbers on your dashboard.

Since I’ve already provided the run video of my application, here are a few important screens –

Case 1:

Wave Server Start Command

Case 2:

Publishing stream data

Case 3:

Consuming Stream Data & Publishing to Dashboard

Case 4:

Dashboard Data

So, finally, we have done it.

You will get the complete codebase in the following Github link.


I’ll bring some more exciting topic in the coming days from the Python verse.

Till then, Happy Avenging! 😀

Note: All the data & scenario posted here are representational data & scenarios & available over the internet & for educational purpose only.

Canada’s Covid19 analysis based on Logistic Regression

Hi Guys,

Today, I’ll be demonstrating some scenarios based on open-source data from Canada. In this post, I will only explain some of the significant parts of the code. Not the entire range of scripts here.

Let’s explore a couple of sample source data –

2. Sample Input Data

I would like to explore how much this disease caused an impact on the elderly in Canada.

Let’s explore the source directory structure –

3. Source Directory Structures

For this, you need to install the following packages –

pip install pandas

pip install seaborn

Please find the PyPi link given below –

In this case, we’ve downloaded the data from Canada’s site. However, they have created API. So, you can consume the data through that way as well. Since the volume is a little large. I decided to download that in CSV & then use that for my analysis.

Before I start, let me explain a couple of critical assumptions that I had to make due to data impurities or availabilities.

  • If there is no data available for a specific case, my application will consider that patient as COVID-Active.
  • We will consider the patient is affected through Community-spreading until we have data to find it otherwise.
  • If there is no data available for gender, we’re marking these records as “Other.” So, that way, we’re making it into that category, where the patient doesn’t want to disclose their sexual orientation.
  • If we don’t have any data, then by default, the application is considering the patient is alive.
  • Lastly, my application considers the middle point of the age range data for all the categories, i.e., the patient’s age between 20 & 30 will be considered as 25.

1. clsCovidAnalysisByCountryAdv (This is the main script, which will invoke the Machine-Learning API & return 0 if successful.)

##############################################
#### Written By: SATYAKI DE               ####
#### Written On: 01-Jun-2020              ####
#### Modified On 01-Jun-2020              ####
####                                      ####
#### Objective: Main scripts for Logistic ####
#### Regression.                          ####
##############################################

import pandas as p
import clsL as log
import datetime

import matplotlib.pyplot as plt
import seaborn as sns
from clsConfig import clsConfig as cf

# %matplotlib inline -- for Jupyter Notebook
class clsCovidAnalysisByCountryAdv:
    def __init__(self):
        self.fileName_1 = cf.config['FILE_NAME_1']
        self.fileName_2 = cf.config['FILE_NAME_2']
        self.Ind = cf.config['DEBUG_IND']
        self.subdir = str(cf.config['LOG_DIR_NAME'])

    def setDefaultActiveCases(self, row):
        try:
            str_status = str(row['case_status'])

            if str_status == 'Not Reported':
                return 'Active'
            else:
                return str_status
        except:
            return 'Active'

    def setDefaultExposure(self, row):
        try:
            str_exposure = str(row['exposure'])

            if str_exposure == 'Not Reported':
                return 'Community'
            else:
                return str_exposure
        except:
            return 'Community'

    def setGender(self, row):
        try:
            str_gender = str(row['gender'])

            if str_gender == 'Not Reported':
                return 'Other'
            else:
                return str_gender
        except:
            return 'Other'

    def setSurviveStatus(self, row):
        try:
            # 0 - Deceased
            # 1 - Alive
            str_active = str(row['ActiveCases'])

            if str_active == 'Deceased':
                return 0
            else:
                return 1
        except:
            return 1

    def getAgeFromGroup(self, row):
        try:
            # We'll take the middle of the Age group
            # If a age range falls with 20, we'll
            # consider this as 10.
            # Similarly, a age group between 20 & 30,
            # should reflect by 25.
            # Anything above 80 will be considered as
            # 85

            str_age_group = str(row['AgeGroup'])

            if str_age_group == '<20':
                return 10
            elif str_age_group == '20-29':
                return 25
            elif str_age_group == '30-39':
                return 35
            elif str_age_group == '40-49':
                return 45
            elif str_age_group == '50-59':
                return 55
            elif str_age_group == '60-69':
                return 65
            elif str_age_group == '70-79':
                return 75
            else:
                return 85
        except:
            return 100

    def predictResult(self):
        try:
            
            # Initiating Logging Instances
            clog = log.clsL()

            # Important variables
            var = datetime.datetime.now().strftime(".%H.%M.%S")
            print('Target File Extension will contain the following:: ', var)
            Ind = self.Ind
            subdir = self.subdir

            #######################################
            #                                     #
            # Using Logistic Regression to        #
            # Idenitfy the following scenarios -  #
            #                                     #
            # Age wise Infection Vs Deaths        #
            #                                     #
            #######################################
            inputFileName_2 = self.fileName_2

            # Reading from Input File
            df_2 = p.read_csv(inputFileName_2)

            # Fetching only relevant columns
            df_2_Mod = df_2[['date_reported','age_group','gender','exposure','case_status']]
            df_2_Mod['State'] = df_2['province_abbr']

            print()
            print('Projecting 2nd file sample rows: ')
            print(df_2_Mod.head())

            print()
            x_row_1 = df_2_Mod.shape[0]
            x_col_1 = df_2_Mod.shape[1]

            print('Total Number of Rows: ', x_row_1)
            print('Total Number of columns: ', x_col_1)

            #########################################################################################
            # Few Assumptions                                                                       #
            #########################################################################################
            # By default, if there is no data on exposure - We'll treat that as community spreading #
            # By default, if there is no data on case_status - We'll consider this as active        #
            # By default, if there is no data on gender - We'll put that under a separate Gender    #
            # category marked as the "Other". This includes someone who doesn't want to identify    #
            # his/her gender or wants to be part of LGBT community in a generic term.               #
            #                                                                                       #
            # We'll transform our data accordingly based on the above logic.                        #
            #########################################################################################
            df_2_Mod['ActiveCases'] = df_2_Mod.apply(lambda row: self.setDefaultActiveCases(row), axis=1)
            df_2_Mod['ExposureStatus'] = df_2_Mod.apply(lambda row: self.setDefaultExposure(row), axis=1)
            df_2_Mod['Gender'] = df_2_Mod.apply(lambda row: self.setGender(row), axis=1)

            # Filtering all other records where we don't get any relevant information
            # Fetching Data for
            df_3 = df_2_Mod[(df_2_Mod['age_group'] != 'Not Reported')]

            # Dropping unwanted columns
            df_3.drop(columns=['exposure'], inplace=True)
            df_3.drop(columns=['case_status'], inplace=True)
            df_3.drop(columns=['date_reported'], inplace=True)
            df_3.drop(columns=['gender'], inplace=True)

            # Renaming one existing column
            df_3.rename(columns={"age_group": "AgeGroup"}, inplace=True)

            # Creating important feature
            # 0 - Deceased
            # 1 - Alive
            df_3['Survived'] = df_3.apply(lambda row: self.setSurviveStatus(row), axis=1)

            clog.logr('2.df_3' + var + '.csv', Ind, df_3, subdir)

            print()
            print('Projecting Filter sample rows: ')
            print(df_3.head())

            print()
            x_row_2 = df_3.shape[0]
            x_col_2 = df_3.shape[1]

            print('Total Number of Rows: ', x_row_2)
            print('Total Number of columns: ', x_col_2)

            # Let's do some basic checkings
            sns.set_style('whitegrid')
            #sns.countplot(x='Survived', hue='Gender', data=df_3, palette='RdBu_r')

            # Fixing Gender Column
            # This will check & indicate yellow for missing entries
            #sns.heatmap(df_3.isnull(), yticklabels=False, cbar=False, cmap='viridis')

            #sex = p.get_dummies(df_3['Gender'], drop_first=True)
            sex = p.get_dummies(df_3['Gender'])
            df_4 = p.concat([df_3, sex], axis=1)

            print('After New addition of columns: ')
            print(df_4.head())

            clog.logr('3.df_4' + var + '.csv', Ind, df_4, subdir)

            # Dropping unwanted columns for our Machine Learning
            df_4.drop(columns=['Gender'], inplace=True)
            df_4.drop(columns=['ActiveCases'], inplace=True)
            df_4.drop(columns=['Male','Other','Transgender'], inplace=True)

            clog.logr('4.df_4_Mod' + var + '.csv', Ind, df_4, subdir)

            # Fixing Spread Columns
            spread = p.get_dummies(df_4['ExposureStatus'], drop_first=True)
            df_5 = p.concat([df_4, spread], axis=1)

            print('After Spread columns:')
            print(df_5.head())

            clog.logr('5.df_5' + var + '.csv', Ind, df_5, subdir)

            # Dropping unwanted columns for our Machine Learning
            df_5.drop(columns=['ExposureStatus'], inplace=True)

            clog.logr('6.df_5_Mod' + var + '.csv', Ind, df_5, subdir)

            # Fixing Age Columns
            df_5['Age'] = df_5.apply(lambda row: self.getAgeFromGroup(row), axis=1)
            df_5.drop(columns=["AgeGroup"], inplace=True)

            clog.logr('7.df_6' + var + '.csv', Ind, df_5, subdir)

            # Fixing Dummy Columns Name
            # Renaming one existing column Travel-Related with Travel_Related
            df_5.rename(columns={"Travel-Related": "TravelRelated"}, inplace=True)

            clog.logr('8.df_7' + var + '.csv', Ind, df_5, subdir)

            # Removing state for temporary basis
            df_5.drop(columns=['State'], inplace=True)
            # df_5.drop(columns=['State','Other','Transgender','Pending','TravelRelated','Male'], inplace=True)

            # Casting this entire dataframe into Integer
            # df_5_temp.apply(p.to_numeric)

            print('Info::')
            print(df_5.info())
            print("*" * 60)
            print(df_5.describe())
            print("*" * 60)

            clog.logr('9.df_8' + var + '.csv', Ind, df_5, subdir)

            print('Intermediate Sample Dataframe for Age::')
            print(df_5.head())

            # Plotting it to Graph
            sns.jointplot(x="Age", y='Survived', data=df_5)
            sns.jointplot(x="Age", y='Survived', data=df_5, kind='kde', color='red')
            plt.xlabel("Age")
            plt.ylabel("Data Point (0 - Died   Vs    1 - Alive)")

            # Another check with Age Group
            sns.countplot(x='Survived', hue='Age', data=df_5, palette='RdBu_r')
            plt.xlabel("Survived(0 - Died   Vs    1 - Alive)")
            plt.ylabel("Total No Of Patient")

            df_6 = df_5.drop(columns=['Survived'], axis=1)

            clog.logr('10.df_9' + var + '.csv', Ind, df_6, subdir)

            # Train & Split Data
            x_1 = df_6
            y_1 = df_5['Survived']

            # Now Train-Test Split of your source data
            from sklearn.model_selection import train_test_split

            # test_size => % of allocated data for your test cases
            # random_state => A specific set of random split on your data
            X_train_1, X_test_1, Y_train_1, Y_test_1 = train_test_split(x_1, y_1, test_size=0.3, random_state=101)

            # Importing Model
            from sklearn.linear_model import LogisticRegression

            logmodel = LogisticRegression()
            logmodel.fit(X_train_1, Y_train_1)

            # Adding Predictions to it
            predictions_1 = logmodel.predict(X_test_1)

            from sklearn.metrics import classification_report

            print('Classification Report:: ')
            print(classification_report(Y_test_1, predictions_1))

            from sklearn.metrics import confusion_matrix

            print('Confusion Matrix:: ')
            print(confusion_matrix(Y_test_1, predictions_1))

            # This is require when you are trying to print from conventional
            # front & not using Jupyter notebook.
            plt.show()

            return 0

        except Exception  as e:
            x = str(e)
            print('Error : ', x)

            return 1

Key snippets from the above script –

df_2_Mod['ActiveCases'] = df_2_Mod.apply(lambda row: self.setDefaultActiveCases(row), axis=1)
df_2_Mod['ExposureStatus'] = df_2_Mod.apply(lambda row: self.setDefaultExposure(row), axis=1)
df_2_Mod['Gender'] = df_2_Mod.apply(lambda row: self.setGender(row), axis=1)

# Filtering all other records where we don't get any relevant information
# Fetching Data for
df_3 = df_2_Mod[(df_2_Mod['age_group'] != 'Not Reported')]

# Dropping unwanted columns
df_3.drop(columns=['exposure'], inplace=True)
df_3.drop(columns=['case_status'], inplace=True)
df_3.drop(columns=['date_reported'], inplace=True)
df_3.drop(columns=['gender'], inplace=True)

# Renaming one existing column
df_3.rename(columns={"age_group": "AgeGroup"}, inplace=True)

# Creating important feature
# 0 - Deceased
# 1 - Alive
df_3['Survived'] = df_3.apply(lambda row: self.setSurviveStatus(row), axis=1)

The above lines point to the critical transformation areas, where the application is invoking various essential business logic.

Let’s see at this moment our sample data –

6. 4_4_mod

Let’s look into the following part –

# Fixing Spread Columns
spread = p.get_dummies(df_4['ExposureStatus'], drop_first=True)
df_5 = p.concat([df_4, spread], axis=1)

The above lines will transform the data into this –

7. 5_5_Mod

As you can see, we’ve transformed the row values into columns with binary values. This kind of transformation is beneficial.

# Plotting it to Graph
sns.jointplot(x="Age", y='Survived', data=df_5)
sns.jointplot(x="Age", y='Survived', data=df_5, kind='kde', color='red')
plt.xlabel("Age")
plt.ylabel("Data Point (0 - Died   Vs    1 - Alive)")

# Another check with Age Group
sns.countplot(x='Survived', hue='Age', data=df_5, palette='RdBu_r')
plt.xlabel("Survived(0 - Died   Vs    1 - Alive)")
plt.ylabel("Total No Of Patient")

The above lines will process the data & visualize based on that.

x_1 = df_6
y_1 = df_5['Survived']

In the above snippet, we’ve assigned the features & target variable for our final logistic regression model.

# Now Train-Test Split of your source data
from sklearn.model_selection import train_test_split

# test_size => % of allocated data for your test cases
# random_state => A specific set of random split on your data
X_train_1, X_test_1, Y_train_1, Y_test_1 = train_test_split(x_1, y_1, test_size=0.3, random_state=101)

# Importing Model
from sklearn.linear_model import LogisticRegression

logmodel = LogisticRegression()
logmodel.fit(X_train_1, Y_train_1)

In the above snippet, we’re splitting the primary data & create a set of test & train data. Once we have the collection, the application will put the logistic regression model. And, finally, we’ll fit the training data.

# Adding Predictions to it
predictions_1 = logmodel.predict(X_test_1)

from sklearn.metrics import classification_report

print('Classification Report:: ')
print(classification_report(Y_test_1, predictions_1))

The above lines, finally use the model & then we feed our test data.

Let’s see how it runs –

5.1.Run_Windows
5.2. Run_Windows

And, here is the log directory –

4. Logs

For better understanding, I’m just clubbing both the diagram at one place & the final outcome is showing as follows –

1. MergeReport

So, from the above picture, we can see that the maximum vulnerable patients are patients who are 80+. The next two categories that also suffered are 70+ & 60+.

Also, We’ve checked the Female Vs. Male in the following code –

sns.countplot(x='Survived', hue='Female', data=df_5, palette='RdBu_r')
plt.xlabel("Survived(0 - Died   Vs    1 - Alive)")
plt.ylabel("Female Vs Male (Including Other Genders)")

And, the analysis represents through this –

8. Female_Male

In this case, you have to consider that the Male part includes all the other genders apart from the actual Male. Hence, I believe death for females would be more compared to people who identified themselves as males.

So, finally, we’ve done it.

During this challenging time, I would request you to follow strict health guidelines & stay healthy.

N.B.: All the data that are used here can be found in the public domain. We use this solely for educational purposes. You can find the details here.

Analyzing Language using IBM Watson using Python

Hi Guys,

Today, I’ll be discussing the following topic – “How to analyze text using IBM Watson implementing through Python.”

IBM has significantly improved in the field of Visual Image Analysis or Text language analysis using its IBM Watson cloud platform. In this particular topic, we’ll be exploring the natural languages only.

To access IBM API, we need to first create an IBM Cloud account from this site.

Let us quickly go through the steps to create the IBM Language Understanding service. Click the Catalog on top of your browser menu as shown in the below picture –

6. Creating an Instance for Watson

After that, click the AI option on your left-hand side of the panel marked in RED.

Click the Watson-Studio & later choose the plan. In our case, We’ll select the “Lite” option as IBM provided this platform for all the developers to explore their cloud for free.

7. Choosing AI
8. Choosing Plan

Clicking the create option will lead to a blank page of Watson Studio as shown below –

9. Choosing Watson Studio

And, now, we need to click the Get Started button to launch it. This will lead to Create Project page, which can be done using the following steps –

10. Create Project Initial Screen

Now, clicking the create a project will lead you to the next screen –

11. Create Project - Continue

You can choose either an empty project, or you can create it from a sample file. In this case, we’ll be selecting the first option & this will lead us to the below page –

12. Creating a Project

And, then you will click the “Create” option, which will lead you to the next screen –

13. Adding to project

Now, you need to click “Add to Project.” This will give you a variety of services that you want to explore/use from the list. If you want to create your own natural language classifier, which you can do that as follows –

14. Adding Natural Language Components from IBM Cloud

Once, you click it – you need to select the associate service –

15. Adding Associte Service - Sound

Here, you need to click the hyperlink, which prompts to the next screen –

16. Choosing Associate Service - Sound

You need to check the price for both the Visual & Natural Language Classifier. They are pretty expensive. The visual classifier has the Lite plan. However, it has limitations of output.

Clicking the “Create” will prompt to the next screen –

18. Selecting Region - Sound

After successful creation, you will be redirected to the following page –

19. Landing Page - Sound

Now, We’ll be adding our “Natural Language Understand” for our test –

29. Choosing Natural Language Understanding

This will prompt the next screen –

7. Choosing AI - Natural Language Understanding

Once, it is successful. You will see the service registered as shown below –

3. Watson Services - Sound

If you click the service marked in RED, it will lead you to another page, where you will get the API Key & Url. You need both of this information in Python application to access this API as shown below –

4. Watson API Details - Sound

Now, we’re ready with the necessary cloud set-up. After this, we need to install the Python package for IBM Cloud as shown below –

1. Installing_Packages

We’ve noticed that, recently, IBM has launched one upgraded package. Hence, we installed that one as well. I would recommend you to install this second package directly instead of the first one shown above –

2. Installing Latest IBM_Watson Package

Now, we’re done with our set-up.

Let’s see the directory structure –

31. Directory Structure

We’ll be discussing only the main calling script & class script. However, we’ll be posting the parameters without discussing it. And, we won’t discuss clsL.py as we’ve already discussed that in our previous post.

1. clsConfig.py (This script contains all the parameter details.)

##############################################
#### Written By: SATYAKI DE               ####
#### Written On: 04-Apr-2020              ####
####                                      ####
#### Objective: This script is a config   ####
#### file, contains all the keys for      ####
#### IBM Cloud API.   Application will    ####
#### process these information & perform  ####
#### various analysis on IBM Watson cloud.####
##############################################

import os
import platform as pl

class clsConfig(object):
    Curr_Path = os.path.dirname(os.path.realpath(__file__))

    os_det = pl.system()
    if os_det == "Windows":
        sep = '\\'
    else:
        sep = '/'

    config = {
        'APP_ID': 1,
        'SERVICE_URL': "https://api.eu-gb.natural-language-understanding.watson.cloud.ibm.com/instances/xxxxxxxxxxxxxxXXXXXXXXXXxxxxxxxxxxxxxxxx",
        'API_KEY': "Xxxxxxxxxxxxxkdkdfifd984djddkkdkdkdsSSdkdkdd",
        'API_TYPE': "application/json",
        'CACHE': "no-cache",
        'CON': "keep-alive",
        'ARCH_DIR': Curr_Path + sep + 'arch' + sep,
        'PROFILE_PATH': Curr_Path + sep + 'profile' + sep,
        'LOG_PATH': Curr_Path + sep + 'log' + sep,
        'REPORT_PATH': Curr_Path + sep + 'report',
        'SRC_PATH': Curr_Path + sep + 'Src_File' + sep,
        'APP_DESC_1': 'IBM Watson Language Understand!',
        'DEBUG_IND': 'N',
        'INIT_PATH': Curr_Path
    }

Note that you will be placing your API_KEY & URL here, as shown in the configuration file.

2. clsIBMWatson.py (This is the main script, which will invoke the IBM Watson API based on the input from the user & return 0 if successful.)

##############################################
#### Written By: SATYAKI DE               ####
#### Written On: 04-Apr-2020              ####
#### Modified On 04-Apr-2020              ####
####                                      ####
#### Objective: Main scripts to invoke    ####
#### IBM Watson Language Understand API.  ####
##############################################

import logging
from clsConfig import clsConfig as cf
import clsL as cl
import json
from ibm_watson import NaturalLanguageUnderstandingV1
from ibm_cloud_sdk_core.authenticators import IAMAuthenticator
from ibm_watson.natural_language_understanding_v1 import Features, EntitiesOptions, KeywordsOptions, SentimentOptions, CategoriesOptions, ConceptsOptions
from ibm_watson import ApiException

class clsIBMWatson:
    def __init__(self):
        self.api_key =  cf.config['API_KEY']
        self.service_url = cf.config['SERVICE_URL']

    def calculateExpressionFromUrl(self, inputUrl, inputVersion):
        try:
            api_key = self.api_key
            service_url = self.service_url
            print('-' * 60)
            print('Beginning of the IBM Watson for Input Url.')
            print('-' * 60)

            authenticator = IAMAuthenticator(api_key)

            # Authentication via service credentials provided in our config files
            service = NaturalLanguageUnderstandingV1(version=inputVersion, authenticator=authenticator)
            service.set_service_url(service_url)

            response = service.analyze(
                url=inputUrl,
                features=Features(entities=EntitiesOptions(),
                                  sentiment=SentimentOptions(),
                                  concepts=ConceptsOptions())).get_result()

            print(json.dumps(response, indent=2))

            return 0

        except ApiException as ex:
            print('-' * 60)
            print("Method failed for Url with status code " + str(ex.code) + ": " + ex.message)
            print('-' * 60)

            return 1

    def calculateExpressionFromText(self, inputText, inputVersion):
        try:
            api_key = self.api_key
            service_url = self.service_url
            print('-' * 60)
            print('Beginning of the IBM Watson for Input Url.')
            print('-' * 60)

            authenticator = IAMAuthenticator(api_key)

            # Authentication via service credentials provided in our config files
            service = NaturalLanguageUnderstandingV1(version=inputVersion, authenticator=authenticator)
            service.set_service_url(service_url)

            response = service.analyze(
                text=inputText,
                features=Features(entities=EntitiesOptions(),
                                  sentiment=SentimentOptions(),
                                  concepts=ConceptsOptions())).get_result()

            print(json.dumps(response, indent=2))

            return 0

        except ApiException as ex:
            print('-' * 60)
            print("Method failed for Url with status code " + str(ex.code) + ": " + ex.message)
            print('-' * 60)

            return 1

Some of the key lines from the above snippet –

authenticator = IAMAuthenticator(api_key)

# Authentication via service credentials provided in our config files
service = NaturalLanguageUnderstandingV1(version=inputVersion, authenticator=authenticator)
service.set_service_url(service_url)

By providing the API Key & Url, the application is initiating the service for Watson.

response = service.analyze(
    url=inputUrl,
    features=Features(entities=EntitiesOptions(),
                      sentiment=SentimentOptions(),
                      concepts=ConceptsOptions())).get_result()

Based on your type of input, it will bring the features of entities, sentiment & concepts here. Apart from that, you can additionally check the following features as well – Keywords & Categories.

3. callIBMWatsonAPI.py (This is the first calling script. Based on user choice, it will receive input either as Url or as the plain text & then analyze it.)

##############################################
#### Written By: SATYAKI DE               ####
#### Written On: 04-Apr-2020              ####
#### Modified On 04-Apr-2020              ####
####                                      ####
#### Objective: Main calling scripts.     ####
##############################################

from clsConfig import clsConfig as cf
import clsL as cl
import logging
import datetime
import clsIBMWatson as cw

# Disbling Warning
def warn(*args, **kwargs):
    pass

import warnings
warnings.warn = warn

# Lookup functions from
# Azure cloud SQL DB

var = datetime.datetime.now().strftime("%Y-%m-%d_%H-%M-%S")

def main():
    try:
        ret_1 = 0
        general_log_path = str(cf.config['LOG_PATH'])

        # Enabling Logging Info
        logging.basicConfig(filename=general_log_path + 'IBMWatson_NaturalLanguageAnalysis.log', level=logging.INFO)

        # Initiating Log Class
        l = cl.clsL()

        # Moving previous day log files to archive directory
        log_dir = cf.config['LOG_PATH']
        curr_ver =datetime.datetime.now().strftime("%Y-%m-%d")

        tmpR0 = "*" * 157

        logging.info(tmpR0)
        tmpR9 = 'Start Time: ' + str(var)
        logging.info(tmpR9)
        logging.info(tmpR0)

        print("Log Directory::", log_dir)
        tmpR1 = 'Log Directory::' + log_dir
        logging.info(tmpR1)

        print('Welcome to IBM Wantson Language Understanding Calling Program: ')
        print('-' * 60)
        print('Please Press 1 for Understand the language from Url.')
        print('Please Press 2 for Understand the language from your input-text.')
        input_choice = int(input('Please provide your choice:'))

        # Create the instance of the IBM Watson Class
        x2 = cw.clsIBMWatson()

        # Let's pass this to our map section
        if input_choice == 1:
            textUrl = str(input('Please provide the complete input url:'))
            ret_1 = x2.calculateExpressionFromUrl(textUrl, curr_ver)
        elif input_choice == 2:
            inputText = str(input('Please provide the input text:'))
            ret_1 = x2.calculateExpressionFromText(inputText, curr_ver)
        else:
            print('Invalid options!')

        if ret_1 == 0:
            print('Successful IBM Watson Language Understanding Generated!')
        else:
            print('Failed to generate IBM Watson Language Understanding!')

        print("-" * 60)
        print()

        print('Finding Analysis points..')
        print("*" * 157)
        logging.info('Finding Analysis points..')
        logging.info(tmpR0)


        tmpR10 = 'End Time: ' + str(var)
        logging.info(tmpR10)
        logging.info(tmpR0)

    except ValueError as e:
        print(str(e))
        print("Invalid option!")
        logging.info("Invalid option!")

    except Exception as e:
        print("Top level Error: args:{0}, message{1}".format(e.args, e.message))

if __name__ == "__main__":
    main()

This script is pretty straight forward as it is first creating an instance of the main class & then based on the user input, it is calling the respective functions here.

As of now, IBM Watson can work on a list of languages, which are available here.

If you want to start from scratch, please refer to the following link.

Please find the screenshot of our application run –

Case 1 (With Url): 

21. Win_Run_1_Url
23. Win_Run_3_Url

Case 2 (With Plain text):

25. Win_Run_1_InputText
26. Win_Run_2_InputText
27. Win_Run_3_InputText

Now, Don’t forget to delete all the services from your IBM Cloud.

32. Delete Service

As you can see, from the service, you need to delete all the services one-by-one as shown in the figure.

So, we’ve done it.

To explore my photography, you can visit the following link.

I’ll be posting another new post in the coming days. Till then, Happy Avenging! 😀

Note: All the data posted here are representational data & available over the internet & for educational purpose only.

Creating a Cross-platform GUI based application using native Python using PyQt5

Hi Guys!

Today, We’ll be discussing one more graphical package in Python, which is also known as PyQt. To faster design the GUI, we’ll be exploring another tool called Qt Designer, which is available for multiple OS platforms.

Please find the QT Designer here.

This is similar to any other GUI based IDE like Microsoft Visual Studio, where you can quickly generate your GUI template.

The majority of the internet post talks about using PyQt5 or PyQt4 packages. But, when speaking about using the .ui file inside your Python code – they either demonstrate fundamental options without any event or, they convert & generate the .ui file into .py file & then they use it. This certainly not making it very useful for many of the developers who are trying to use it for the first time. Hence, My main goal is to use the .ui file inside my Python script as it is & use all the components out of it & assign various working events.

In this post, we’ll discuss only with one script & then we’ll showcase the output in the form of video (No audio). You can verify the output for both MAC & Windows.

Before we start, let us check the directory structure between Windows & MAC –

2. MAC & Win Directory Structure

Let us explore how the GUI should look like ->

3. GUI Design

So, as you can see that this tool is like any other GUI based tool, basically you can create anything by simply drag & drop method.

Before we start discussing our code, here is the sample basicAdv.ui file for your reference.

You need to install the following framework –

pip install PyQt5

1. GUIPyQt5.py (This script contains all the GUI details & it will invoke the instance along with the logic.)

##############################################
#### Written By: SATYAKI DE               ####
#### Written On: 12-Mar-2020              ####
#### Modified On 12-Mar-2020              ####
####                                      ####
#### Objective: Main calling scripts.     ####
##############################################

from PyQt5 import QtWidgets, uic, QtGui, QtCore
from PyQt5.QtWidgets import *
import sys

class Ui(QtWidgets.QMainWindow):
    def __init__(self):
        # Instantiating the main class
        super(Ui, self).__init__()

        # Loading the Graphical Design without
        # converting it to any kind of Python code
        uic.loadUi('basicAdv.ui', self)

        # Adding all the essential buttons
        self.prtBtn = self.findChild(QtWidgets.QPushButton, 'prtBtn') # Find the button
        self.prtBtn.clicked.connect(self.printButtonClick) # Remember to pass the definition/method, not the return value!

        self.clrBtn = self.findChild(QtWidgets.QPushButton, 'clrBtn')  # Find the button
        self.clrBtn.clicked.connect(self.clearButtonClick)  # Remember to pass the definition/method, not the return value!

        self.addBtn = self.findChild(QtWidgets.QPushButton, 'addBtn')  # Find the button
        self.addBtn.clicked.connect(self.addItem)  # Remember to pass the definition/method, not the return value!

        self.selectImgBtn = self.findChild(QtWidgets.QPushButton, 'selectImgBtn')  # Find the button
        self.selectImgBtn.clicked.connect(self.setImage)  # Remember to pass the definition/method, not the return value!

        self.cnfBtn = self.findChild(QtWidgets.QPushButton, 'cnfBtn')  # Find the button
        self.cnfBtn.clicked.connect(self.showDialog)  # Remember to pass the definition/method, not the return value!

        # Adding other static input/output elements
        self.input = self.findChild(QtWidgets.QLineEdit, 'input')
        self.qlabel = self.findChild(QtWidgets.QLabel, 'qlabel')
        self.lineEdit = self.findChild(QtWidgets.QLineEdit, 'lineEdit')
        self.listWidget = self.findChild(QtWidgets.QListWidget, 'listWidget')
        self.imageLbl = self.findChild(QtWidgets.QLabel, 'imageLbl')

        # Adding Combobox
        self.combo = self.findChild(QtWidgets.QComboBox, 'sComboBox')  # Find the ComboBox

        # Adding static element to it
        self.combo.addItem("Sourav Ganguly")
        self.combo.addItem("Kapil Dev")
        self.combo.addItem("Sunil Gavaskar")
        self.combo.addItem("M. S. Dhoni")

        # Click Event
        self.combo.activated[str].connect(self.onChanged)  # Remember to pass the definition/method, not the return value!

        # Adding list Box
        self.listwidget2 = self.findChild(QtWidgets.QListWidget, 'listwidget2')  # Find the List

        # Adding static element to it
        self.listwidget2.insertItem(0, "Aamir Khan")
        self.listwidget2.insertItem(1, "Shahruk Khan")
        self.listwidget2.insertItem(2, "Salman Khan")
        self.listwidget2.insertItem(3, "Hrittik Roshon")
        self.listwidget2.insertItem(4, "Amitabh Bachhan")

        # Click Event
        self.listwidget2.clicked.connect(self.showIndividualElement)

        # Adding Group Box
        self.groupBox = self.findChild(QtWidgets.QGroupBox, 'groupBox')  # Find the ComboBox
        self.groupBox.setCheckable(True)

        # Adding Individual Radio Button
        self.rdButton1 = self.findChild(QtWidgets.QRadioButton, 'rdButton1')  # Find the button
        self.rdButton1.setChecked(True)
        self.rdButton1.toggled.connect(lambda: self.printRadioButtonClick(self.rdButton1))  # Remember to pass the definition/method, not the return value!

        self.rdButton2 = self.findChild(QtWidgets.QRadioButton, 'rdButton2')  # Find the button
        self.rdButton2.toggled.connect(lambda: self.printRadioButtonClick(self.rdButton2))  # Remember to pass the definition/method, not the return value!

        self.rdButton3 = self.findChild(QtWidgets.QRadioButton, 'rdButton3')  # Find the button
        self.rdButton3.toggled.connect(lambda: self.printRadioButtonClick(self.rdButton3))  # Remember to pass the definition/method, not the return value!

        self.rdButton4 = self.findChild(QtWidgets.QRadioButton, 'rdButton4')  # Find the button
        self.rdButton4.toggled.connect(lambda: self.printRadioButtonClick(self.rdButton4))  # Remember to pass the definition/method, not the return value!

        self.show()

    def printRadioButtonClick(self, radioOption):

        if radioOption.text() == 'China':
            if radioOption.isChecked() == True:
                print(radioOption.text() + ' is selected')
            else:
                print(radioOption.text() + ' is deselected')

        if radioOption.text() == 'India':
            if radioOption.isChecked() == True:
                print(radioOption.text() + ' is selected')
            else:
                print(radioOption.text() + ' is deselected')

        if radioOption.text() == 'Japan':
            if radioOption.isChecked() == True:
                print(radioOption.text() + ' is selected')
            else:
                print(radioOption.text() + ' is deselected')

        if radioOption.text() == 'France':
            if radioOption.isChecked() == True:
                print(radioOption.text() + ' is selected')
            else:
                print(radioOption.text() + ' is deselected')

    def printButtonClick(self):
        # This is executed when the button is pressed
        print('Input text:' + self.input.text())

    def clearButtonClick(self):
        # This is executed when the button is pressed
        self.input.clear()

    def onChanged(self, text):
        self.qlabel.setText(text)
        self.qlabel.adjustSize()
        self.lineEdit.clear()  # Clear the text

    def addItem(self):
        value = self.lineEdit.text() # Get the value of the lineEdit
        self.lineEdit.clear() # Clear the text
        self.listWidget.addItem(value) # Add the value we got to the list

    def setImage(self):
        fileName, _ = QtWidgets.QFileDialog.getOpenFileName(None, "Select Image", "", "Image Files (*.png *.jpg *jpeg *.bmp);;All Files (*)") # Ask for file
        if fileName: # If the user gives a file
            pixmap = QtGui.QPixmap(fileName) # Setup pixmap with the provided image
            pixmap = pixmap.scaled(self.imageLbl.width(), self.imageLbl.height(), QtCore.Qt.KeepAspectRatio) # Scale pixmap
            self.imageLbl.setPixmap(pixmap) # Set the pixmap onto the label
            self.imageLbl.setAlignment(QtCore.Qt.AlignCenter) # Align the label to center

    def showDialog(self):
        msgBox = QMessageBox()
        msgBox.setIcon(QMessageBox.Information)
        msgBox.setText("Message box pop up window")
        msgBox.setWindowTitle("MessageBox Example")
        msgBox.setStandardButtons(QMessageBox.Ok | QMessageBox.Cancel)
        msgBox.buttonClicked.connect(self.msgButtonClick)

        returnValue = msgBox.exec()
        if returnValue == QMessageBox.Ok:
            print('OK clicked')

    def msgButtonClick(self, i):
        print("Button clicked is:", i.text())

    def showIndividualElement(self, qmodelindex):
        item = self.listwidget2.currentItem()
        print(item.text())

if __name__ == "__main__":

    import sys
    app = QtWidgets.QApplication(sys.argv)
    window = Ui()
    window.show()
    sys.exit(app.exec_())

Let us explore a few key lines from this script. Rests are almost identical.

# Loading the Graphical Design without
# converting it to any kind of Python code
uic.loadUi('basicAdv.ui', self)

Loading the GUI created using Qt Designer into the Python environment.

# Adding all the essential buttons
self.prtBtn = self.findChild(QtWidgets.QPushButton, 'prtBtn') # Find the button
self.prtBtn.clicked.connect(self.printButtonClick) # Remember to pass the definition/method, not the return value!

In this case, we’re dynamically binding the component from the GUI by using the findChild method & then on the next line, we’re invoking the appropriate event associated with that. In this case, it is – self.printButtonClick.

The printButtonClick as mentioned earlier is a method & that contains the following snippet –

def printButtonClick(self):
    # This is executed when the button is pressed
    print('Input text:' + self.input.text())

As you can see, this event will capture the text from the input textbox & print it on our terminal.

Here is the snippet for those widgets, which is part of only input/output & they generally don’t have an event of their own. But, we need to bind them with our Python application.

# Adding other static input/output elements
self.input = self.findChild(QtWidgets.QLineEdit, 'input')
self.qlabel = self.findChild(QtWidgets.QLabel, 'qlabel')
self.lineEdit = self.findChild(QtWidgets.QLineEdit, 'lineEdit')
self.listWidget = self.findChild(QtWidgets.QListWidget, 'listWidget')

This application has drop-down list & hence, we’ve added some static value during our load of this application & that can be seen here –

# Adding list Box
self.listwidget2 = self.findChild(QtWidgets.QListWidget, 'listwidget2')  # Find the List

# Adding static element to it
self.listwidget2.insertItem(0, "Aamir Khan")
self.listwidget2.insertItem(1, "Shahruk Khan")
self.listwidget2.insertItem(2, "Salman Khan")
self.listwidget2.insertItem(3, "Hrittik Roshon")
self.listwidget2.insertItem(4, "Amitabh Bachhan")

Once, the user will select a specific value from this list, the app will execute the following event as shown below –

# Click Event
self.listwidget2.clicked.connect(self.showIndividualElement)

Again, to explore the method, you need to view the given logic –

def showIndividualElement(self, qmodelindex):
    item = self.listwidget2.currentItem()
    print(item.text())

Group Box, along with the radio button, works slightly different than our drop-down list.

For each radio button, we’ll have a dedicated text value that represents a different country in this context.

And, our application will bind all the radio button & then they will use one standard method for all of these four options as shown below –

# Adding Individual Radio Button
self.rdButton1 = self.findChild(QtWidgets.QRadioButton, 'rdButton1')  # Find the button
self.rdButton1.setChecked(True)
self.rdButton1.toggled.connect(lambda: self.printRadioButtonClick(self.rdButton1))  # Remember to pass the definition/method, not the return value!

self.rdButton2 = self.findChild(QtWidgets.QRadioButton, 'rdButton2')  # Find the button
self.rdButton2.toggled.connect(lambda: self.printRadioButtonClick(self.rdButton2))  # Remember to pass the definition/method, not the return value!

self.rdButton3 = self.findChild(QtWidgets.QRadioButton, 'rdButton3')  # Find the button
self.rdButton3.toggled.connect(lambda: self.printRadioButtonClick(self.rdButton3))  # Remember to pass the definition/method, not the return value!

self.rdButton4 = self.findChild(QtWidgets.QRadioButton, 'rdButton4')  # Find the button
self.rdButton4.toggled.connect(lambda: self.printRadioButtonClick(self.rdButton4))  # Remember to pass the definition/method, not the return value!

Also, note that, by default, rdButton1 is set to True i.e., it will be selected when the form load initially.

Let’s explore the printRadioButtonClick event.

def printRadioButtonClick(self, radioOption):

    if radioOption.text() == 'China':
        if radioOption.isChecked() == True:
            print(radioOption.text() + ' is selected')
        else:
            print(radioOption.text() + ' is deselected')

    if radioOption.text() == 'India':
        if radioOption.isChecked() == True:
            print(radioOption.text() + ' is selected')
        else:
            print(radioOption.text() + ' is deselected')

    if radioOption.text() == 'Japan':
        if radioOption.isChecked() == True:
            print(radioOption.text() + ' is selected')
        else:
            print(radioOption.text() + ' is deselected')

    if radioOption.text() == 'France':
        if radioOption.isChecked() == True:
            print(radioOption.text() + ' is selected')
        else:
            print(radioOption.text() + ' is deselected')

This will capture the radio button option & based on the currently clicked button, it will fetch the text out of it. Finally, that will match with the logic here & based on that, our application will display the output.

Finally, the Image process is slightly different.

Initially, our application will load the component from the .ui file & bind them with the Python environment –

self.imageLbl = self.findChild(QtWidgets.QLabel, 'imageLbl')

Image load option will only work when the user clicks the button that triggers the following sets of actions –

self.selectImgBtn = self.findChild(QtWidgets.QPushButton, 'selectImgBtn')  # Find the button
self.selectImgBtn.clicked.connect(self.setImage)  # Remember to pass the definition/method, not the return value!

Let’s explore the setImage method –

def setImage(self):
    fileName, _ = QtWidgets.QFileDialog.getOpenFileName(None, "Select Image", "", "Image Files (*.png *.jpg *jpeg *.bmp);;All Files (*)") # Ask for file
    if fileName: # If the user gives a file
        pixmap = QtGui.QPixmap(fileName) # Setup pixmap with the provided image
        pixmap = pixmap.scaled(self.imageLbl.width(), self.imageLbl.height(), QtCore.Qt.KeepAspectRatio) # Scale pixmap
        self.imageLbl.setPixmap(pixmap) # Set the pixmap onto the label
        self.imageLbl.setAlignment(QtCore.Qt.AlignCenter) # Align the label to center

This will prompt the corresponding dialogue box for choosing the right images out of the respective O/S.

Last but not least, the use of MsgBox, which can be extremely useful for many GUI based programming.

This msgbox doesn’t exist in the form. However, we’re creating it on the event of the “Confirm Button” as shown below –

self.cnfBtn = self.findChild(QtWidgets.QPushButton, 'cnfBtn')  # Find the button
self.cnfBtn.clicked.connect(self.showDialog)  # Remember to pass the definition/method, not the return value!

This will prompt the showDialog method to trigger –

def showDialog(self):
    msgBox = QMessageBox()
    msgBox.setIcon(QMessageBox.Information)
    msgBox.setText("Message box pop up window")
    msgBox.setWindowTitle("MessageBox Example")
    msgBox.setStandardButtons(QMessageBox.Ok | QMessageBox.Cancel)
    msgBox.buttonClicked.connect(self.msgButtonClick)

    returnValue = msgBox.exec()
    if returnValue == QMessageBox.Ok:
        print('OK clicked')

And, based on your options (“OK”/”Cancel”), it will prompt the final captured message in your console.

Let’s explore the videos of output from Windows O/S –

Let’s explore the video output from MAC VM –

For more information on this package – please check the following link.

So, as you can see, finally we’ve achieved it. We’ve demonstrated cross-platform GUI applications using native Python. And, here we didn’t even convert the ui design file to python script either.

Please share your feedback.

I’ll be posting another new post in the coming days. Till then, Happy Avenging! 😀

Note: All the data posted here are representational data & available over the internet & for educational purpose only.

Prepare analytics based on streaming data from Twitter using Python

Hi Guys!

Today, we will be projecting an analytics storyline based on streaming data from twitter’s developer account.

I want to make sure that this solely for educational purposes & no data analysis has provided to any agency or third-party apps. So, when you are planning to use this API, make sure that you strictly follow these rules.

In order to create a streaming channel from Twitter, you need to create one developer account.

As I’m a huge soccer fan, I would like to refer to one soccer place on Twitter for this. In this case, we’ll be checking BA Analytics for this.

6. Origin_Site

Please find the steps to create one developer account –

Step -1: 

You have to go to the following link. Over there you need to submit the request in order to create the account. You need to provide proper justification as to why you need that account. I’m not going into those forms. They are self-explanatory.

Once, your developer account activated, you need to click the following link as shown below –

1. TwitterSetup

Once you clicked that, the program will lead to you the following page –

2. TwitterSetup - Continue

If you don’t have any app, the first page will look something like the above page.

Step 2:

3. TwiterSetup - Continue

Now, you need to fill-up the following details. For security reasons, I’ll be hiding sensitive data here.

Step 3:

4. TwitterSetUp - Continue

After creating that, you need to go to the next tab i.e. key’s & tokens. The initial screen will only have Consumer API keys.

Step 4:

To generate the Access token, you need to click the create button from the above screenshot & then the new page will look like this –

5. TwitterSetUp - Continue

Our program will be using all these pieces of information.

So, now we’re ready for our Python program.

In order to access Twitter API through python, you need to install the following package –

pip install python-twitter

Let’s see the directory structure –

7. Directory

Let’s check only the relevant scripts here. We’re not going to discuss the clsL.py as we’ve already discussed. Please refer to the old post.

1. clsConfig.py (This script contains all the parameters of the server.)

##############################################
#### Written By: SATYAKI DE               ####
#### Written On: 12-Oct-2019              ####
####                                      ####
#### Objective: This script is a config   ####
#### file, contains all the keys for      ####
#### azure cosmos db. Application will    ####
#### process these information & perform  ####
#### various CRUD operation on Cosmos DB. ####
##############################################

import os
import platform as pl

class clsConfig(object):
    Curr_Path = os.path.dirname(os.path.realpath(__file__))

    os_det = pl.system()
    if os_det == "Windows":
        sep = '\\'
    else:
        sep = '/'

    config = {
        'APP_ID': 1,
        'EMAIL_SRC_JSON_FILE': Curr_Path + sep + 'src_file' + sep + 'srcEmail.json',
        'TWITTER_SRC_JSON_FILE': Curr_Path + sep + 'src_file' + sep + 'srcTwitter.json',
        'HR_SRC_JSON_FILE': Curr_Path + sep + 'src_file' + sep + 'srcHR.json',
        'ACCESS_TOKEN': '99999999-XXXXXXXXXXXXXXXXXXXXXXXXXXXXXXXXXXXXXXXX',
        'ACCESS_SECRET': 'YYYYYYYYYYYYYYYYYYYYYYYYYYYYYYYYYYYYYYYYYYYYYY',
        'CONSUMER_KEY': "aaaaaaaaaaaaaaaaaaaaaaa",
        'CONSUMER_SECRET': 'HHHHHHHHHHHHHHHHHHHHHHHHHHHHHHHHHHHHHHHHHHHH',
        'ARCH_DIR': Curr_Path + sep + 'arch' + sep,
        'PROFILE_PATH': Curr_Path + sep + 'profile' + sep,
        'LOG_PATH': Curr_Path + sep + 'log' + sep,
        'REPORT_PATH': Curr_Path + sep + 'report',
        'APP_DESC_1': 'Feedback Communication',
        'DEBUG_IND': 'N',
        'INIT_PATH': Curr_Path
    }

For security reasons, I’ve removed the original keys with dummy keys. You have to fill-up your own keys.

2. clsTwitter.py (This script will fetch data from Twitter API & process the same & send it to the calling method.)

###############################################
#### Written By: SATYAKI DE                ####
#### Written On: 12-Oct-2019               ####
#### Modified On 12-Oct-2019               ####
####                                       ####
#### Objective: Main class fetching sample ####
#### data from Twitter API.                ####
###############################################

import twitter
from clsConfig import clsConfig as cf
import json
import re
import string
import logging

class clsTwitter:
    def __init__(self):
        self.access_token = cf.config['ACCESS_TOKEN']
        self.access_secret = cf.config['ACCESS_SECRET']
        self.consumer_key = cf.config['CONSUMER_KEY']
        self.consumer_secret = cf.config['CONSUMER_SECRET']

    def find_element(self, srcJson, key):
        """Pull all values of specified key from nested JSON."""
        arr = []

        def fetch(srcJson, arr, key):
            """Recursively search for values of key in JSON tree."""
            if isinstance(srcJson, dict):
                for k, v in srcJson.items():
                    if isinstance(v, (dict, list)):
                        fetch(v, arr, key)
                    elif k == key:
                        arr.append(v)
            elif isinstance(srcJson, list):
                for item in srcJson:
                    fetch(item, arr, key)
            return arr

        finJson = fetch(srcJson, arr, key)
        return finJson

    def searchQry(self, rawQry):
        try:
            fin_dict = {}
            finJson = ''
            res = ''
            cnt = 0

            # Parameters to invoke Twitter API
            ACCESS_TOKEN = self.access_token
            ACCESS_SECRET = self.access_secret
            CONSUMER_KEY = self.consumer_key
            CONSUMER_SECRET = self.consumer_secret

            tmpR20 = 'Raw Query: ' + str(rawQry)
            logging.info(tmpR20)

            finJson = '['

            if rawQry == '':
                print('No data to proceed!')
                logging.info('No data to proceed!')
            else:
                t = twitter.Api(
                                  consumer_key = CONSUMER_KEY,
                                  consumer_secret = CONSUMER_SECRET,
                                  access_token_key = ACCESS_TOKEN,
                                  access_token_secret = ACCESS_SECRET
                               )

                response = t.GetSearch(raw_query=rawQry)
                print('Total Records fetched:', str(len(response)))

                for i in response:

                    # Converting them to json
                    data = str(i)
                    res_json = json.loads(data)

                    # Calling individual key
                    id = res_json['id']
                    tmpR19 = 'Id: ' + str(id)
                    logging.info(tmpR19)

                    try:
                        f_count = res_json['quoted_status']['user']['followers_count']
                    except:
                        f_count = 0
                    tmpR21 = 'Followers Count: ' + str(f_count)
                    logging.info(tmpR21)

                    try:
                        r_count = res_json['quoted_status']['retweet_count']
                    except:
                        r_count = 0
                    tmpR22 = 'Retweet Count: ' + str(r_count)
                    logging.info(tmpR22)

                    text = self.find_element(res_json, 'text')

                    for j in text:
                        strF = re.sub(f'[^{re.escape(string.printable)}]', '', str(j))
                        pat = re.compile(r'[\t\n]')
                        strG = pat.sub("", strF)
                        res = "".join(strG)

                    # Forming return dictionary
                    #fin_dict.update({id:'id', f_count: 'followerCount', r_count: 'reTweetCount', res: 'msgPost'})
                    if cnt == 0:
                        finJson = finJson + '{"id":' + str(id) + ',"followerCount":' + str(f_count) + ',"reTweetCount":' + str(r_count) + ', "msgPost":"' + str(res) + '"}'
                    else:
                        finJson = finJson + ', {"id":' + str(id) + ',"followerCount":' + str(f_count) + ',"reTweetCount":' + str(r_count) + ', "msgPost":"' + str(res) + '"}'

                    cnt += 1

            finJson = finJson + ']'

            jdata = json.dumps(finJson)
            ResJson = json.loads(jdata)

            return ResJson

        except Exception as e:
            ResJson = ''
            x = str(e)
            print(x)

            logging.info(x)
            ResJson = {'errorDetails' : x}

            return ResJson

The key lines from this snippet are as follows –

def find_element(self, srcJson, key):
    """Pull all values of specified key from nested JSON."""
    arr = []

    def fetch(srcJson, arr, key):
        """Recursively search for values of key in JSON tree."""
        if isinstance(srcJson, dict):
            for k, v in srcJson.items():
                if isinstance(v, (dict, list)):
                    fetch(v, arr, key)
                elif k == key:
                    arr.append(v)
        elif isinstance(srcJson, list):
            for item in srcJson:
                fetch(item, arr, key)
        return arr

    finJson = fetch(srcJson, arr, key)
    return finJson

This function will check against a specific key & based on that it will search from the supplied JSON & returns the value. This would be particularly very useful when you don’t have any fixed position of your elements.

t = twitter.Api(
                  consumer_key = CONSUMER_KEY,
                  consumer_secret = CONSUMER_SECRET,
                  access_token_key = ACCESS_TOKEN,
                  access_token_secret = ACCESS_SECRET
               )

response = t.GetSearch(raw_query=rawQry)

In this case, Python application will receive the JSON response using the new Twitter API.

id = res_json['id']
try:
    f_count = res_json['quoted_status']['user']['followers_count']
except:
    f_count = 0
try:
    r_count = res_json['quoted_status']['retweet_count']
except:
    r_count = 0

Fetching specific fixed position elements from the response API.

text = self.find_element(res_json, 'text')

Fetching the dynamic position based element using our customized function.

for j in text:
    strF = re.sub(f'[^{re.escape(string.printable)}]', '', str(j))
    pat = re.compile(r'[\t\n]')
    strG = pat.sub("", strF)
    res = "".join(strG)

Removing non-printable characters & white spaces from the extracted text field in order to get clean data.

if cnt == 0:
    finJson = finJson + '{"id":' + str(id) + ',"followerCount":' + str(f_count) + ',"reTweetCount":' + str(r_count) + ', "msgPost":"' + str(res) + '"}'
else:
    finJson = finJson + ', {"id":' + str(id) + ',"followerCount":' + str(f_count) + ',"reTweetCount":' + str(r_count) + ', "msgPost":"' + str(res) + '"}'

Finally, generating a JSON string dynamically.

jdata = json.dumps(finJson)
ResJson = json.loads(jdata)

And, returning the JSON to our calling program.

3. callTwitterAPI.py (This is the main script that will invoke the Twitter API & then project the analytic report based on the available Twitter data.)

##############################################
#### Written By: SATYAKI DE               ####
#### Written On: 12-Oct-2019              ####
#### Modified On 12-Oct-2019              ####
####                                      ####
#### Objective: Main calling scripts.     ####
##############################################

from clsConfig import clsConfig as cf
import pandas as p
import clsL as cl
import logging
import datetime
import json
import clsTwitter as ct

# Disbling Warning
def warn(*args, **kwargs):
    pass

import warnings
warnings.warn = warn

def getMaximumFollower(df):
    try:
        d1 = df['followerCount'].max()
        d1_max_str = int(d1)

        return d1_max_str
    except Exception as e:
        x = str(e)
        print(x)
        dt_part1 = 0

        return dt_part1

def getMaximumRetweet(df):
    try:
        d1 = df['reTweetCount'].max()
        d1_max_str = int(d1)

        return d1_max_str
    except Exception as e:
        x = str(e)
        print(x)
        dt_part1 = ''

        return dt_part1

# Lookup functions from
# Azure cloud SQL DB

var = datetime.datetime.now().strftime("%Y-%m-%d_%H-%M-%S")

def main():
    try:
        dfSrc = p.DataFrame()
        df_ret = p.DataFrame()
        ret_2 = ''
        debug_ind = 'Y'

        general_log_path = str(cf.config['LOG_PATH'])

        # Enabling Logging Info
        logging.basicConfig(filename=general_log_path + 'consolidatedTwitter.log', level=logging.INFO)

        # Initiating Log Class
        l = cl.clsL()

        # Moving previous day log files to archive directory
        arch_dir = cf.config['ARCH_DIR']
        log_dir = cf.config['LOG_PATH']

        tmpR0 = "*" * 157

        logging.info(tmpR0)
        tmpR9 = 'Start Time: ' + str(var)
        logging.info(tmpR9)
        logging.info(tmpR0)

        print("Archive Directory:: ", arch_dir)
        print("Log Directory::", log_dir)
        tmpR1 = 'Log Directory::' + log_dir
        logging.info(tmpR1)

        # Query using parameters
        rawQry = 'q=from%3ABlades_analytic&src=typd'

        x1 = ct.clsTwitter()
        ret_2 = x1.searchQry(rawQry)

        # Capturing the JSON Payload
        res = json.loads(ret_2)

        # Converting dictionary to Pandas Dataframe
        df_ret = p.read_json(ret_2, orient='records')

        # Resetting the column orders as per JSON
        df_ret = df_ret[list(res[0].keys())]

        l.logr('1.Twitter_' + var + '.csv', debug_ind, df_ret, 'log')

        print('Realtime Twitter Data:: ')
        logging.info('Realtime Twitter Data:: ')
        print(df_ret)
        print()

        # Checking execution status
        ret_val_2 = df_ret.shape[0]

        if ret_val_2 == 0:
            print("Twitter hasn't returned any rows. Please check your queries!")
            logging.info("Twitter hasn't returned any rows. Please check your queries!")
            print("*" * 157)
            logging.info(tmpR0)
        else:
            print("Successfuly row feteched!")
            logging.info("Successfuly row feteched!")
            print("*" * 157)
            logging.info(tmpR0)

        print('Finding Story points..')
        print("*" * 157)
        logging.info('Finding Story points..')
        logging.info(tmpR0)

        # Performing Basic Aggregate
        # 1. Find the user who has maximum Followers
        df_ret['MaxFollower'] = getMaximumFollower(df_ret)

        # 2. Find the user who has maximum Re-Tweets
        df_ret['MaxTweet'] = getMaximumRetweet(df_ret)

        # Getting Status
        df_MaxFollower = df_ret[(df_ret['followerCount'] == df_ret['MaxFollower'])]

        # Dropping Columns
        df_MaxFollower.drop(['reTweetCount'], axis=1, inplace=True)
        df_MaxFollower.drop(['MaxTweet'], axis=1, inplace=True)

        l.logr('2.Twitter_Maximum_Follower_' + var + '.csv', debug_ind, df_MaxFollower, 'log')

        print('Maximum Follower:: ')
        print(df_MaxFollower)
        print("*" * 157)
        logging.info(tmpR0)

        df_MaxTwitter = df_ret[(df_ret['reTweetCount'] == df_ret['MaxTweet'])]
        print()

        # Dropping Columns
        df_MaxTwitter.drop(['followerCount'], axis=1, inplace=True)
        df_MaxTwitter.drop(['MaxFollower'], axis=1, inplace=True)

        l.logr('3.Twitter_Maximum_Retweet_' + var + '.csv', debug_ind, df_MaxTwitter, 'log')

        print('Maximum Re-Twitt:: ')
        print(df_MaxTwitter)
        print("*" * 157)
        logging.info(tmpR0)

        tmpR10 = 'End Time: ' + str(var)
        logging.info(tmpR10)
        logging.info(tmpR0)

    except ValueError:
        print("No relevant data to proceed!")
        logging.info("No relevant data to proceed!")

    except Exception as e:
        print("Top level Error: args:{0}, message{1}".format(e.args, e.message))

if __name__ == "__main__":
    main()

And, here are the key lines –

x1 = ct.clsTwitter()
ret_2 = x1.searchQry(rawQry)

Our application is instantiating the newly developed class.

# Capturing the JSON Payload
res = json.loads(ret_2)

# Converting dictionary to Pandas Dataframe
df_ret = p.read_json(ret_2, orient='records')

# Resetting the column orders as per JSON
df_ret = df_ret[list(res[0].keys())]

Converting the JSON to pandas dataframe for our analytic data point.

def getMaximumFollower(df):
    try:
        d1 = df['followerCount'].max()
        d1_max_str = int(d1)

        return d1_max_str
    except Exception as e:
        x = str(e)
        print(x)
        dt_part1 = 0

        return dt_part1

def getMaximumRetweet(df):
    try:
        d1 = df['reTweetCount'].max()
        d1_max_str = int(d1)

        return d1_max_str
    except Exception as e:
        x = str(e)
        print(x)
        dt_part1 = ''

        return dt_part1

These two functions declared above in the calling script are generating the maximum data point from the Re-Tweet & Followers from our returned dataset.

# Getting Status
df_MaxFollower = df_ret[(df_ret['followerCount'] == df_ret['MaxFollower'])]

And, this is the way, our application will fetch the maximum twitter dataset –

df_MaxTwitter = df_ret[(df_ret['reTweetCount'] == df_ret['MaxTweet'])]

And, you can customize your output by dropping unwanted columns in the specific dataset.

And, here is the output on Windows, which looks like –

8. WindowsRun

And, here is the windows log directory –

WindowsRunLog

So, we’ve achieved our target data point.

So, we’ll come out with another exciting post in the coming days!

N.B.: This is demonstrated for RnD/study purposes. All the data posted here are representational data & available over the internet.

Explaining New Python Library – Regular Expression in JSON

Hi Guys!

As discussed, here is the continuation of the previous post. We’ll explain the regular expression from the library that I’ve created recently.

First, let me share the calling script for regular expression –

##############################################
#### Written By: SATYAKI DE               ####
#### Written On: 08-Sep-2019              ####
####                                      ####
#### Objective: Main calling scripts.     ####
##############################################

from dnpr.clsDnpr import clsDnpr
import datetime as dt
import json

# Disbling Warning
def warn(*args, **kwargs):
    pass

import warnings
warnings.warn = warn

# Lookup functions from
# Azure cloud SQL DB

def main():
    try:
        # Initializing the class
        t = clsDnpr()
        
        srcJson = [
                    {"FirstName": "Satyaki", "LastName": "De", "Sal": 1000},
                    {"FirstName": "Satyaki", "LastName": "De", "Sal": 1000},
                    {"FirstName": "Archi", "LastName": "Bose", "Sal": 500},
                    {"FirstName": "Archi", "LastName": "Bose", "Sal": 7000},
                    {"FirstName": "Deb", "LastName": "Sen", "Sal": 9500}
                  ]

        print("4. Checking regular expression functionality!")
        print()

        var13 = dt.datetime.now().strftime("%Y-%m-%d %H-%M-%S")
        print("Start Time: ", str(var13))

        print('::Function Regex_Like:: ')
        print()

        tarColumn = 'FirstName'
        print('Target Column for Rexex_Like: ', tarColumn)
        inpPattern = r"\bSa"
        print('Input Pattern: ', str(inpPattern))

        # Invoking the distinct function
        tarJson = t.regex_like(srcJson, tarColumn, inpPattern)

        print('End of Function Regex_Like!')
        print()

        print("*" * 157)
        print("Output Data: ")
        tarJsonFormat = json.dumps(tarJson, indent=1)
        print(str(tarJsonFormat))
        print("*" * 157)

        if not tarJson:
            print()
            print("No relevant output data!")
            print("*" * 157)
        else:
            print()
            print("Relevant output data comes!")
            print("*" * 157)

        var14 = dt.datetime.now().strftime("%Y-%m-%d %H-%M-%S")
        print("End Time: ", str(var14))

        var15 = dt.datetime.now().strftime("%Y-%m-%d %H-%M-%S")
        print("Start Time: ", str(var15))

        print('::Function Regex_Replace:: ')
        print()

        tarColumn = 'FirstName'
        print('Target Column for Rexex_Replace: ', tarColumn)
        inpPattern = r"\bSa"
        print('Input Pattern: ', str(inpPattern))
        replaceString = 'Ka'
        print('Replacing Character: ', replaceString)

        # Invoking the distinct function
        tarJson = t.regex_replace(srcJson, tarColumn, inpPattern, replaceString)

        print('End of Function Rexex_Replace!')
        print()

        print("*" * 157)
        print("Output Data: ")
        tarJsonFormat = json.dumps(tarJson, indent=1)
        print(str(tarJsonFormat))
        print("*" * 157)

        if not tarJson:
            print()
            print("No relevant output data!")
            print("*" * 157)
        else:
            print()
            print("Relevant output data comes!")
            print("*" * 157)

        var16 = dt.datetime.now().strftime("%Y-%m-%d %H-%M-%S")
        print("End Time: ", str(var16))

        var17 = dt.datetime.now().strftime("%Y-%m-%d %H-%M-%S")
        print("Start Time: ", str(var17))

        print('::Function Regex_Substr:: ')
        print()

        tarColumn = 'FirstName'
        print('Target Column for Regex_Substr: ', tarColumn)
        inpPattern = r"\bSa"
        print('Input Pattern: ', str(inpPattern))

        # Invoking the distinct function
        tarJson = t.regex_substr(srcJson, tarColumn, inpPattern)

        print('End of Function Regex_Substr!')
        print()

        print("*" * 157)
        print("Output Data: ")
        tarJsonFormat = json.dumps(tarJson, indent=1)
        print(str(tarJsonFormat))
        print("*" * 157)

        if not tarJson:
            print()
            print("No relevant output data!")
            print("*" * 157)
        else:
            print()
            print("Relevant output data comes!")
            print("*" * 157)

        var18 = dt.datetime.now().strftime("%Y-%m-%d %H-%M-%S")
        print("End Time: ", str(var18))

        print("=" * 157)
        print("End of regular expression function!")
        print("=" * 157)


    except ValueError:
        print("No relevant data to proceed!")

    except Exception as e:
        print("Top level Error: args:{0}, message{1}".format(e.args, e.message))

if __name__ == "__main__":
    main()

As per the library, we’ll discuss the following functionalities –

  1. regex_like
  2. regex_replace
  3. regex_substr

Now, let us check how to call these functions.

1. regex_like:

Following is the base skeleton in order to invoke this function –

regex_like(Input Json, Target Column, Pattern To Match) return Output Json

Here are the key lines in the script –

srcJson = [
            {"FirstName": "Satyaki", "LastName": "De", "Sal": 1000},
            {"FirstName": "Satyaki", "LastName": "De", "Sal": 1000},
            {"FirstName": "Archi", "LastName": "Bose", "Sal": 500},
            {"FirstName": "Archi", "LastName": "Bose", "Sal": 7000},
            {"FirstName": "Deb", "LastName": "Sen", "Sal": 9500}
          ]

# Invoking the distinct function
tarJson = t.regex_like(srcJson, tarColumn, inpPattern)

2. regex_replace:

Following is the base skeleton in order to invoke this function –

regex_replace(Input Json, Target Column, Pattern to Replace) return Output Json

Here are the key lines in the script –

tarColumn = 'FirstName'
print('Target Column for Rexex_Replace: ', tarColumn)
inpPattern = r"\bSa"
print('Input Pattern: ', str(inpPattern))
replaceString = 'Ka'
print('Replacing Character: ', replaceString)

# Invoking the distinct function
tarJson = t.regex_replace(srcJson, tarColumn, inpPattern, replaceString)

As you can see, here ‘Sa’ with ‘Ka’ provided it matches the specific pattern in the JSON.

3. regex_replace:

Following is the base skeleton in order to invoke this function –

regex_substr(Input Json, Target Column, Pattern to substring) return Output Json

Here are the key lines –

tarColumn = 'FirstName'
print('Target Column for Regex_Substr: ', tarColumn)
inpPattern = r"\bSa"
print('Input Pattern: ', str(inpPattern))

# Invoking the distinct function
tarJson = t.regex_substr(srcJson, tarColumn, inpPattern)

In this case, we’ve subtracted a part of the JSON string & return the final result as JSON.

Let us first see the sample input JSON –

SourceJSON_Regex

Let us check how it looks when we run the calling script –

  • regex_like:
Regex_Like

This function will retrieve the elements, which will start with ‘Sa‘. As a result, we’ll see the following two elements in the Payload.

  • regex_replace:
Regex_Replace

In this case, we’re replacing any string which starts with ‘Sa‘ & replaced with the ‘Ka‘.

  • regex_substr:
Regex_Substr

As you can see that the first element FirstName changed the name from “Satyaki” to “tyaki“.

So, finally, we’ve achieved our target.

I’ll post the next exciting concept very soon.

Till then! Happy Avenging! 😀

N.B.: This is demonstrated for RnD/study purposes. All the data posted here are representational data & available over the internet.