RAG implementation of LLMs by using Python, Haystack & React (Part – 1)

Today, I will share a new post in a part series about creating end-end LLMs that feed source data with RAG implementation. I’ll also use OpenAI python-based SDK and Haystack embeddings in this case.

In this post, I’ve directly subscribed to OpenAI & I’m not using OpenAI from Azure. However, I’ll explore that in the future as well.

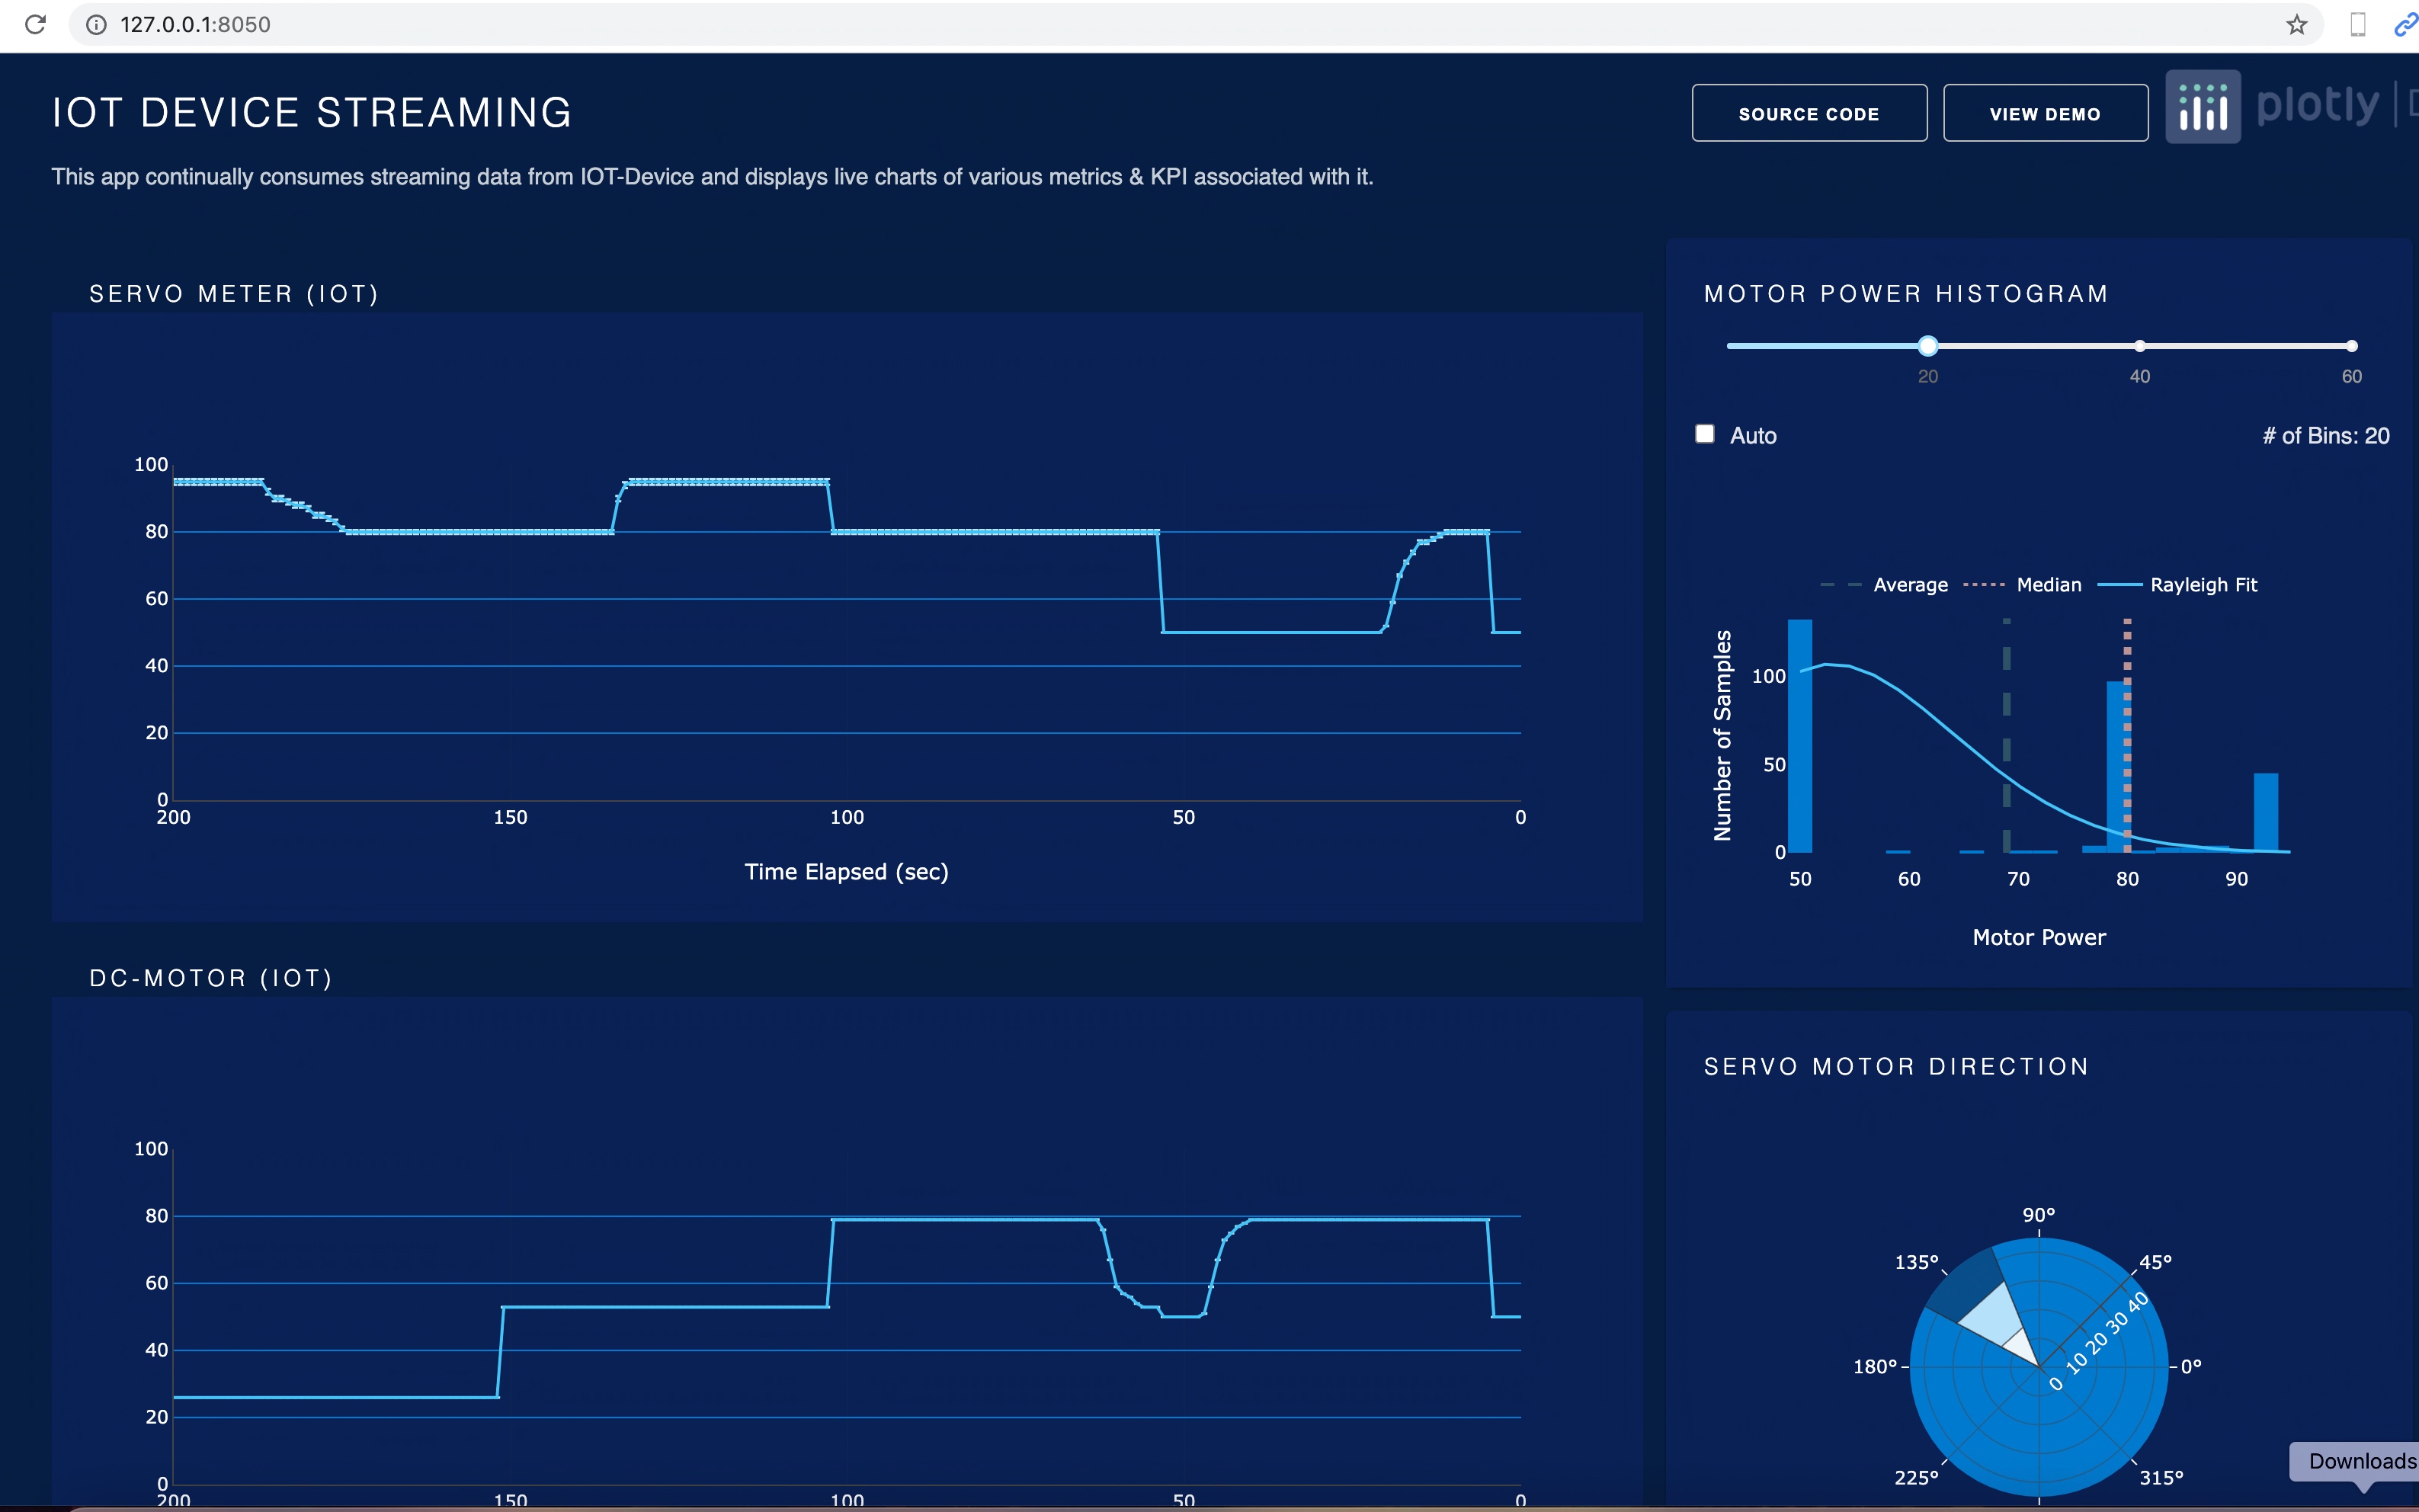
Before I explain the process to invoke this new library, why not view the demo first & then discuss it?

Demo

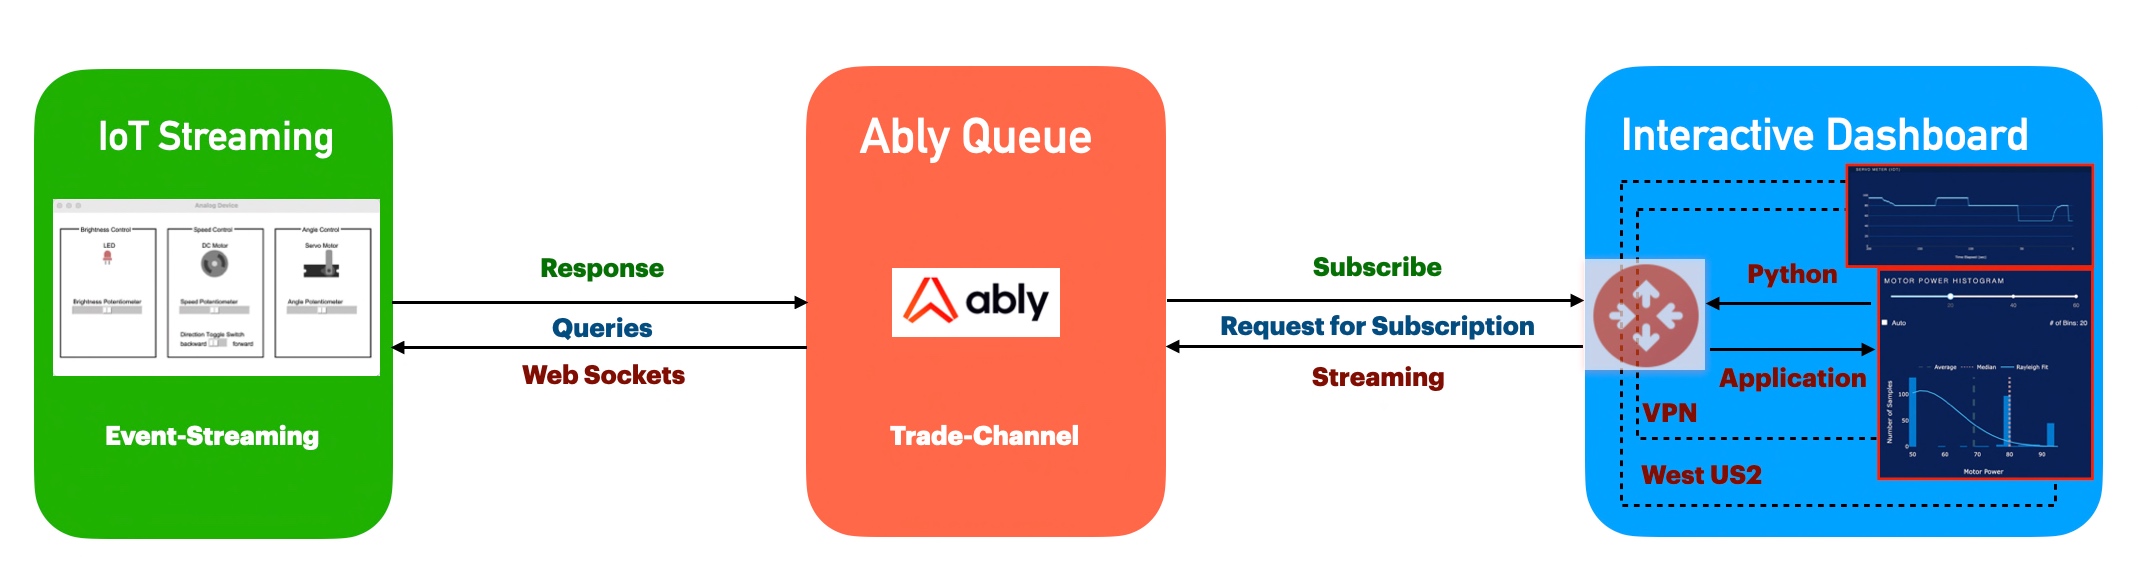
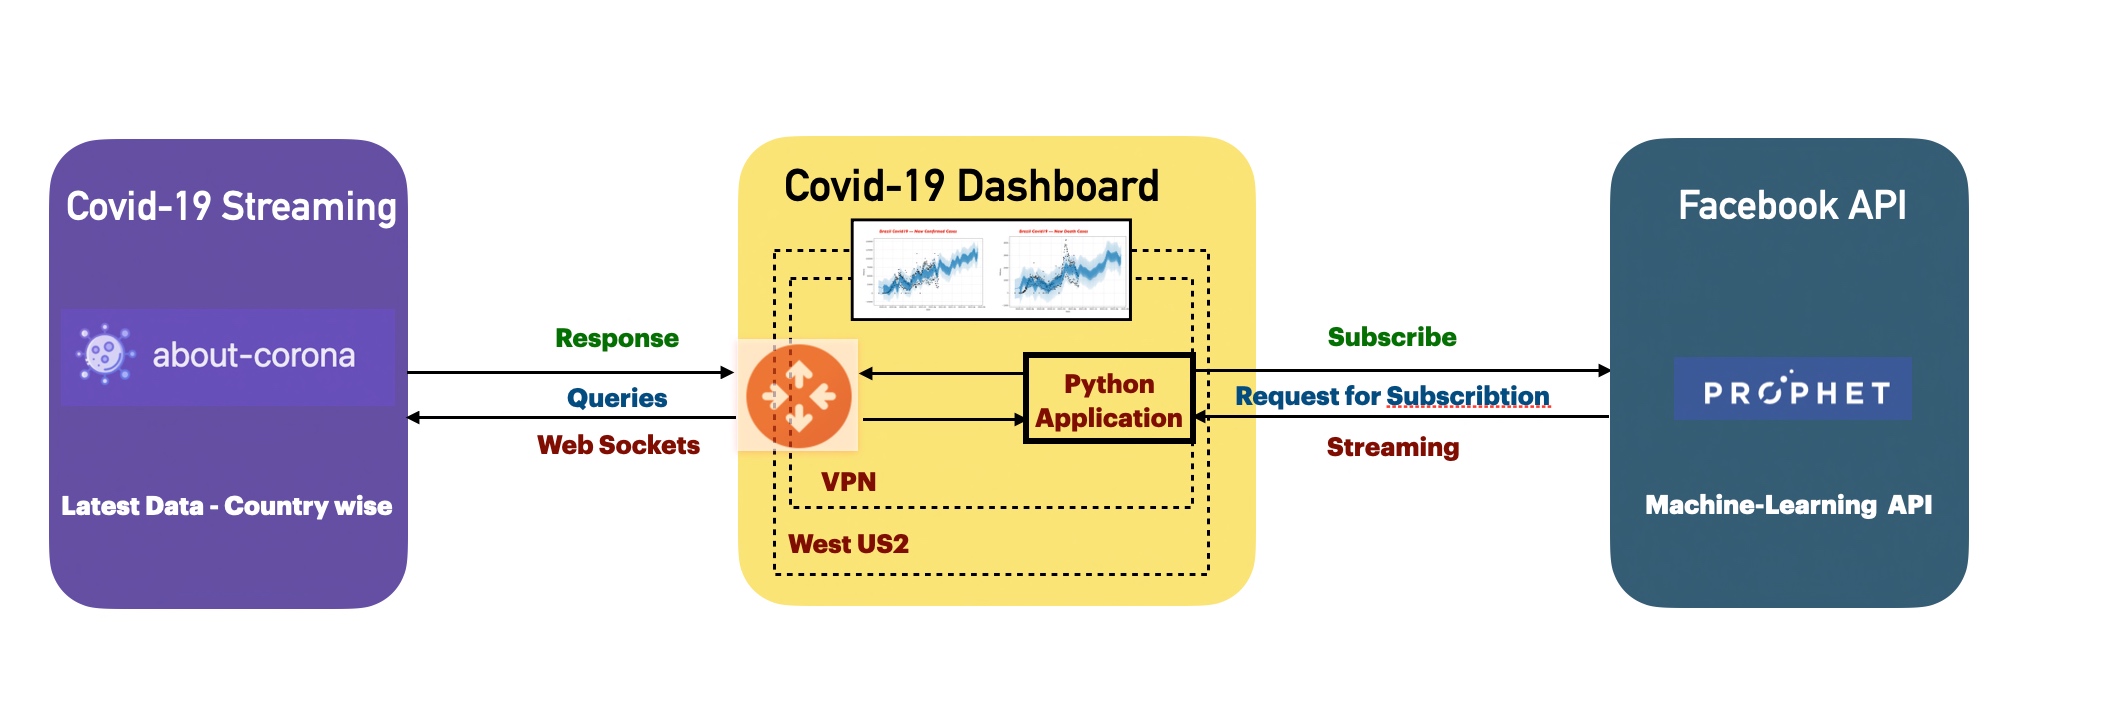
Let us look at the flow diagram as it captures the sequence of events that unfold as part of the process.

As you can see, to enable this large & complex solution, we must first establish the capabilities to build applications powered by LLMs, Transformer models, vector search, and more. You can use state-of-the-art NLP models to perform question-answering, answer generation, semantic document search, or build tools capable of complex decision-making and query resolution. Hence, steps no. 1 & 2 showcased the data embedding & creating that informed repository. We’ll be discussing that in our second part.

Once you have the informed repository, the system can interact with the end-users. As part of the query (shown in step 3), the prompt & the question are shared with the process engine, which then turned to reduce the volume & get relevant context from our informed repository & get the tuned context as part of the response (Shown in steps 4, 5 & 6).

Then, this tuned context is shared with the OpenAI for better response & summary & concluding remarks that are very user-friendly & easier to understand for end-users (Shown in steps 8 & 9).

The following are the important packages that are essential to this project –

pip install farm-haystack==1.19.0
pip install Flask==2.2.5
pip install Flask-Cors==4.0.0
pip install Flask-JWT-Extended==4.5.2
pip install Flask-Session==0.5.0
pip install openai==0.27.8
pip install pandas==2.0.3
pip install tensorflow==2.11.1

We’ve both the front-end using react & back-end APIs with Python-flask and the Open AI to create this experience.

Today, we’ll be going in reverse mode. We first discuss the main script & then explain all the other class scripts.

  • flaskServer.py (This is the main calling Python script to invoke the RAG-Server.)
#########################################################
#### Written By: SATYAKI DE                          ####
#### Written On: 27-Jun-2023                         ####
#### Modified On 28-Jun-2023                         ####
####                                                 ####
#### Objective: This is the main calling             ####
#### python script that will invoke the              ####
#### shortcut application created inside MAC         ####
#### enviornment including MacBook, IPad or IPhone.  ####
####                                                 ####
#########################################################

from flask import Flask, jsonify, request, session
from flask_cors import CORS
from werkzeug.security import check_password_hash, generate_password_hash
from flask_jwt_extended import JWTManager, jwt_required, create_access_token
import pandas as pd
from clsConfigClient import clsConfigClient as cf
import clsL as log
import clsContentScrapper as csc
import clsRAGOpenAI as crao
import csv
from datetime import timedelta
import os
import re
import json

########################################################
################    Global Area   ######################
########################################################
#Initiating Logging Instances
clog = log.clsL()

admin_key = cf.conf['ADMIN_KEY']
secret_key = cf.conf['SECRET_KEY']
session_path = cf.conf['SESSION_PATH']
sessionFile = cf.conf['SESSION_CACHE_FILE']

app = Flask(__name__)
CORS(app)  # This will enable CORS for all routes
app.config['JWT_SECRET_KEY'] = admin_key  # Change this!
app.secret_key = secret_key

jwt = JWTManager(app)

users = cf.conf['USER_NM']
passwd = cf.conf['USER_PWD']

cCScrapper = csc.clsContentScrapper()
cr = crao.clsRAGOpenAI()

# Disbling Warning
def warn(*args, **kwargs):
    pass

import warnings
warnings.warn = warn

# Define the aggregation functions
def join_unique(series):
    unique_vals = series.drop_duplicates().astype(str)
    return ', '.join(filter(lambda x: x != 'nan', unique_vals))

# Building the preaggregate cache
def groupImageWiki():
    try:
        base_path = cf.conf['OUTPUT_PATH']
        inputFile = cf.conf['CLEANED_FILE']
        outputFile = cf.conf['CLEANED_FILE_SHORT']
        subdir = cf.conf['SUBDIR_OUT']
        Ind = cf.conf['DEBUG_IND']

        inputCleanedFileLookUp = base_path + inputFile

        #Opening the file in dataframe
        df = pd.read_csv(inputCleanedFileLookUp)
        hash_values = df['Total_Hash'].unique()

        dFin = df[['primaryImage','Wiki_URL','Total_Hash']]

        # Ensure columns are strings and not NaN
        # Convert columns to string and replace 'nan' with an empty string
        dFin['primaryImage'] = dFin['primaryImage'].astype(str).replace('nan', '')
        dFin['Wiki_URL'] = dFin['Wiki_URL'].astype(str).replace('nan', '')

        dFin.drop_duplicates()

        # Group by 'Total_Hash' and aggregate
        dfAgg = dFin.groupby('Total_Hash').agg({'primaryImage': join_unique,'Wiki_URL': join_unique}).reset_index()

        return dfAgg

    except Exception as e:
        x = str(e)
        print('Error: ', x)

        df = pd.DataFrame()

        return df

resDf = groupImageWiki()

########################################################
################  End  Global Area  ####################
########################################################

def extractRemoveUrls(hash_value):
    image_urls = ''
    wiki_urls = ''
    # Parse the inner message JSON string
    try:

        resDf['Total_Hash'] = resDf['Total_Hash'].astype(int)
        filtered_df = resDf[resDf['Total_Hash'] == int(hash_value)]

        if not filtered_df.empty:
            image_urls = filtered_df['primaryImage'].values[0]
            wiki_urls = filtered_df['Wiki_URL'].values[0]

        return image_urls, wiki_urls

    except Exception as e:
        x = str(e)
        print('extractRemoveUrls Error: ', x)
        return image_urls, wiki_urls

def isIncomplete(line):
    """Check if a line appears to be incomplete."""

    # Check if the line ends with certain patterns indicating it might be incomplete.
    incomplete_patterns = [': [Link](', ': Approximately ', ': ']
    return any(line.endswith(pattern) for pattern in incomplete_patterns)

def filterData(data):
    """Return only the complete lines from the data."""

    lines = data.split('\n')
    complete_lines = [line for line in lines if not isIncomplete(line)]

    return '\n'.join(complete_lines)

def updateCounter(sessionFile):
    try:
        counter = 0

        # Check if the CSV file exists
        if os.path.exists(sessionFile):
            with open(sessionFile, 'r') as f:
                reader = csv.reader(f)
                for row in reader:
                    # Assuming the counter is the first value in the CSV
                    counter = int(row[0])

        # Increment counter
        counter += 1

        # Write counter back to CSV
        with open(sessionFile, 'w', newline='') as f:
            writer = csv.writer(f)
            writer.writerow([counter])

        return counter
    except Exception as e:
        x = str(e)
        print('Error: ', x)

        return 1

def getPreviousResult():
    try:
        fullFileName = session_path + sessionFile
        newCounterValue = updateCounter(fullFileName)

        return newCounterValue
    except Exception as e:
        x = str(e)
        print('Error: ', x)

        return 1

@app.route('/login', methods=['POST'])
def login():
    username = request.json.get('username', None)
    password = request.json.get('password', None)

    print('User Name: ', str(username))
    print('Password: ', str(password))

    #if username not in users or not check_password_hash(users.get(username), password):
    if ((username not in users) or (password not in passwd)):
        return jsonify({'login': False}), 401

    access_token = create_access_token(identity=username)
    return jsonify(access_token=access_token)

@app.route('/chat', methods=['POST'])
def get_chat():
    try:
        #session["key"] = "1D98KI"
        #session_id = session.sid
        #print('Session Id: ', str(session_id))

        cnt = getPreviousResult()
        print('Running Session Count: ', str(cnt))

        username = request.json.get('username', None)
        message = request.json.get('message', None)

        print('User: ', str(username))
        print('Content: ', str(message))

        if cnt == 1:
            retList = cCScrapper.extractCatalog()
        else:
            hashValue, cleanedData = cr.getData(str(message))
            print('Main Hash Value:', str(hashValue))

            imageUrls, wikiUrls = extractRemoveUrls(hashValue)
            print('Image URLs: ', str(imageUrls))
            print('Wiki URLs: ', str(wikiUrls))
            print('Clean Text:')
            print(str(cleanedData))
            retList = '{"records":[{"Id":"' + str(cleanedData) + '", "Image":"' + str(imageUrls) + '", "Wiki": "' + str(wikiUrls) + '"}]}'

        response = {
            'message': retList
        }

        print('JSON: ', str(response))
        return jsonify(response)

    except Exception as e:
        x = str(e)

        response = {
            'message': 'Error: ' + x
        }
        return jsonify(response)

@app.route('/api/data', methods=['GET'])
@jwt_required()
def get_data():
    response = {
        'message': 'Hello from Flask!'
    }
    return jsonify(response)

if __name__ == '__main__':
    app.run(debug=True)

Let us understand some of the important sections of the above script –

Function – login():

The login function retrieves a ‘username’ and ‘password’ from a JSON request and prints them. It checks if the provided credentials are missing from users or password lists, returning a failure JSON response if so. It creates and returns an access token in a JSON response if valid.

Function – get_chat():

The get_chat function retrieves the running session count and user input from a JSON request. Based on the session count, it extracts catalog data or processes the user’s message from the RAG framework that finally receives the refined response from the OpenAI, extracting hash values, image URLs, and wiki URLs. If an error arises, the function captures and returns the error as a JSON message.

Function – updateCounter():

The updateCounter function checks if a given CSV file exists and retrieves its counter value. It then increments the counter and writes it back to the CSV. If any errors occur, an error message is printed, and the function returns a value of 1.

Function – extractRemoveUrls():

The extractRemoveUrls function attempts to filter a data frame, resDf, based on a provided hash value to extract image and wiki URLs. If the data frame contains matching entries, it retrieves the corresponding URLs. Any errors encountered are printed, but the function always returns the image and wiki URLs, even if they are empty.

  • clsContentScrapper.py (This is the main class that brings the default options for the users if they agree with the initial prompt by the bot.)
#####################################################
#### Written By: SATYAKI DE                      ####
#### Written On: 27-May-2023                     ####
#### Modified On 28-May-2023                     ####
####                                             ####
#### Objective: This is the main calling         ####
#### python class that will invoke the           ####
#### LangChain of package to extract             ####
#### the transcript from the YouTube videos &    ####
#### then answer the questions based on the      ####
#### topics selected by the users.               ####
####                                             ####
#####################################################

from langchain.document_loaders import YoutubeLoader
from langchain.text_splitter import RecursiveCharacterTextSplitter
from langchain.embeddings.openai import OpenAIEmbeddings
from langchain.vectorstores import FAISS
from langchain.chat_models import ChatOpenAI
from langchain.chains import LLMChain

from langchain.prompts.chat import (
    ChatPromptTemplate,
    SystemMessagePromptTemplate,
    HumanMessagePromptTemplate,
)

from googleapiclient.discovery import build

import clsTemplate as ct
from clsConfigClient import clsConfigClient as cf

import os

from flask import jsonify
import requests

###############################################
###           Global Section                ###
###############################################
open_ai_Key = cf.conf['OPEN_AI_KEY']
os.environ["OPENAI_API_KEY"] = open_ai_Key
embeddings = OpenAIEmbeddings(openai_api_key=open_ai_Key)

YouTube_Key = cf.conf['YOUTUBE_KEY']
youtube = build('youtube', 'v3', developerKey=YouTube_Key)

# Disbling Warning
def warn(*args, **kwargs):
    pass

import warnings
warnings.warn = warn

###############################################
###    End of Global Section                ###
###############################################

class clsContentScrapper:
    def __init__(self):
        self.model_name = cf.conf['MODEL_NAME']
        self.temp_val = cf.conf['TEMP_VAL']
        self.max_cnt = int(cf.conf['MAX_CNT'])
        self.url = cf.conf['BASE_URL']
        self.header_token = cf.conf['HEADER_TOKEN']

    def extractCatalog(self):
        try:
            base_url = self.url
            header_token = self.header_token

            url = base_url + '/departments'

            print('Full URL: ', str(url))

            payload={}
            headers = {'Cookie': header_token}

            response = requests.request("GET", url, headers=headers, data=payload)

            x = response.text

            return x
        except Exception as e:
            discussedTopic = []
            x = str(e)
            print('Error: ', x)

            return x

Let us understand the the core part that require from this class.

Function – extractCatalog():

The extractCatalog function uses specific headers to make a GET request to a constructed URL. The URL is derived by appending ‘/departments’ to a base_url, and a header token is used in the request headers. If successful, it returns the text of the response; if there’s an exception, it prints the error and returns the error message.

  • clsRAGOpenAI.py (This is the main class that brings the RAG-enabled context that is fed to OpenAI for fine-tuned response with less cost.)
#########################################################
#### Written By: SATYAKI DE                          ####
#### Written On: 27-Jun-2023                         ####
#### Modified On 28-Jun-2023                         ####
####                                                 ####
#### Objective: This is the main calling             ####
#### python script that will invoke the              ####
#### shortcut application created inside MAC         ####
#### enviornment including MacBook, IPad or IPhone.  ####
####                                                 ####
#########################################################

from haystack.document_stores.faiss import FAISSDocumentStore
from haystack.nodes import DensePassageRetriever
import openai

from clsConfigClient import clsConfigClient as cf
import clsL as log

# Disbling Warning
def warn(*args, **kwargs):
    pass

import warnings
warnings.warn = warn

import os
import re
###############################################
###           Global Section                ###
###############################################
Ind = cf.conf['DEBUG_IND']
queryModel = cf.conf['QUERY_MODEL']
passageModel = cf.conf['PASSAGE_MODEL']

#Initiating Logging Instances
clog = log.clsL()

os.environ["TOKENIZERS_PARALLELISM"] = "false"

vectorDBFileName = cf.conf['VECTORDB_FILE_NM']

indexFile = "vectorDB/" + str(vectorDBFileName) + '.faiss'
indexConfig = "vectorDB/" + str(vectorDBFileName) + ".json"

print('File: ', str(indexFile))
print('Config: ', str(indexConfig))

# Also, provide `config_path` parameter if you set it when calling the `save()` method:
new_document_store = FAISSDocumentStore.load(index_path=indexFile, config_path=indexConfig)

# Initialize Retriever
retriever = DensePassageRetriever(document_store=new_document_store,
                                  query_embedding_model=queryModel,
                                  passage_embedding_model=passageModel,
                                  use_gpu=False)


###############################################
###    End of Global Section                ###
###############################################

class clsRAGOpenAI:
    def __init__(self):
        self.basePath = cf.conf['DATA_PATH']
        self.fileName = cf.conf['FILE_NAME']
        self.Ind = cf.conf['DEBUG_IND']
        self.subdir = str(cf.conf['OUT_DIR'])
        self.base_url = cf.conf['BASE_URL']
        self.outputPath = cf.conf['OUTPUT_PATH']
        self.vectorDBPath = cf.conf['VECTORDB_PATH']
        self.openAIKey = cf.conf['OPEN_AI_KEY']
        self.temp = cf.conf['TEMP_VAL']
        self.modelName = cf.conf['MODEL_NAME']
        self.maxToken = cf.conf['MAX_TOKEN']

    def extractHash(self, text):
        try:
            # Regular expression pattern to match 'Ref: {' followed by a number and then '}'
            pattern = r"Ref: \{'(\d+)'\}"
            match = re.search(pattern, text)

            if match:
                return match.group(1)
            else:
                return None
        except Exception as e:
            x = str(e)
            print('Error: ', x)

            return None

    def removeSentencesWithNaN(self, text):
        try:
            # Split text into sentences using regular expression
            sentences = re.split('(?<!\w\.\w.)(?<![A-Z][a-z]\.)(?<=\.|\?)\s', text)
            # Filter out sentences containing 'nan'
            filteredSentences = [sentence for sentence in sentences if 'nan' not in sentence]
            # Rejoin the sentences
            return ' '.join(filteredSentences)
        except Exception as e:
            x = str(e)
            print('Error: ', x)

            return ''

    def retrieveDocumentsReader(self, question, top_k=9):
        return retriever.retrieve(question, top_k=top_k)

    def generateAnswerWithGPT3(self, retrieved_docs, question):
        try:
            openai.api_key = self.openAIKey
            temp = self.temp
            modelName = self.modelName
            maxToken = self.maxToken

            documentsText = " ".join([doc.content for doc in retrieved_docs])

            filteredDocs = self.removeSentencesWithNaN(documentsText)
            hashValue = self.extractHash(filteredDocs)

            print('RAG Docs:: ')
            print(filteredDocs)
            #prompt = f"Given the following documents: {documentsText}, answer the question accurately based on the above data with the supplied http urls: {question}"

            # Set up a chat-style prompt with your data
            messages = [
                {"role": "system", "content": "You are a helpful assistant, answer the question accurately based on the above data with the supplied http urls. Only relevant content needs to publish. Please do not provide the facts or the texts that results crossing the max_token limits."},
                {"role": "user", "content": filteredDocs}
            ]

            # Chat style invoking the latest model
            response = openai.ChatCompletion.create(
                model=modelName,
                messages=messages,
                temperature = temp,
                max_tokens=maxToken
            )
            return hashValue, response.choices[0].message['content'].strip().replace('\n','\\n')
        except Exception as e:
            x = str(e)
            print('failed to get from OpenAI: ', x)
            return 'Not Available!'

    def ragAnswerWithHaystackAndGPT3(self, question):
        retrievedDocs = self.retrieveDocumentsReader(question)
        return self.generateAnswerWithGPT3(retrievedDocs, question)

    def getData(self, strVal):
        try:
            print('*'*120)
            print('Index Your Data for Retrieval:')
            print('*'*120)

            print('Response from New Docs: ')
            print()

            hashValue, answer = self.ragAnswerWithHaystackAndGPT3(strVal)

            print('GPT3 Answer::')
            print(answer)
            print('Hash Value:')
            print(str(hashValue))

            print('*'*240)
            print('End Of Use RAG to Generate Answers:')
            print('*'*240)

            return hashValue, answer
        except Exception as e:
            x = str(e)
            print('Error: ', x)
            answer = x
            hashValue = 1

            return hashValue, answer

Let us understand some of the important block –

Function – ragAnswerWithHaystackAndGPT3():

The ragAnswerWithHaystackAndGPT3 function retrieves relevant documents for a given question using the retrieveDocumentsReader method. It then generates an answer for the query using GPT-3 with the retrieved documents via the generateAnswerWithGPT3 method. The final response is returned.

Function – generateAnswerWithGPT3():

The generateAnswerWithGPT3 function, given a list of retrieved documents and a question, communicates with OpenAI’s GPT-3 to generate an answer. It first processes the documents, filtering and extracting a hash value. Using a chat-style format, it prompts GPT-3 with the processed documents and captures its response. If an error occurs, an error message is printed, and “Not Available!” is returned.

Function – retrieveDocumentsReader():

The retrieveDocumentsReader function takes in a question and an optional parameter, top_k (defaulted to 9). It is called the retriever.retrieve method with the given parameters. The result of the retrieval will generate at max nine responses from the RAG engine, which will be fed to OpenAI.

  • App.js (This is the main react script, that will create the interface & parse the data apart from the authentication)
// App.js
import React, { useState } from 'react';
import axios from 'axios';
import './App.css';

const App = () => {
  const [isLoggedIn, setIsLoggedIn] = useState(false);
  const [username, setUsername] = useState('');
  const [password, setPassword] = useState('');
  const [message, setMessage] = useState('');
  const [chatLog, setChatLog] = useState([{ sender: 'MuBot', message: 'Welcome to MuBot! Please explore the world of History from our brilliant collections! Do you want to proceed to see the catalog?'}]);

  const handleLogin = async (e) => {
    e.preventDefault();
    try {
      const response = await axios.post('http://localhost:5000/login', { username, password });
      if (response.status === 200) {
        setIsLoggedIn(true);
      }
    } catch (error) {
      console.error('Login error:', error);
    }
  };

  const sendMessage = async (username) => {
    if (message.trim() === '') return;

    // Create a new chat entry
    const newChatEntry = {
      sender: 'user',
      message: message.trim(),
    };

    // Clear the input field
    setMessage('');

    try {
      // Make API request to Python-based API
      const response = await axios.post('http://localhost:5000/chat', { message: newChatEntry.message }); // Replace with your API endpoint URL
      const responseData = response.data;

      // Print the response to the console for debugging
      console.log('API Response:', responseData);

      // Parse the nested JSON from the 'message' attribute
      const jsonData = JSON.parse(responseData.message);

      // Check if the data contains 'departments'
      if (jsonData.departments) {

        // Extract the 'departments' attribute from the parsed data
        const departments = jsonData.departments;

        // Extract the department names and create a single string with line breaks
        const botResponseText = departments.reduce((acc, department) => {return acc + department.departmentId + ' ' + department.displayName + '\n';}, '');

        // Update the chat log with the bot's response
        setChatLog((prevChatLog) => [...prevChatLog, { sender: 'user', message: message }, { sender: 'bot', message: botResponseText },]);
      }
      else if (jsonData.records)
      {
        // Data structure 2: Artwork information
        const records = jsonData.records;

        // Prepare chat entries
        const chatEntries = [];

        // Iterate through records and extract text, image, and wiki information
        records.forEach((record) => {
          const textInfo = Object.entries(record).map(([key, value]) => {
            if (key !== 'Image' && key !== 'Wiki') {
              return `${key}: ${value}`;
            }
            return null;
          }).filter((info) => info !== null).join('\n');

          const imageLink = record.Image;
          //const wikiLinks = JSON.parse(record.Wiki.replace(/'/g, '"'));
          //const wikiLinks = record.Wiki;
          const wikiLinks = record.Wiki.split(',').map(link => link.trim());

          console.log('Wiki:', wikiLinks);

          // Check if there is a valid image link
          const hasValidImage = imageLink && imageLink !== '[]';

          const imageElement = hasValidImage ? (
            <img src={imageLink} alt="Artwork" style={{ maxWidth: '100%' }} />
          ) : null;

          // Create JSX elements for rendering the wiki links (if available)
          const wikiElements = wikiLinks.map((link, index) => (
            <div key={index}>
              <a href={link} target="_blank" rel="noopener noreferrer">
                Wiki Link {index + 1}
              </a>
            </div>
          ));

          if (textInfo) {
            chatEntries.push({ sender: 'bot', message: textInfo });
          }

          if (imageElement) {
            chatEntries.push({ sender: 'bot', message: imageElement });
          }

          if (wikiElements.length > 0) {
            chatEntries.push({ sender: 'bot', message: wikiElements });
          }
        });

        // Update the chat log with the bot's response
        setChatLog((prevChatLog) => [...prevChatLog, { sender: 'user', message }, ...chatEntries, ]);
      }

    } catch (error) {
      console.error('Error sending message:', error);
    }
  };

  if (!isLoggedIn) {
    return (
      <div className="login-container">
        <h2>Welcome to the MuBot</h2>
        <form onSubmit={handleLogin} className="login-form">
          <input
            type="text"
            placeholder="Enter your name"
            value={username}
            onChange={(e) => setUsername(e.target.value)}
            required
          />
          <input
            type="password"
            placeholder="Enter your password"
            value={password}
            onChange={(e) => setPassword(e.target.value)}
            required
          />
          <button type="submit">Login</button>
        </form>
      </div>
    );
  }

  return (
    <div className="chat-container">
      <div className="chat-header">
        <h2>Hello, {username}</h2>
        <h3>Chat with MuBot</h3>
      </div>
      <div className="chat-log">
        {chatLog.map((chatEntry, index) => (
          <div
            key={index}
            className={`chat-entry ${chatEntry.sender === 'user' ? 'user' : 'bot'}`}
          >
            <span className="user-name">{chatEntry.sender === 'user' ? username : 'MuBot'}</span>
            <p className="chat-message">{chatEntry.message}</p>
          </div>
        ))}
      </div>
      <div className="chat-input">
        <input
          type="text"
          placeholder="Type your message..."
          value={message}
          onChange={(e) => setMessage(e.target.value)}
          onKeyPress={(e) => {
            if (e.key === 'Enter') {
              sendMessage();
            }
          }}
        />
        <button onClick={sendMessage}>Send</button>
      </div>
    </div>
  );
};

export default App;

Please find some of the important logic –

Function – handleLogin():

The handleLogin asynchronous function responds to an event by preventing its default action. It attempts to post a login request with a username and password to a local server endpoint. If the response is successful with a status of 200, it updates a state variable to indicate a successful login; otherwise, it logs any encountered errors.

Function – sendMessage():

The sendMessage asynchronous function is designed to handle the user’s chat interaction:

  1. If the message is empty (after trimming spaces), the function exits without further action.
  2. A chat entry object is created with the sender set as ‘user’ and the trimmed message.
  3. The input field’s message is cleared, and an API request is made to a local server endpoint with the chat message.
  4. If the API responds with a ‘departments’ attribute in its JSON, a bot response is crafted by iterating over department details.
  5. If the API responds with ‘records’ indicating artwork information, the bot crafts responses for each record, extracting text, images, and wiki links, and generating JSX elements for rendering them.
  6. After processing the API response, the chat log state is updated with the user’s original message and the bot’s responses.
  7. Errors, if encountered, are logged to the console.

This function enables interactive chat with bot responses that vary based on the nature of the data received from the API.
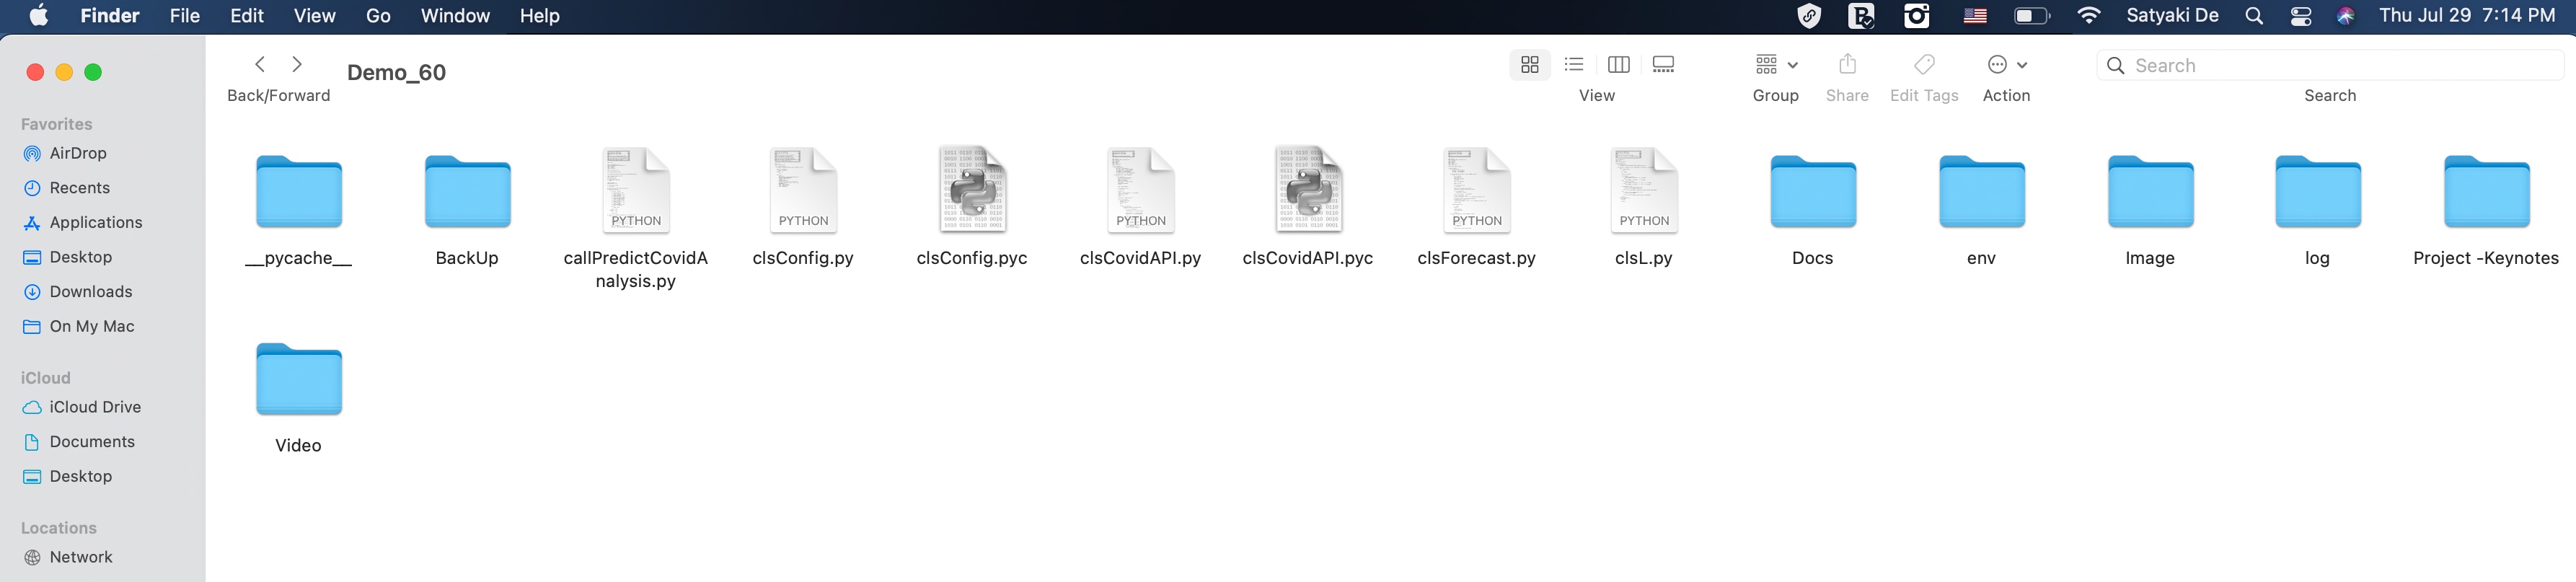

Let us explore the directory structure starting from the parent to some of the important child folder should look like this –


So, finally, we’ve done it.

I know that this post is relatively bigger than my earlier post. But, I think, you can get all the details once you go through it.

You will get the complete codebase in the following GitHub link.

I’ll bring some more exciting topics in the coming days from the Python verse. Please share & subscribe to my post & let me know your feedback.

Till then, Happy Avenging! 🙂

Scanned data extraction from a prefilled form using OpenCV & Python

This week we will discuss another important topic that many of us had in our mind. Today, we’ll try extracting the texts from scanned, formatted forms. This use case is instrumental when we need to process information prefilled by someone or some process.

To make things easier, I’ve packaged my entire solution & published that as a PyPi package after a long time. But, even before I start, why don’t we see the demo & then discuss it in detail?

Demo

Architecture:

Let us understand the architecture flow –

Reference Pattern

From the above diagram, one can understand the overall flow of this process. We’ll be using our second PyPi package, which will scan the source scanned copy of a formatted page & then tries to extract the relevant information.

Python Packages:

Following are the key python packages that we need apart from these dependent created packages & they are as follows –

cmake==3.22.1
dlib==19.19.0
imutils==0.5.3
jsonschema==4.4.0
numpy==1.23.2
oauthlib==3.1.1
opencv-contrib-python==4.6.0.66
opencv-contrib-python-headless==4.4.0.46
opencv-python==4.6.0.66
opencv-python-headless==4.5.5.62
pandas==1.4.3
python-dateutil==2.8.2
pytesseract==0.3.10
requests==2.27.1
requests-oauthlib==1.3.0

And the newly created package –

ReadingFilledForm==0.0.7

To know more about this, please visit the following PyPi link.


CODE:

Let us now understand the code. For this use case, we will only discuss three python scripts. However, we need more than these three. However, we have already discussed them in some of the early posts. Hence, we will skip them here.

  • clsConfigClient.py (This is the configuration class of the python script that will extract the text from the preformatted scanned copy.)


################################################
#### Written By: SATYAKI DE ####
#### Written On: 15-May-2020 ####
#### Modified On: 18-Sep-2022 ####
#### ####
#### Objective: This script is a config ####
#### file, contains all the keys for ####
#### text extraction via image scanning. ####
#### ####
################################################
import os
import platform as pl
my_dict = {}
class clsConfigClient(object):
Curr_Path = os.path.dirname(os.path.realpath(__file__))
os_det = pl.system()
if os_det == "Windows":
sep = '\\'
else:
sep = '/'
conf = {
'APP_ID': 1,
'ARCH_DIR': Curr_Path + sep + 'arch' + sep,
'PROFILE_PATH': Curr_Path + sep + 'profile' + sep,
'LOG_PATH': Curr_Path + sep + 'log' + sep,
'REPORT_PATH': Curr_Path + sep + 'report',
'SRC_PATH': Curr_Path + sep + 'data' + sep,
'FINAL_PATH': Curr_Path + sep + 'Target' + sep,
'IMAGE_PATH': Curr_Path + sep + 'Scans' + sep,
'TEMPLATE_PATH': Curr_Path + sep + 'Template' + sep,
'APP_DESC_1': 'Text Extraction from Video!',
'DEBUG_IND': 'N',
'INIT_PATH': Curr_Path,
'SUBDIR': 'data',
'WIDTH': 320,
'HEIGHT': 320,
'PADDING': 0.1,
'SEP': sep,
'MIN_CONFIDENCE':0.5,
'GPU':-1,
'FILE_NAME':'FilledUp.jpeg',
'TEMPLATE_FILE_NAME':'Template.jpeg',
'TITLE': "Text Reading!",
'ORIG_TITLE': "Camera Source!",
'LANG':"en",
'OEM_VAL': 1,
'PSM_VAL': 7,
'DRAW_TAG': (0, 0, 255),
'LAYER_DET':[
"feature_fusion/Conv_7/Sigmoid",
"feature_fusion/concat_3"],
"CACHE_LIM": 1,
'ASCII_RANGE': 128,
'SUBTRACT_PARAM': (123.68, 116.78, 103.94),
'MY_DICT': {
"atrib_1": {"id": "FileNo", "bbox": (425, 60, 92, 34), "filter_keywords": tuple(["FILE", "DEPT"])},
"atrib_2": {"id": "DeptNo", "bbox": (545, 60, 87, 40), "filter_keywords": tuple(["DEPT", "CLOCK"])},
"atrib_3": {"id": "ClockNo", "bbox": (673, 60, 75, 36), "filter_keywords": tuple(["CLOCK","VCHR.","NO."])},
"atrib_4": {"id": "VCHRNo", "bbox": (785, 60, 136, 40), "filter_keywords": tuple(["VCHR.","NO."])},
"atrib_5": {"id": "DigitNo", "bbox": (949, 60, 50, 38), "filter_keywords": tuple(["VCHR.","NO.", "056"])},
"atrib_6": {"id": "CompanyName", "bbox": (326, 140, 621, 187), "filter_keywords": tuple(["COMPANY","FILE"])},
"atrib_7": {"id": "StartDate", "bbox": (1264, 143, 539, 44), "filter_keywords": tuple(["Period", "Beginning:"])},
"atrib_8": {"id": "EndDate", "bbox": (1264, 193, 539, 44), "filter_keywords": tuple(["Period", "Ending:"])},
"atrib_9": {"id": "PayDate", "bbox": (1264, 233, 539, 44), "filter_keywords": tuple(["Pay", "Date:"])},
}
}

The only important part of these configurations are the following –

'MY_DICT': {
            "atrib_1": {"id": "FileNo", "bbox": (425, 60, 92, 34), "filter_keywords": tuple(["FILE", "DEPT"])},
            "atrib_2": {"id": "DeptNo", "bbox": (545, 60, 87, 40), "filter_keywords": tuple(["DEPT", "CLOCK"])},
            "atrib_3": {"id": "ClockNo", "bbox": (673, 60, 75, 36), "filter_keywords": tuple(["CLOCK","VCHR.","NO."])},
            "atrib_4": {"id": "VCHRNo", "bbox": (785, 60, 136, 40), "filter_keywords": tuple(["VCHR.","NO."])},
            "atrib_5": {"id": "DigitNo", "bbox": (949, 60, 50, 38), "filter_keywords": tuple(["VCHR.","NO.", "056"])},
            "atrib_6": {"id": "CompanyName", "bbox": (326, 140, 621, 187), "filter_keywords": tuple(["COMPANY","FILE"])},
            "atrib_7": {"id": "StartDate", "bbox": (1264, 143, 539, 44), "filter_keywords": tuple(["Period", "Beginning:"])},
            "atrib_8": {"id": "EndDate", "bbox": (1264, 193, 539, 44), "filter_keywords": tuple(["Period", "Ending:"])},
            "atrib_9": {"id": "PayDate", "bbox": (1264, 233, 539, 44), "filter_keywords": tuple(["Pay", "Date:"])},
      }

Let us understand this part, as it is very critical for this entire package.

We need to define the areas in terms of pixel position, which we need to extract. Hence, we follow the following pattern –

"atrib_": {"id": , "bbox": (x-Coordinates, y-Coordinates, Width, Height), "filter_keywords": tuple(["Mention the overlapping printed text that you don't want to capture. Make sure you are following the exact Case to proper detection."])}

You can easily get the individual intended text position by using any Photo editor.

Still not clear how to select?

Let’s watch the next video –

How to fetch the extracted location pixel metadata – Demo

The above demo should explain what we are trying to achieve. Also, you need to understand that if your two values are extremely close, then we’re taking both the non-desired labels & put them under the filter keywords to ensure extracting the correct values.

For example, on the top left side, where the values are very close, we’re putting both closed labels as filter keywords. One such example is as follows –

"filter_keywords": tuple(["FILE", "DEPT"])

The same logic applies to the other labels as well.

  • readingFormLib.py (This is the main calling python script that will extract the text from the preformatted scanned copy.)


#####################################################
#### Written By: SATYAKI DE ####
#### Written On: 22-Jul-2022 ####
#### Modified On 18-Sep-2022 ####
#### ####
#### Objective: This is the main calling ####
#### python script that will invoke the ####
#### clsReadForm class to initiate ####
#### the reading capability in real-time ####
#### & display text from a formatted forms. ####
#####################################################
# We keep the setup code in a different class as shown below.
from ReadingFilledForm import clsReadForm as rf
from clsConfigClient import clsConfigClient as cf
import datetime
import logging
###############################################
### Global Section ###
###############################################
# Instantiating all the main class
scannedImagePath = str(cf.conf['IMAGE_PATH']) + str(cf.conf['FILE_NAME'])
templatePath = str(cf.conf['TEMPLATE_PATH']) + str(cf.conf['TEMPLATE_FILE_NAME'])
x1 = rf.clsReadForm(scannedImagePath, templatePath)
###############################################
### End of Global Section ###
###############################################
def main():
try:
# Other useful variables
debugInd = 'Y'
var = datetime.datetime.now().strftime("%Y-%m-%d_%H-%M-%S")
var1 = datetime.datetime.now()
print('Start Time: ', str(var))
# End of useful variables
# Initiating Log Class
general_log_path = str(cf.conf['LOG_PATH'])
# Enabling Logging Info
logging.basicConfig(filename=general_log_path + 'readingForm.log', level=logging.INFO)
print('Started extracting text from formatted forms!')
# Getting the dictionary
my_dict = cf.conf['MY_DICT']
# Execute all the pass
r1 = x1.startProcess(debugInd, var, my_dict)
if (r1 == 0):
print('Successfully extracted text from the formatted forms!')
else:
print('Failed to extract the text from the formatted forms!')
var2 = datetime.datetime.now()
c = var2 – var1
minutes = c.total_seconds() / 60
print('Total difference in minutes: ', str(minutes))
print('End Time: ', str(var1))
except Exception as e:
x = str(e)
print('Error: ', x)
if __name__ == "__main__":
main()

Key snippets from the above script –

# We keep the setup code in a different class as shown below.
from ReadingFilledForm import clsReadForm as rf

from clsConfigClient import clsConfigClient as cf

The above lines import the newly created PyPi package into the memory.

###############################################
###           Global Section                ###
###############################################
# Instantiating all the main class
scannedImagePath = str(cf.conf['IMAGE_PATH']) + str(cf.conf['FILE_NAME'])
templatePath = str(cf.conf['TEMPLATE_PATH']) + str(cf.conf['TEMPLATE_FILE_NAME'])

x1 = rf.clsReadForm(scannedImagePath, templatePath)

###############################################
###    End of Global Section                ###
###############################################

Now, the application is fetching both the template copy & the intended scanned copy & load them into the memory.

# Getting the dictionary
my_dict = cf.conf['MY_DICT']

After this, the application will try to extract the focus area dictionary, indicating the areas of particular interest.

# Execute all the pass
r1 = x1.startProcess(debugInd, var, my_dict)

Finally, pass it inside the new package to get the correct outcome.


FOLDER STRUCTURE:

Here is the folder structure that contains all the files & directories in MAC O/S –

Directory

Similar structures are present in the Windows environment as well.


You will get the complete calling codebase in the following GitHub link.

I’ll bring some more exciting topics in the coming days from the Python verse. Please share & subscribe to my post & let me know your feedback.

Till then, Happy Avenging! 🙂

Note: All the data & scenarios posted here are representational data & scenarios & available over the internet & for educational purposes only. There is always room for improvement & especially in the prediction quality.

Live visual reading using Convolutional Neural Network (CNN) through Python-based machine-learning application.

This week we’re planning to touch on one of the exciting posts of visually reading characters from WebCAM & predict the letters using CNN methods. Before we dig deep, why don’t we see the demo run first?

Demo

Isn’t it fascinating? As we can see, the computer can record events and read like humans. And, thanks to the brilliant packages available in Python, which can help us predict the correct letter out of an Image.


What do we need to test it out?

  1. Preferably an external WebCAM.
  2. A moderate or good Laptop to test out this.
  3. Python 
  4. And a few other packages that we’ll mention next block.

What Python packages do we need?

Some of the critical packages that we must need to test out this application are –

cmake==3.22.1
dlib==19.19.0
face-recognition==1.3.0
face-recognition-models==0.3.0
imutils==0.5.3
jsonschema==4.4.0
keras==2.7.0
Keras-Preprocessing==1.1.2
matplotlib==3.5.1
matplotlib-inline==0.1.3
oauthlib==3.1.1
opencv-contrib-python==4.1.2.30
opencv-contrib-python-headless==4.4.0.46
opencv-python==4.5.5.62
opencv-python-headless==4.5.5.62
pickleshare==0.7.5
Pillow==9.0.0
python-dateutil==2.8.2
requests==2.27.1
requests-oauthlib==1.3.0
scikit-image==0.19.1
scikit-learn==1.0.2
tensorboard==2.7.0
tensorboard-data-server==0.6.1
tensorboard-plugin-wit==1.8.1
tensorflow==2.7.0
tensorflow-estimator==2.7.0
tensorflow-io-gcs-filesystem==0.23.1
tqdm==4.62.3

What is CNN?

In deep learning, a convolutional neural network (CNN/ConvNet) is a class of deep neural networks most commonly applied to analyze visual imagery.

Different Steps of CNN

We can understand from the above picture that a CNN generally takes an image as input. The neural network analyzes each pixel separately. The weights and biases of the model are then tweaked to detect the desired letters (In our use case) from the image. Like other algorithms, the data also has to pass through pre-processing stage. However, a CNN needs relatively less pre-processing than most other Deep Learning algorithms.

If you want to know more about this, there is an excellent article on CNN with some on-point animations explaining this concept. Please read it here.

Where do we get the data sets for our testing?

For testing, we are fortunate enough to have Kaggle with us. We have received a wide variety of sample data, which you can get from here.


Our use-case:

Architecture

From the above diagram, one can see that the python application will consume a live video feed of any random letters (both printed & handwritten) & predict the character as part of the machine learning model that we trained.


Code:

  1. clsConfig.py (Configuration file for the entire application.)


################################################
#### Written By: SATYAKI DE ####
#### Written On: 15-May-2020 ####
#### Modified On: 28-Dec-2021 ####
#### ####
#### Objective: This script is a config ####
#### file, contains all the keys for ####
#### Machine-Learning & streaming dashboard.####
#### ####
################################################
import os
import platform as pl
class clsConfig(object):
Curr_Path = os.path.dirname(os.path.realpath(__file__))
os_det = pl.system()
if os_det == "Windows":
sep = '\\'
else:
sep = '/'
conf = {
'APP_ID': 1,
'ARCH_DIR': Curr_Path + sep + 'arch' + sep,
'PROFILE_PATH': Curr_Path + sep + 'profile' + sep,
'LOG_PATH': Curr_Path + sep + 'log' + sep,
'REPORT_PATH': Curr_Path + sep + 'report',
'FILE_NAME': Curr_Path + sep + 'Data' + sep + 'A_Z_Handwritten_Data.csv',
'SRC_PATH': Curr_Path + sep + 'data' + sep,
'APP_DESC_1': 'Old Video Enhancement!',
'DEBUG_IND': 'N',
'INIT_PATH': Curr_Path,
'SUBDIR': 'data',
'SEP': sep,
'testRatio':0.2,
'valRatio':0.2,
'epochsVal':8,
'activationType':'relu',
'activationType2':'softmax',
'numOfClasses':26,
'kernelSize':(3, 3),
'poolSize':(2, 2),
'filterVal1':32,
'filterVal2':64,
'filterVal3':128,
'stridesVal':2,
'monitorVal':'val_loss',
'paddingVal1':'same',
'paddingVal2':'valid',
'reshapeVal':28,
'reshapeVal1':(28,28),
'patienceVal1':1,
'patienceVal2':2,
'sleepTime':3,
'sleepTime1':6,
'factorVal':0.2,
'learningRateVal':0.001,
'minDeltaVal':0,
'minLrVal':0.0001,
'verboseFlag':0,
'modeInd':'auto',
'shuffleVal':100,
'DenkseVal1':26,
'DenkseVal2':64,
'DenkseVal3':128,
'predParam':9,
'word_dict':{0:'A',1:'B',2:'C',3:'D',4:'E',5:'F',6:'G',7:'H',8:'I',9:'J',10:'K',11:'L',12:'M',13:'N',14:'O',15:'P',16:'Q',17:'R',18:'S',19:'T',20:'U',21:'V',22:'W',23:'X', 24:'Y',25:'Z'},
'width':640,
'height':480,
'imgSize': (32,32),
'threshold': 0.45,
'imgDimension': (400, 440),
'imgSmallDim': (7, 7),
'imgMidDim': (28, 28),
'reshapeParam1':1,
'reshapeParam2':28,
'colorFeed':(0,0,130),
'colorPredict':(0,25,255)
}

view raw

clsConfig.py

hosted with ❤ by GitHub

Important parameters that we need to follow from the above snippets are –

'testRatio':0.2,
'valRatio':0.2,
'epochsVal':8,
'activationType':'relu',
'activationType2':'softmax',
'numOfClasses':26,
'kernelSize':(3, 3),
'poolSize':(2, 2),
'word_dict':{0:'A',1:'B',2:'C',3:'D',4:'E',5:'F',6:'G',7:'H',8:'I',9:'J',10:'K',11:'L',12:'M',13:'N',14:'O',15:'P',16:'Q',17:'R',18:'S',19:'T',20:'U',21:'V',22:'W',23:'X', 24:'Y',25:'Z'},

Since we have 26 letters, we have classified it as 26 in the numOfClasses.

Since we are talking about characters, we had to come up with a process of identifying each character as numbers & then processing our entire logic. Hence, the above parameter named word_dict captured all the characters in a python dictionary & stored them. Moreover, the application translates the final number output to more appropriate characters as the prediction.

2. clsAlphabetReading.py (Main training class to teach the model to predict alphabets from visual reader.)


###############################################
#### Written By: SATYAKI DE ####
#### Written On: 17-Jan-2022 ####
#### Modified On 17-Jan-2022 ####
#### ####
#### Objective: This python script will ####
#### teach & perfect the model to read ####
#### visual alphabets using Convolutional ####
#### Neural Network (CNN). ####
###############################################
from keras.datasets import mnist
import matplotlib.pyplot as plt
import cv2
import numpy as np
from keras.models import Sequential
from keras.layers import Dense, Flatten, Conv2D, MaxPool2D, Dropout
from tensorflow.keras.optimizers import SGD, Adam
from keras.callbacks import ReduceLROnPlateau, EarlyStopping
from keras.utils.np_utils import to_categorical
import pandas as p
import numpy as np
from sklearn.model_selection import train_test_split
from keras.utils import np_utils
import matplotlib.pyplot as plt
from tqdm import tqdm_notebook
from sklearn.utils import shuffle
import pickle
import os
import platform as pl
from clsConfig import clsConfig as cf
class clsAlphabetReading:
def __init__(self):
self.sep = str(cf.conf['SEP'])
self.Curr_Path = str(cf.conf['INIT_PATH'])
self.fileName = str(cf.conf['FILE_NAME'])
self.testRatio = float(cf.conf['testRatio'])
self.valRatio = float(cf.conf['valRatio'])
self.epochsVal = int(cf.conf['epochsVal'])
self.activationType = str(cf.conf['activationType'])
self.activationType2 = str(cf.conf['activationType2'])
self.numOfClasses = int(cf.conf['numOfClasses'])
self.kernelSize = cf.conf['kernelSize']
self.poolSize = cf.conf['poolSize']
self.filterVal1 = int(cf.conf['filterVal1'])
self.filterVal2 = int(cf.conf['filterVal2'])
self.filterVal3 = int(cf.conf['filterVal3'])
self.stridesVal = int(cf.conf['stridesVal'])
self.monitorVal = str(cf.conf['monitorVal'])
self.paddingVal1 = str(cf.conf['paddingVal1'])
self.paddingVal2 = str(cf.conf['paddingVal2'])
self.reshapeVal = int(cf.conf['reshapeVal'])
self.reshapeVal1 = cf.conf['reshapeVal1']
self.patienceVal1 = int(cf.conf['patienceVal1'])
self.patienceVal2 = int(cf.conf['patienceVal2'])
self.sleepTime = int(cf.conf['sleepTime'])
self.sleepTime1 = int(cf.conf['sleepTime1'])
self.factorVal = float(cf.conf['factorVal'])
self.learningRateVal = float(cf.conf['learningRateVal'])
self.minDeltaVal = int(cf.conf['minDeltaVal'])
self.minLrVal = float(cf.conf['minLrVal'])
self.verboseFlag = int(cf.conf['verboseFlag'])
self.modeInd = str(cf.conf['modeInd'])
self.shuffleVal = int(cf.conf['shuffleVal'])
self.DenkseVal1 = int(cf.conf['DenkseVal1'])
self.DenkseVal2 = int(cf.conf['DenkseVal2'])
self.DenkseVal3 = int(cf.conf['DenkseVal3'])
self.predParam = int(cf.conf['predParam'])
self.word_dict = cf.conf['word_dict']
def applyCNN(self, X_Train, Y_Train_Catg, X_Validation, Y_Validation_Catg):
try:
testRatio = self.testRatio
epochsVal = self.epochsVal
activationType = self.activationType
activationType2 = self.activationType2
numOfClasses = self.numOfClasses
kernelSize = self.kernelSize
poolSize = self.poolSize
filterVal1 = self.filterVal1
filterVal2 = self.filterVal2
filterVal3 = self.filterVal3
stridesVal = self.stridesVal
monitorVal = self.monitorVal
paddingVal1 = self.paddingVal1
paddingVal2 = self.paddingVal2
reshapeVal = self.reshapeVal
patienceVal1 = self.patienceVal1
patienceVal2 = self.patienceVal2
sleepTime = self.sleepTime
sleepTime1 = self.sleepTime1
factorVal = self.factorVal
learningRateVal = self.learningRateVal
minDeltaVal = self.minDeltaVal
minLrVal = self.minLrVal
verboseFlag = self.verboseFlag
modeInd = self.modeInd
shuffleVal = self.shuffleVal
DenkseVal1 = self.DenkseVal1
DenkseVal2 = self.DenkseVal2
DenkseVal3 = self.DenkseVal3
model = Sequential()
model.add(Conv2D(filters=filterVal1, kernel_size=kernelSize, activation=activationType, input_shape=(28,28,1)))
model.add(MaxPool2D(pool_size=poolSize, strides=stridesVal))
model.add(Conv2D(filters=filterVal2, kernel_size=kernelSize, activation=activationType, padding = paddingVal1))
model.add(MaxPool2D(pool_size=poolSize, strides=stridesVal))
model.add(Conv2D(filters=filterVal3, kernel_size=kernelSize, activation=activationType, padding = paddingVal2))
model.add(MaxPool2D(pool_size=poolSize, strides=stridesVal))
model.add(Flatten())
model.add(Dense(DenkseVal2,activation = activationType))
model.add(Dense(DenkseVal3,activation = activationType))
model.add(Dense(DenkseVal1,activation = activationType2))
model.compile(optimizer = Adam(learning_rate=learningRateVal), loss='categorical_crossentropy', metrics=['accuracy'])
reduce_lr = ReduceLROnPlateau(monitor=monitorVal, factor=factorVal, patience=patienceVal1, min_lr=minLrVal)
early_stop = EarlyStopping(monitor=monitorVal, min_delta=minDeltaVal, patience=patienceVal2, verbose=verboseFlag, mode=modeInd)
fittedModel = model.fit(X_Train, Y_Train_Catg, epochs=epochsVal, callbacks=[reduce_lr, early_stop], validation_data = (X_Validation,Y_Validation_Catg))
return (model, fittedModel)
except Exception as e:
x = str(e)
model = Sequential()
print('Error: ', x)
return (model, model)
def trainModel(self, debugInd, var):
try:
sep = self.sep
Curr_Path = self.Curr_Path
fileName = self.fileName
epochsVal = self.epochsVal
valRatio = self.valRatio
predParam = self.predParam
testRatio = self.testRatio
reshapeVal = self.reshapeVal
numOfClasses = self.numOfClasses
sleepTime = self.sleepTime
sleepTime1 = self.sleepTime1
shuffleVal = self.shuffleVal
reshapeVal1 = self.reshapeVal1
# Dictionary for getting characters from index values
word_dict = self.word_dict
print('File Name: ', str(fileName))
# Read the data
df_HW_Alphabet = p.read_csv(fileName).astype('float32')
# Sample Data
print('Sample Data: ')
print(df_HW_Alphabet.head())
# Split data the (x – Our data) & (y – the prdict label)
x = df_HW_Alphabet.drop('0',axis = 1)
y = df_HW_Alphabet['0']
# Reshaping the data in csv file to display as an image
X_Train, X_Test, Y_Train, Y_Test = train_test_split(x, y, test_size = testRatio)
X_Train, X_Validation, Y_Train, Y_Validation = train_test_split(X_Train, Y_Train, test_size = valRatio)
X_Train = np.reshape(X_Train.values, (X_Train.shape[0], reshapeVal, reshapeVal))
X_Test = np.reshape(X_Test.values, (X_Test.shape[0], reshapeVal, reshapeVal))
X_Validation = np.reshape(X_Validation.values, (X_Validation.shape[0], reshapeVal, reshapeVal))
print("Train Data Shape: ", X_Train.shape)
print("Test Data Shape: ", X_Test.shape)
print("Validation Data shape: ", X_Validation.shape)
# Plotting the number of alphabets in the dataset
Y_Train_Num = np.int0(y)
count = np.zeros(numOfClasses, dtype='int')
for i in Y_Train_Num:
count[i] +=1
alphabets = []
for i in word_dict.values():
alphabets.append(i)
fig, ax = plt.subplots(1,1, figsize=(7,7))
ax.barh(alphabets, count)
plt.xlabel("Number of elements ")
plt.ylabel("Alphabets")
plt.grid()
plt.show(block=False)
plt.pause(sleepTime)
plt.close()
# Shuffling the data
shuff = shuffle(X_Train[:shuffleVal])
# Model reshaping the training & test dataset
X_Train = X_Train.reshape(X_Train.shape[0],X_Train.shape[1],X_Train.shape[2],1)
print("Shape of Train Data: ", X_Train.shape)
X_Test = X_Test.reshape(X_Test.shape[0], X_Test.shape[1], X_Test.shape[2],1)
print("Shape of Test Data: ", X_Test.shape)
X_Validation = X_Validation.reshape(X_Validation.shape[0], X_Validation.shape[1], X_Validation.shape[2],1)
print("Shape of Validation data: ", X_Validation.shape)
# Converting the labels to categorical values
Y_Train_Catg = to_categorical(Y_Train, num_classes = numOfClasses, dtype='int')
print("Shape of Train Labels: ", Y_Train_Catg.shape)
Y_Test_Catg = to_categorical(Y_Test, num_classes = numOfClasses, dtype='int')
print("Shape of Test Labels: ", Y_Test_Catg.shape)
Y_Validation_Catg = to_categorical(Y_Validation, num_classes = numOfClasses, dtype='int')
print("Shape of validation labels: ", Y_Validation_Catg.shape)
model, history = self.applyCNN(X_Train, Y_Train_Catg, X_Validation, Y_Validation_Catg)
print('Model Summary: ')
print(model.summary())
# Displaying the accuracies & losses for train & validation set
print("Validation Accuracy :", history.history['val_accuracy'])
print("Training Accuracy :", history.history['accuracy'])
print("Validation Loss :", history.history['val_loss'])
print("Training Loss :", history.history['loss'])
# Displaying the Loss Graph
plt.figure(1)
plt.plot(history.history['loss'])
plt.plot(history.history['val_loss'])
plt.legend(['training','validation'])
plt.title('Loss')
plt.xlabel('epoch')
plt.show(block=False)
plt.pause(sleepTime1)
plt.close()
# Dsiplaying the Accuracy Graph
plt.figure(2)
plt.plot(history.history['accuracy'])
plt.plot(history.history['val_accuracy'])
plt.legend(['training','validation'])
plt.title('Accuracy')
plt.xlabel('epoch')
plt.show(block=False)
plt.pause(sleepTime1)
plt.close()
# Making the model to predict
pred = model.predict(X_Test[:predParam])
print('Test Details::')
print('X_Test: ', X_Test.shape)
print('Y_Test_Catg: ', Y_Test_Catg.shape)
try:
score = model.evaluate(X_Test, Y_Test_Catg, verbose=0)
print('Test Score = ', score[0])
print('Test Accuracy = ', score[1])
except Exception as e:
x = str(e)
print('Error: ', x)
# Displaying some of the test images & their predicted labels
fig, ax = plt.subplots(3,3, figsize=(8,9))
axes = ax.flatten()
for i in range(9):
axes[i].imshow(np.reshape(X_Test[i], reshapeVal1), cmap="Greys")
pred = word_dict[np.argmax(Y_Test_Catg[i])]
print('Prediction: ', pred)
axes[i].set_title("Test Prediction: " + pred)
axes[i].grid()
plt.show(block=False)
plt.pause(sleepTime1)
plt.close()
fileName = Curr_Path + sep + 'Model' + sep + 'model_trained_' + str(epochsVal) + '.p'
print('Model Name: ', str(fileName))
pickle_out = open(fileName, 'wb')
pickle.dump(model, pickle_out)
pickle_out.close()
return 0
except Exception as e:
x = str(e)
print('Error: ', x)
return 1

Some of the key snippets from the above scripts are –

x = df_HW_Alphabet.drop('0',axis = 1)
y = df_HW_Alphabet['0']

In the above snippet, we have split the data into images & their corresponding labels.

X_Train, X_Test, Y_Train, Y_Test = train_test_split(x, y, test_size = testRatio)
X_Train, X_Validation, Y_Train, Y_Validation = train_test_split(X_Train, Y_Train, test_size = valRatio)

X_Train = np.reshape(X_Train.values, (X_Train.shape[0], reshapeVal, reshapeVal))
X_Test = np.reshape(X_Test.values, (X_Test.shape[0], reshapeVal, reshapeVal))
X_Validation = np.reshape(X_Validation.values, (X_Validation.shape[0], reshapeVal, reshapeVal))


print("Train Data Shape: ", X_Train.shape)
print("Test Data Shape: ", X_Test.shape)
print("Validation Data shape: ", X_Validation.shape)

We are splitting the data into Train, Test & Validation sets to get more accurate predictions and reshaping the raw data into the image by consuming the 784 data columns to 28×28 pixel images.

Since we are talking about characters, we had to come up with a process of identifying The following snippet will plot the character equivalent number into a matplotlib chart & showcase the overall distribution trend after splitting.

Y_Train_Num = np.int0(y)
count = np.zeros(numOfClasses, dtype='int')
for i in Y_Train_Num:
    count[i] +=1

alphabets = []
for i in word_dict.values():
    alphabets.append(i)

fig, ax = plt.subplots(1,1, figsize=(7,7))
ax.barh(alphabets, count)

plt.xlabel("Number of elements ")
plt.ylabel("Alphabets")
plt.grid()
plt.show(block=False)
plt.pause(sleepTime)
plt.close()

Note that we have tweaked the plt.show property with (block=False). This property will enable us to continue execution without human interventions after the initial pause.

# Model reshaping the training & test dataset
X_Train = X_Train.reshape(X_Train.shape[0],X_Train.shape[1],X_Train.shape[2],1)
print("Shape of Train Data: ", X_Train.shape)

X_Test = X_Test.reshape(X_Test.shape[0], X_Test.shape[1], X_Test.shape[2],1)
print("Shape of Test Data: ", X_Test.shape)

X_Validation = X_Validation.reshape(X_Validation.shape[0], X_Validation.shape[1], X_Validation.shape[2],1)
print("Shape of Validation data: ", X_Validation.shape)

# Converting the labels to categorical values
Y_Train_Catg = to_categorical(Y_Train, num_classes = numOfClasses, dtype='int')
print("Shape of Train Labels: ", Y_Train_Catg.shape)

Y_Test_Catg = to_categorical(Y_Test, num_classes = numOfClasses, dtype='int')
print("Shape of Test Labels: ", Y_Test_Catg.shape)

Y_Validation_Catg = to_categorical(Y_Validation, num_classes = numOfClasses, dtype='int')
print("Shape of validation labels: ", Y_Validation_Catg.shape)

In the above diagram, the application did reshape all three categories of data before calling the primary CNN function.

model = Sequential()

model.add(Conv2D(filters=filterVal1, kernel_size=kernelSize, activation=activationType, input_shape=(28,28,1)))
model.add(MaxPool2D(pool_size=poolSize, strides=stridesVal))

model.add(Conv2D(filters=filterVal2, kernel_size=kernelSize, activation=activationType, padding = paddingVal1))
model.add(MaxPool2D(pool_size=poolSize, strides=stridesVal))

model.add(Conv2D(filters=filterVal3, kernel_size=kernelSize, activation=activationType, padding = paddingVal2))
model.add(MaxPool2D(pool_size=poolSize, strides=stridesVal))

model.add(Flatten())

model.add(Dense(DenkseVal2,activation = activationType))
model.add(Dense(DenkseVal3,activation = activationType))

model.add(Dense(DenkseVal1,activation = activationType2))

model.compile(optimizer = Adam(learning_rate=learningRateVal), loss='categorical_crossentropy', metrics=['accuracy'])
reduce_lr = ReduceLROnPlateau(monitor=monitorVal, factor=factorVal, patience=patienceVal1, min_lr=minLrVal)
early_stop = EarlyStopping(monitor=monitorVal, min_delta=minDeltaVal, patience=patienceVal2, verbose=verboseFlag, mode=modeInd)


fittedModel = model.fit(X_Train, Y_Train_Catg, epochs=epochsVal, callbacks=[reduce_lr, early_stop],  validation_data = (X_Validation,Y_Validation_Catg))

return (model, fittedModel)

In the above snippet, the convolution layers are followed by maxpool layers, which reduce the number of features extracted. The output of the maxpool layers and convolution layers are flattened into a vector of a single dimension and supplied as an input to the Dense layer—the CNN model prepared for training the model using the training dataset.

We have used optimization parameters like Adam, RMSProp & the application we trained for eight epochs for better accuracy & predictions.

# Displaying the accuracies & losses for train & validation set
print("Validation Accuracy :", history.history['val_accuracy'])
print("Training Accuracy :", history.history['accuracy'])
print("Validation Loss :", history.history['val_loss'])
print("Training Loss :", history.history['loss'])

# Displaying the Loss Graph
plt.figure(1)
plt.plot(history.history['loss'])
plt.plot(history.history['val_loss'])
plt.legend(['training','validation'])
plt.title('Loss')
plt.xlabel('epoch')
plt.show(block=False)
plt.pause(sleepTime1)
plt.close()

# Dsiplaying the Accuracy Graph
plt.figure(2)
plt.plot(history.history['accuracy'])
plt.plot(history.history['val_accuracy'])
plt.legend(['training','validation'])
plt.title('Accuracy')
plt.xlabel('epoch')
plt.show(block=False)
plt.pause(sleepTime1)
plt.close()

Also, we have captured the validation Accuracy & Loss & plot them into two separate graphs for better understanding.

try:
    score = model.evaluate(X_Test, Y_Test_Catg, verbose=0)
    print('Test Score = ', score[0])
    print('Test Accuracy = ', score[1])
except Exception as e:
    x = str(e)
    print('Error: ', x)

Also, the application is trying to get the accuracy of the model that we trained & validated with the training & validation data. This time we have used test data to predict the confidence score.

# Displaying some of the test images & their predicted labels
fig, ax = plt.subplots(3,3, figsize=(8,9))
axes = ax.flatten()

for i in range(9):
    axes[i].imshow(np.reshape(X_Test[i], reshapeVal1), cmap="Greys")
    pred = word_dict[np.argmax(Y_Test_Catg[i])]
    print('Prediction: ', pred)
    axes[i].set_title("Test Prediction: " + pred)
    axes[i].grid()
plt.show(block=False)
plt.pause(sleepTime1)
plt.close()

Finally, the application testing with some random test data & tried to plot the output & prediction assessment.

Testing with Random Test Data
fileName = Curr_Path + sep + 'Model' + sep + 'model_trained_' + str(epochsVal) + '.p'
print('Model Name: ', str(fileName))

pickle_out = open(fileName, 'wb')
pickle.dump(model, pickle_out)
pickle_out.close()

As a part of the last step, the application will generate the models using a pickle package & save them under a specific location, which the reader application will use.

3. trainingVisualDataRead.py (Main application that will invoke the training class to predict alphabet through WebCam using Convolutional Neural Network (CNN).)


###############################################
#### Written By: SATYAKI DE ####
#### Written On: 17-Jan-2022 ####
#### Modified On 17-Jan-2022 ####
#### ####
#### Objective: This is the main calling ####
#### python script that will invoke the ####
#### clsAlhpabetReading class to initiate ####
#### teach & perfect the model to read ####
#### visual alphabets using Convolutional ####
#### Neural Network (CNN). ####
###############################################
# We keep the setup code in a different class as shown below.
import clsAlphabetReading as ar
from clsConfig import clsConfig as cf
import datetime
import logging
###############################################
### Global Section ###
###############################################
# Instantiating all the three classes
x1 = ar.clsAlphabetReading()
###############################################
### End of Global Section ###
###############################################
def main():
try:
# Other useful variables
debugInd = 'Y'
var = datetime.datetime.now().strftime("%Y-%m-%d_%H-%M-%S")
var1 = datetime.datetime.now()
print('Start Time: ', str(var))
# End of useful variables
# Initiating Log Class
general_log_path = str(cf.conf['LOG_PATH'])
# Enabling Logging Info
logging.basicConfig(filename=general_log_path + 'restoreVideo.log', level=logging.INFO)
print('Started Transformation!')
# Execute all the pass
r1 = x1.trainModel(debugInd, var)
if (r1 == 0):
print('Successfully Visual Alphabet Training Completed!')
else:
print('Failed to complete the Visual Alphabet Training!')
var2 = datetime.datetime.now()
c = var2 – var1
minutes = c.total_seconds() / 60
print('Total difference in minutes: ', str(minutes))
print('End Time: ', str(var1))
except Exception as e:
x = str(e)
print('Error: ', x)
if __name__ == "__main__":
main()

And the core snippet from the above script is –

x1 = ar.clsAlphabetReading()

Instantiate the main class.

r1 = x1.trainModel(debugInd, var)

The python application will invoke the class & capture the returned value inside the r1 variable.

4. readingVisualData.py (Reading the model to predict Alphabet using WebCAM.)


###############################################
#### Written By: SATYAKI DE ####
#### Written On: 18-Jan-2022 ####
#### Modified On 18-Jan-2022 ####
#### ####
#### Objective: This python script will ####
#### scan the live video feed from the ####
#### web-cam & predict the alphabet that ####
#### read it. ####
###############################################
# We keep the setup code in a different class as shown below.
from clsConfig import clsConfig as cf
import datetime
import logging
import cv2
import pickle
import numpy as np
###############################################
### Global Section ###
###############################################
sep = str(cf.conf['SEP'])
Curr_Path = str(cf.conf['INIT_PATH'])
fileName = str(cf.conf['FILE_NAME'])
epochsVal = int(cf.conf['epochsVal'])
numOfClasses = int(cf.conf['numOfClasses'])
word_dict = cf.conf['word_dict']
width = int(cf.conf['width'])
height = int(cf.conf['height'])
imgSize = cf.conf['imgSize']
threshold = float(cf.conf['threshold'])
imgDimension = cf.conf['imgDimension']
imgSmallDim = cf.conf['imgSmallDim']
imgMidDim = cf.conf['imgMidDim']
reshapeParam1 = int(cf.conf['reshapeParam1'])
reshapeParam2 = int(cf.conf['reshapeParam2'])
colorFeed = cf.conf['colorFeed']
colorPredict = cf.conf['colorPredict']
###############################################
### End of Global Section ###
###############################################
def main():
try:
# Other useful variables
debugInd = 'Y'
var = datetime.datetime.now().strftime("%Y-%m-%d_%H-%M-%S")
var1 = datetime.datetime.now()
print('Start Time: ', str(var))
# End of useful variables
# Initiating Log Class
general_log_path = str(cf.conf['LOG_PATH'])
# Enabling Logging Info
logging.basicConfig(filename=general_log_path + 'restoreVideo.log', level=logging.INFO)
print('Started Live Streaming!')
cap = cv2.VideoCapture(0)
cap.set(3, width)
cap.set(4, height)
fileName = Curr_Path + sep + 'Model' + sep + 'model_trained_' + str(epochsVal) + '.p'
print('Model Name: ', str(fileName))
pickle_in = open(fileName, 'rb')
model = pickle.load(pickle_in)
while True:
status, img = cap.read()
if status == False:
break
img_copy = img.copy()
img = cv2.cvtColor(img, cv2.COLOR_BGR2RGB)
img = cv2.resize(img, imgDimension)
img_copy = cv2.GaussianBlur(img_copy, imgSmallDim, 0)
img_gray = cv2.cvtColor(img_copy, cv2.COLOR_BGR2GRAY)
bin, img_thresh = cv2.threshold(img_gray, 100, 255, cv2.THRESH_BINARY_INV)
img_final = cv2.resize(img_thresh, imgMidDim)
img_final = np.reshape(img_final, (reshapeParam1,reshapeParam2,reshapeParam2,reshapeParam1))
img_pred = word_dict[np.argmax(model.predict(img_final))]
# Extracting Probability Values
Predict_X = model.predict(img_final)
probVal = round(np.amax(Predict_X) * 100)
cv2.putText(img, "Live Feed : (" + str(probVal) + "%) ", (20,25), cv2.FONT_HERSHEY_TRIPLEX, 0.7, color = colorFeed)
cv2.putText(img, "Prediction: " + img_pred, (20,410), cv2.FONT_HERSHEY_DUPLEX, 1.3, color = colorPredict)
cv2.imshow("Original Image", img)
if cv2.waitKey(1) & 0xFF == ord('q'):
r1=0
break
if (r1 == 0):
print('Successfully Alphabets predicted!')
else:
print('Failed to predict alphabet!')
var2 = datetime.datetime.now()
c = var2 – var1
minutes = c.total_seconds() / 60
print('Total Run Time in minutes: ', str(minutes))
print('End Time: ', str(var1))
except Exception as e:
x = str(e)
print('Error: ', x)
if __name__ == "__main__":
main()

And the key snippet from the above code is –

cap = cv2.VideoCapture(0)
cap.set(3, width)
cap.set(4, height)

The application is reading the live video data from WebCAM. Also, set out the height & width for the video output.

fileName = Curr_Path + sep + 'Model' + sep + 'model_trained_' + str(epochsVal) + '.p'
print('Model Name: ', str(fileName))

pickle_in = open(fileName, 'rb')
model = pickle.load(pickle_in)

The application reads the model output generated as part of the previous script using the pickle package.

while True:
    status, img = cap.read()

    if status == False:
        break

The application will read the WebCAM & it exits if there is an end of video transmission or some kind of corrupt video frame.

img_copy = img.copy()

img = cv2.cvtColor(img, cv2.COLOR_BGR2RGB)
img = cv2.resize(img, imgDimension)

img_copy = cv2.GaussianBlur(img_copy, imgSmallDim, 0)
img_gray = cv2.cvtColor(img_copy, cv2.COLOR_BGR2GRAY)
bin, img_thresh = cv2.threshold(img_gray, 100, 255, cv2.THRESH_BINARY_INV)

img_final = cv2.resize(img_thresh, imgMidDim)
img_final = np.reshape(img_final, (reshapeParam1,reshapeParam2,reshapeParam2,reshapeParam1))


img_pred = word_dict[np.argmax(model.predict(img_final))]

We have initially cloned the original video frame & then it converted from BGR2GRAYSCALE while applying the threshold on it doe better prediction outcomes. Then the image has resized & reshaped for model input. Finally, the np.argmax function extracted the class index with the highest predicted probability. Furthermore, it is translated using the word_dict dictionary to an Alphabet & displayed on top of the Live View.

# Extracting Probability Values
Predict_X = model.predict(img_final)
probVal = round(np.amax(Predict_X) * 100)

Also, derive the confidence score of that probability & display that on top of the Live View.

if cv2.waitKey(1) & 0xFF == ord('q'):
    r1=0
    break

The above code will let the developer exit from this application by pressing the “Esc” or “q”-key from the keyboard & the program will terminate.


So, we’ve done it.

You will get the complete codebase in the following Github link.

I’ll bring some more exciting topic in the coming days from the Python verse. Please share & subscribe my post & let me know your feedback.

Till then, Happy Avenging! 😀

Note: All the data & scenario posted here are representational data & scenarios & available over the internet & for educational purpose only. Some of the images (except my photo) that we’ve used are available over the net. We don’t claim the ownership of these images. There is an always room for improvement & especially the prediction quality of Alphabet.

Projecting real-time KPIs by ingesting streaming events from emulated IoT-device

Today, I am planning to demonstrate an IoT use case implemented in Python. I was waiting for my Raspberry Pi to arrive. However, the product that I received was not working as expected. Perhaps, some hardware malfunction. Hence, I was looking for a way to continue with my installment even without the hardware.

I was looking for an alternative way to use an online Raspberry Pi emulator. Recently, Microsoft has introduced integrated Raspberry Pi, which you can directly integrate with Azure IoT. However, I couldn’t find any API, which I could leverage on my Python application.

So, I explored all the possible options & finally come-up with the idea of creating my own IoT-Emulator, which can integrate with any application. With the help from the online materials, I have customized & enhanced them as per my use case & finally come up with this clean application that will demonstrate this use case with clarity.

We’ll showcase this real-time use case, where we would try to capture the events generated by IoT in a real-time dashboard, where the values in the visual display points will be affected as soon as the source data changes.


However, I would like to share the run before we dig deep into this.

Demo

Isn’t this exciting? How we can use our custom-built IoT emulator & captures real-time events to Ably Queue, then transform those raw events into more meaningful KPIs. Let’s deep dive then.


Architecture:

Let’s explore the architecture –

Fig – 1

As you can see, the green box is a demo IoT application that generates events & pushes them into the Ably Queue. At the same time, Dashboard consumes the events & transforms them into more meaningful metrics.


Package Installation:

Let us understand the sample packages that require for this task.

Step – 1:

Installation

Step – 2:

Installation – Continue

And, here is the command to install those packages –

pip install dash==1.0.0
pip install numpy==1.16.4
pip install pandas==0.24.2
pip install scipy==1.3.0
pip install gunicorn==19.9.0
pip install ably==1.1.1
pip install tkgpio==0.1

Code:

Since this is an extension to our previous post, we’re not going to discuss other scripts, which we’ve already discussed over there. Instead, we will talk about the enhanced scripts & the new scripts that require for this use case.

1. clsConfig.py (This native Python script contains the configuration entries.)


################################################
#### Written By: SATYAKI DE ####
#### Written On: 15-May-2020 ####
#### Modified On: 25-Sep-2021 ####
#### ####
#### Objective: This script is a config ####
#### file, contains all the keys for ####
#### Machine-Learning & streaming dashboard.####
#### ####
################################################
import os
import platform as pl
class clsConfig(object):
Curr_Path = os.path.dirname(os.path.realpath(__file__))
os_det = pl.system()
if os_det == "Windows":
sep = '\\'
else:
sep = '/'
conf = {
'APP_ID': 1,
'ARCH_DIR': Curr_Path + sep + 'arch' + sep,
'PROFILE_PATH': Curr_Path + sep + 'profile' + sep,
'LOG_PATH': Curr_Path + sep + 'log' + sep,
'REPORT_PATH': Curr_Path + sep + 'report',
'FILE_NAME': Curr_Path + sep + 'data' + sep + 'TradeIn.csv',
'SRC_PATH': Curr_Path + sep + 'data' + sep,
'JSONFileNameWithPath': Curr_Path + sep + 'GUI_Config' + sep + 'CircuitConfiguration.json',
'APP_DESC_1': 'Dash Integration with Ably!',
'DEBUG_IND': 'N',
'INIT_PATH': Curr_Path,
'SUBDIR' : 'data',
'ABLY_ID': 'WWP309489.93jfkT:32kkdhdJjdued79e',
"URL":"https://corona-api.com/countries/&quot;,
"appType":"application/json",
"conType":"keep-alive",
"limRec": 50,
"CACHE":"no-cache",
"MAX_RETRY": 3,
"coList": "DE, IN, US, CA, GB, ID, BR",
"FNC": "NewConfirmed",
"TMS": "ReportedDate",
"FND": "NewDeaths",
"FinData": "Cache.csv"
}

view raw

clsConfig.py

hosted with ❤ by GitHub

A few of the new entries, which are essential to this task are -> ABLY_ID, FinData & JSONFileNameWithPath.

2. clsPublishStream.py (This script will publish real-time streaming data coming out from a hosted API sources using another popular third-party service named Ably. Ably mimics pubsub Streaming concept, which might be extremely useful for any start-ups.)


###############################################################
#### ####
#### Written By: Satyaki De ####
#### Written Date: 26-Jul-2021 ####
#### Modified Date: 08-Sep-2021 ####
#### ####
#### Objective: This script will publish real-time ####
#### streaming data coming out from a hosted API ####
#### sources using another popular third-party service ####
#### named Ably. Ably mimics pubsub Streaming concept, ####
#### which might be extremely useful for any start-ups. ####
#### ####
###############################################################
from ably import AblyRest
import logging
import json
from random import seed
from random import random
import json
import math
import random
from clsConfig import clsConfig as cf
seed(1)
# Global Section
logger = logging.getLogger('ably')
logger.addHandler(logging.StreamHandler())
ably_id = str(cf.conf['ABLY_ID'])
ably = AblyRest(ably_id)
channel = ably.channels.get('sd_channel')
# End Of Global Section
class clsPublishStream:
def __init__(self):
self.msgSize = cf.conf['limRec']
def pushEvents(self, srcJSON, debugInd, varVa):
try:
msgSize = self.msgSize
# Capturing the inbound dataframe
jdata_fin = json.dumps(srcJSON)
print('IOT Events: ')
print(str(jdata_fin))
# Publish rest of the messages to the sd_channel channel
channel.publish('event', jdata_fin)
jdata_fin = ''
return 0
except Exception as e:
x = str(e)
print(x)
logging.info(x)
return 1

We’re not going to discuss this as we’ve already discussed in my previous post.

3. clsStreamConsume.py (Consuming Streaming data from Ably channels.)


##############################################
#### Written By: SATYAKI DE ####
#### Written On: 26-Jul-2021 ####
#### Modified On 08-Sep-2021 ####
#### ####
#### Objective: Consuming Streaming data ####
#### from Ably channels published by the ####
#### playIOTDevice.py ####
#### ####
##############################################
import json
from clsConfig import clsConfig as cf
import requests
import logging
import time
import pandas as p
import clsL as cl
from ably import AblyRest
# Initiating Log class
l = cl.clsL()
class clsStreamConsume:
def __init__(self):
self.ably_id = str(cf.conf['ABLY_ID'])
self.fileName = str(cf.conf['FinData'])
def conStream(self, varVa, debugInd):
try:
ably_id = self.ably_id
fileName = self.fileName
var = varVa
debug_ind = debugInd
# Fetching the data
client = AblyRest(ably_id)
channel = client.channels.get('sd_channel')
message_page = channel.history()
# Counter Value
cnt = 0
# Declaring Global Data-Frame
df_conv = p.DataFrame()
for i in message_page.items:
print('Last Msg: {}'.format(i.data))
json_data = json.loads(i.data)
#jdata = json.dumps(json_data)
# Converting String to Dictionary
dict_json = eval(json_data)
# Converting JSON to Dataframe
#df = p.json_normalize(json_data)
#df.columns = df.columns.map(lambda x: x.split(".")[-1])
df = p.DataFrame.from_dict(dict_json, orient='index')
#print('DF Inside:')
#print(df)
if cnt == 0:
df_conv = df
else:
d_frames = [df_conv, df]
df_conv = p.concat(d_frames)
cnt += 1
# Resetting the Index Value
df_conv.reset_index(drop=True, inplace=True)
# This will check whether the current load is happening
# or not. Based on that, it will capture the old events
# from cache.
if df_conv.empty:
df_conv = p.read_csv(fileName, index = True)
else:
l.logr(fileName, debug_ind, df_conv, 'log')
return df_conv
except Exception as e:
x = str(e)
print('Error: ', x)
logging.info(x)
# This will handle the error scenaio as well.
# Based on that, it will capture the old events
# from cache.
try:
df_conv = p.read_csv(fileName, index = True)
except:
df = p.DataFrame()
return df

We’re not going to discuss this as we’ve already discussed in my previous post.

4. CircuitConfiguration.json (Configuration file for GUI Interface for IoT Simulator.)


{
"name":"Analog Device",
"width":700,
"height":350,
"leds":[
{
"x":105,
"y":80,
"name":"LED",
"pin":21
}
],
"motors":[
{
"x":316,
"y":80,
"name":"DC Motor",
"forward_pin":22,
"backward_pin":23
}
],
"servos":[
{
"x":537,
"y":80,
"name":"Servo Motor",
"pin":24,
"min_angle":-180,
"max_angle":180,
"initial_angle":20
}
],
"adc":{
"mcp_chip":3008,
"potenciometers":[
{
"x":40,
"y":200,
"name":"Brightness Potentiometer",
"channel":0
},
{
"x":270,
"y":200,
"name":"Speed Potentiometer",
"channel":2
},
{
"x":500,
"y":200,
"name":"Angle Potentiometer",
"channel":6
}
]
},
"toggles":[
{
"x":270,
"y":270,
"name":"Direction Toggle Switch",
"pin":15,
"off_label":"backward",
"on_label":"forward",
"is_on":false
}
],
"labels":[
{
"x":15,
"y":35,
"width":25,
"height":18,
"borderwidth":2,
"relief":"solid"
},
{
"x":56,
"y":26,
"text":"Brightness Control"
},
{
"x":245,
"y":35,
"width":25,
"height":18,
"borderwidth":2,
"relief":"solid"
},
{
"x":298,
"y":26,
"text":"Speed Control"
},
{
"x":475,
"y":35,
"width":25,
"height":18,
"borderwidth":2,
"relief":"solid"
},
{
"x":531,
"y":26,
"text":"Angle Control"
}
]
}

This json configuration will be used by the next python class.

5. clsBuildCircuit.py (Calling Tk Circuit API.)


##############################################
#### Written By: SATYAKI DE ####
#### Written On: 25-Sep-2021 ####
#### Modified On 25-Sep-2021 ####
#### ####
#### Objective: Calling Tk Circuit API ####
##############################################
from tkgpio import TkCircuit
from json import load
from clsConfig import clsConfig as cf
fileName = str(cf.conf['JSONFileNameWithPath'])
print('File Name: ', str(fileName))
# initialize the circuit inside the GUI
with open(fileName, "r") as file:
config = load(file)
class clsBuildCircuit:
def __init__(self):
self.config = config
def genCir(self, main_function):
try:
config = self.config
circuit = TkCircuit(config)
circuit.run(main_function)
return circuit
except Exception as e:
x = str(e)
print(x)
return ''

Key snippets from the above script –

config = self.config
circuit = TkCircuit(config)
circuit.run(main_function)

The above lines will create an instance of simulated IoT circuits & then it will use the json file to start the GUI class.

6. playIOTDevice.py (Main Circuit GUI script to create an IoT Device to generate the events, which will consumed.)


###############################################
#### Written By: SATYAKI DE ####
#### Written On: 25-Sep-2021 ####
#### Modified On 25-Sep-2021 ####
#### ####
#### Objective: Main Tk Circuit GUI script ####
#### to create an IOT Device to generate ####
#### the events, which will consumed. ####
###############################################
# We keep the setup code in a different class as shown below.
import clsBuildCircuit as csb
import json
import clsPublishStream as cps
import datetime
from clsConfig import clsConfig as cf
import logging
###############################################
### Global Section ###
###############################################
# Initiating Ably class to push events
x1 = cps.clsPublishStream()
# Create the instance of the Tk Circuit API Class.
circuit = csb.clsBuildCircuit()
###############################################
### End of Global Section ###
###############################################
# Invoking the IOT Device Generator.
@circuit.genCir
def main():
from gpiozero import PWMLED, Motor, Servo, MCP3008, Button
from time import sleep
# Circuit Components
ledAlert = PWMLED(21)
dcMotor = Motor(22, 23)
servoMotor = Servo(24)
ioMeter1 = MCP3008(0)
ioMeter2 = MCP3008(2)
ioMeter3 = MCP3008(6)
switch = Button(15)
# End of circuit components
# Other useful variables
cnt = 1
idx = 0
debugInd = 'Y'
var = datetime.datetime.now().strftime("%Y-%m-%d_%H-%M-%S")
# End of useful variables
# Initiating Log Class
general_log_path = str(cf.conf['LOG_PATH'])
msgSize = int(cf.conf['limRec'])
# Enabling Logging Info
logging.basicConfig(filename=general_log_path + 'IOTDevice.log', level=logging.INFO)
while True:
ledAlert.value = ioMeter1.value
if switch.is_pressed:
dcMotor.forward(ioMeter2.value)
xVal = 'Motor Forward'
else:
dcMotor.backward(ioMeter2.value)
xVal = 'Motor Backward'
servoMotor.value = 1 – 2 * ioMeter3.value
srcJson = {
"LedMeter": ledAlert.value,
"DCMeter": ioMeter2.value,
"ServoMeter": ioMeter3.value,
"SwitchStatus": switch.is_pressed,
"DCMotorPos": xVal,
"ServoMotor": servoMotor.value
}
tmpJson = str(srcJson)
if cnt == 1:
srcJsonMast = '{' + '"' + str(idx) + '":'+ tmpJson
elif cnt == msgSize:
srcJsonMast = srcJsonMast + '}'
print('JSON: ')
print(str(srcJsonMast))
# Pushing both the Historical Confirmed Cases
retVal_1 = x1.pushEvents(srcJsonMast, debugInd, var)
if retVal_1 == 0:
print('Successfully IOT event pushed!')
else:
print('Failed to push IOT events!')
srcJsonMast = ''
tmpJson = ''
cnt = 0
idx = -1
srcJson = {}
retVal_1 = 0
else:
srcJsonMast = srcJsonMast + ',' + '"' + str(idx) + '":'+ tmpJson
cnt += 1
idx += 1
sleep(0.05)

Lets’ explore the key snippets –

ledAlert = PWMLED(21)
dcMotor = Motor(22, 23)
servoMotor = Servo(24)

It defines three motors that include Servo, DC & LED.

Now, we can see the following sets of the critical snippet –

ledAlert.value = ioMeter1.value

if switch.is_pressed:
    dcMotor.forward(ioMeter2.value)
    xVal = 'Motor Forward'
else:
    dcMotor.backward(ioMeter2.value)
    xVal = 'Motor Backward'

servoMotor.value = 1 - 2 * ioMeter3.value

srcJson = {
"LedMeter": ledAlert.value,
"DCMeter": ioMeter2.value,
"ServoMeter": ioMeter3.value,
"SwitchStatus": switch.is_pressed,
"DCMotorPos": xVal,
"ServoMotor": servoMotor.value
}

Following lines will dynamically generates JSON that will be passed into the Ably queue –

tmpJson = str(srcJson)

if cnt == 1:
    srcJsonMast = '{' + '"' + str(idx) + '":'+ tmpJson
elif cnt == msgSize:
    srcJsonMast = srcJsonMast + '}'
    print('JSON: ')
    print(str(srcJsonMast))

Final line from the above script –

# Pushing both the Historical Confirmed Cases
retVal_1 = x1.pushEvents(srcJsonMast, debugInd, var)

This code will now push the events into the Ably Queue.

7. app.py (Consuming Streaming data from Ably channels & captured IOT events from the simulator & publish them in Dashboard through measured KPIs.)


##############################################
#### Updated By: SATYAKI DE ####
#### Updated On: 02-Oct-2021 ####
#### ####
#### Objective: Consuming Streaming data ####
#### from Ably channels & captured IOT ####
#### events from the simulator & publish ####
#### them in Dashboard through measured ####
#### KPIs. ####
#### ####
##############################################
import os
import pathlib
import numpy as np
import datetime as dt
import dash
from dash import dcc
from dash import html
import datetime
import dash_daq as daq
from dash.exceptions import PreventUpdate
from dash.dependencies import Input, Output, State
from scipy.stats import rayleigh
# Consuming data from Ably Queue
from ably import AblyRest
# Main Class to consume streaming
import clsStreamConsume as ca
# Create the instance of the Covid API Class
x1 = ca.clsStreamConsume()
var1 = datetime.datetime.now().strftime("%Y-%m-%d_%H-%M-%S")
print('*' *60)
DInd = 'Y'
GRAPH_INTERVAL = os.environ.get("GRAPH_INTERVAL", 5000)
app = dash.Dash(
__name__,
meta_tags=[{"name": "viewport", "content": "width=device-width, initial-scale=1"}],
)
app.title = "IOT Device Dashboard"
server = app.server
app_color = {"graph_bg": "#082255", "graph_line": "#007ACE"}
app.layout = html.Div(
[
# header
html.Div(
[
html.Div(
[
html.H4("IOT DEVICE STREAMING", className="app__header__title"),
html.P(
"This app continually consumes streaming data from IOT-Device and displays live charts of various metrics & KPI associated with it.",
className="app__header__title–grey",
),
],
className="app__header__desc",
),
html.Div(
[
html.A(
html.Button("SOURCE CODE", className="link-button"),
href="https://github.com/SatyakiDe2019/IOTStream&quot;,
),
html.A(
html.Button("VIEW DEMO", className="link-button"),
href="https://github.com/SatyakiDe2019/IOTStream/blob/main/demo.gif&quot;,
),
html.A(
html.Img(
src=app.get_asset_url("dash-new-logo.png"),
className="app__menu__img",
),
href="https://plotly.com/dash/&quot;,
),
],
className="app__header__logo",
),
],
className="app__header",
),
html.Div(
[
# Motor Speed
html.Div(
[
html.Div(
[html.H6("SERVO METER (IOT)", className="graph__title")]
),
dcc.Graph(
id="iot-measure",
figure=dict(
layout=dict(
plot_bgcolor=app_color["graph_bg"],
paper_bgcolor=app_color["graph_bg"],
)
),
),
dcc.Interval(
id="iot-measure-update",
interval=int(GRAPH_INTERVAL),
n_intervals=0,
),
# Second Panel
html.Div(
[html.H6("DC-MOTOR (IOT)", className="graph__title")]
),
dcc.Graph(
id="iot-measure-1",
figure=dict(
layout=dict(
plot_bgcolor=app_color["graph_bg"],
paper_bgcolor=app_color["graph_bg"],
)
),
),
dcc.Interval(
id="iot-measure-update-1",
interval=int(GRAPH_INTERVAL),
n_intervals=0,
)
],
className="two-thirds column motor__speed__container",
),
html.Div(
[
# histogram
html.Div(
[
html.Div(
[
html.H6(
"MOTOR POWER HISTOGRAM",
className="graph__title",
)
]
),
html.Div(
[
dcc.Slider(
id="bin-slider",
min=1,
max=60,
step=1,
value=20,
updatemode="drag",
marks={
20: {"label": "20"},
40: {"label": "40"},
60: {"label": "60"},
},
)
],
className="slider",
),
html.Div(
[
dcc.Checklist(
id="bin-auto",
options=[
{"label": "Auto", "value": "Auto"}
],
value=["Auto"],
inputClassName="auto__checkbox",
labelClassName="auto__label",
),
html.P(
"# of Bins: Auto",
id="bin-size",
className="auto__p",
),
],
className="auto__container",
),
dcc.Graph(
id="motor-histogram",
figure=dict(
layout=dict(
plot_bgcolor=app_color["graph_bg"],
paper_bgcolor=app_color["graph_bg"],
)
),
),
],
className="graph__container first",
),
# motor direction
html.Div(
[
html.Div(
[
html.H6(
"SERVO MOTOR DIRECTION", className="graph__title"
)
]
),
dcc.Graph(
id="servo-motor-direction",
figure=dict(
layout=dict(
plot_bgcolor=app_color["graph_bg"],
paper_bgcolor=app_color["graph_bg"],
)
),
),
],
className="graph__container second",
),
],
className="one-third column histogram__direction",
),
],
className="app__content",
),
],
className="app__container",
)
def toPositive(row, flag):
try:
if flag == 'ServoMeter':
x_val = abs(float(row['ServoMotor']))
elif flag == 'DCMotor':
x_val = abs(float(row['DCMotor'])) * 0.001
return x_val
except Exception as e:
x = str(e)
print(x)
val = 0
return val
def toPositiveInflated(row, flag):
try:
if flag == 'ServoMeter':
x_val = abs(float(row['ServoMeter'])) * 100
elif flag == 'DCMotor':
x_val = abs(float(row['DCMeter'])) * 100
return x_val
except Exception as e:
x = str(e)
print(x)
val = 0
return val
def getData(var, Ind):
try:
# Let's pass this to our map section
df = x1.conStream(var, Ind)
df['ServoMeterNew'] = df.apply(lambda row: toPositiveInflated(row, 'ServoMeter'), axis=1)
df['ServoMotorNew'] = df.apply(lambda row: toPositive(row, 'ServoMeter'), axis=1)
df['DCMotor'] = df.apply(lambda row: toPositiveInflated(row, 'DCMotor'), axis=1)
df['DCMeterNew'] = df.apply(lambda row: toPositive(row, 'DCMotor'), axis=1)
# Dropping old columns
df.drop(columns=['ServoMeter','ServoMotor','DCMeter'], axis=1, inplace=True)
#Rename New Columns to Old Columns
df.rename(columns={'ServoMeterNew':'ServoMeter'}, inplace=True)
df.rename(columns={'ServoMotorNew':'ServoMotor'}, inplace=True)
df.rename(columns={'DCMeterNew':'DCMeter'}, inplace=True)
return df
except Exception as e:
x = str(e)
print(x)
df = p.DataFrame()
return df
@app.callback(
Output("iot-measure-1", "figure"), [Input("iot-measure-update", "n_intervals")]
)
def gen_iot_speed(interval):
"""
Generate the DC Meter graph.
:params interval: update the graph based on an interval
"""
# Let's pass this to our map section
df = getData(var1, DInd)
trace = dict(
type="scatter",
y=df["DCMotor"],
line={"color": "#42C4F7"},
hoverinfo="skip",
error_y={
"type": "data",
"array": df["DCMeter"],
"thickness": 1.5,
"width": 2,
"color": "#B4E8FC",
},
mode="lines",
)
layout = dict(
plot_bgcolor=app_color["graph_bg"],
paper_bgcolor=app_color["graph_bg"],
font={"color": "#fff"},
height=400,
xaxis={
"range": [0, 200],
"showline": True,
"zeroline": False,
"fixedrange": True,
"tickvals": [0, 50, 100, 150, 200],
"ticktext": ["200", "150", "100", "50", "0"],
"title": "Time Elapsed (sec)",
},
yaxis={
"range": [
min(0, min(df["DCMotor"])),
max(100, max(df["DCMotor"]) + max(df["DCMeter"])),
],
"showgrid": True,
"showline": True,
"fixedrange": True,
"zeroline": False,
"gridcolor": app_color["graph_line"],
"nticks": max(6, round(df["DCMotor"].iloc[-1] / 10)),
},
)
return dict(data=[trace], layout=layout)
@app.callback(
Output("iot-measure", "figure"), [Input("iot-measure-update", "n_intervals")]
)
def gen_iot_speed(interval):
"""
Generate the Motor Speed graph.
:params interval: update the graph based on an interval
"""
# Let's pass this to our map section
df = getData(var1, DInd)
trace = dict(
type="scatter",
y=df["ServoMeter"],
line={"color": "#42C4F7"},
hoverinfo="skip",
error_y={
"type": "data",
"array": df["ServoMotor"],
"thickness": 1.5,
"width": 2,
"color": "#B4E8FC",
},
mode="lines",
)
layout = dict(
plot_bgcolor=app_color["graph_bg"],
paper_bgcolor=app_color["graph_bg"],
font={"color": "#fff"},
height=400,
xaxis={
"range": [0, 200],
"showline": True,
"zeroline": False,
"fixedrange": True,
"tickvals": [0, 50, 100, 150, 200],
"ticktext": ["200", "150", "100", "50", "0"],
"title": "Time Elapsed (sec)",
},
yaxis={
"range": [
min(0, min(df["ServoMeter"])),
max(100, max(df["ServoMeter"]) + max(df["ServoMotor"])),
],
"showgrid": True,
"showline": True,
"fixedrange": True,
"zeroline": False,
"gridcolor": app_color["graph_line"],
"nticks": max(6, round(df["ServoMeter"].iloc[-1] / 10)),
},
)
return dict(data=[trace], layout=layout)
@app.callback(
Output("servo-motor-direction", "figure"), [Input("iot-measure-update", "n_intervals")]
)
def gen_motor_direction(interval):
"""
Generate the Servo direction graph.
:params interval: update the graph based on an interval
"""
df = getData(var1, DInd)
val = df["ServoMeter"].iloc[-1]
direction = [0, (df["ServoMeter"][0]*100 – 20), (df["ServoMeter"][0]*100 + 20), 0]
traces_scatterpolar = [
{"r": [0, val, val, 0], "fillcolor": "#084E8A"},
{"r": [0, val * 0.65, val * 0.65, 0], "fillcolor": "#B4E1FA"},
{"r": [0, val * 0.3, val * 0.3, 0], "fillcolor": "#EBF5FA"},
]
data = [
dict(
type="scatterpolar",
r=traces["r"],
theta=direction,
mode="lines",
fill="toself",
fillcolor=traces["fillcolor"],
line={"color": "rgba(32, 32, 32, .6)", "width": 1},
)
for traces in traces_scatterpolar
]
layout = dict(
height=350,
plot_bgcolor=app_color["graph_bg"],
paper_bgcolor=app_color["graph_bg"],
font={"color": "#fff"},
autosize=False,
polar={
"bgcolor": app_color["graph_line"],
"radialaxis": {"range": [0, 45], "angle": 45, "dtick": 10},
"angularaxis": {"showline": False, "tickcolor": "white"},
},
showlegend=False,
)
return dict(data=data, layout=layout)
@app.callback(
Output("motor-histogram", "figure"),
[Input("iot-measure-update", "n_intervals")],
[
State("iot-measure", "figure"),
State("bin-slider", "value"),
State("bin-auto", "value"),
],
)
def gen_motor_histogram(interval, iot_speed_figure, slider_value, auto_state):
"""
Genererate iot histogram graph.
:params interval: upadte the graph based on an interval
:params iot_speed_figure: current Motor Speed graph
:params slider_value: current slider value
:params auto_state: current auto state
"""
motor_val = []
try:
print('Inside gen_motor_histogram:')
print('iot_speed_figure::')
print(iot_speed_figure)
# Check to see whether iot-measure has been plotted yet
if iot_speed_figure is not None:
motor_val = iot_speed_figure["data"][0]["y"]
if "Auto" in auto_state:
bin_val = np.histogram(
motor_val,
bins=range(int(round(min(motor_val))), int(round(max(motor_val)))),
)
else:
bin_val = np.histogram(motor_val, bins=slider_value)
except Exception as error:
raise PreventUpdate
avg_val = float(sum(motor_val)) / len(motor_val)
median_val = np.median(motor_val)
pdf_fitted = rayleigh.pdf(
bin_val[1], loc=(avg_val) * 0.55, scale=(bin_val[1][-1] – bin_val[1][0]) / 3
)
y_val = (pdf_fitted * max(bin_val[0]) * 20,)
y_val_max = max(y_val[0])
bin_val_max = max(bin_val[0])
trace = dict(
type="bar",
x=bin_val[1],
y=bin_val[0],
marker={"color": app_color["graph_line"]},
showlegend=False,
hoverinfo="x+y",
)
traces_scatter = [
{"line_dash": "dash", "line_color": "#2E5266", "name": "Average"},
{"line_dash": "dot", "line_color": "#BD9391", "name": "Median"},
]
scatter_data = [
dict(
type="scatter",
x=[bin_val[int(len(bin_val) / 2)]],
y=[0],
mode="lines",
line={"dash": traces["line_dash"], "color": traces["line_color"]},
marker={"opacity": 0},
visible=True,
name=traces["name"],
)
for traces in traces_scatter
]
trace3 = dict(
type="scatter",
mode="lines",
line={"color": "#42C4F7"},
y=y_val[0],
x=bin_val[1][: len(bin_val[1])],
name="Rayleigh Fit",
)
layout = dict(
height=350,
plot_bgcolor=app_color["graph_bg"],
paper_bgcolor=app_color["graph_bg"],
font={"color": "#fff"},
xaxis={
"title": "Motor Power",
"showgrid": False,
"showline": False,
"fixedrange": True,
},
yaxis={
"showgrid": False,
"showline": False,
"zeroline": False,
"title": "Number of Samples",
"fixedrange": True,
},
autosize=True,
bargap=0.01,
bargroupgap=0,
hovermode="closest",
legend={
"orientation": "h",
"yanchor": "bottom",
"xanchor": "center",
"y": 1,
"x": 0.5,
},
shapes=[
{
"xref": "x",
"yref": "y",
"y1": int(max(bin_val_max, y_val_max)) + 0.5,
"y0": 0,
"x0": avg_val,
"x1": avg_val,
"type": "line",
"line": {"dash": "dash", "color": "#2E5266", "width": 5},
},
{
"xref": "x",
"yref": "y",
"y1": int(max(bin_val_max, y_val_max)) + 0.5,
"y0": 0,
"x0": median_val,
"x1": median_val,
"type": "line",
"line": {"dash": "dot", "color": "#BD9391", "width": 5},
},
],
)
return dict(data=[trace, scatter_data[0], scatter_data[1], trace3], layout=layout)
@app.callback(
Output("bin-auto", "value"),
[Input("bin-slider", "value")],
[State("iot-measure", "figure")],
)
def deselect_auto(slider_value, iot_speed_figure):
""" Toggle the auto checkbox. """
# prevent update if graph has no data
if "data" not in iot_speed_figure:
raise PreventUpdate
if not len(iot_speed_figure["data"]):
raise PreventUpdate
if iot_speed_figure is not None and len(iot_speed_figure["data"][0]["y"]) > 5:
return [""]
return ["Auto"]
@app.callback(
Output("bin-size", "children"),
[Input("bin-auto", "value")],
[State("bin-slider", "value")],
)
def show_num_bins(autoValue, slider_value):
""" Display the number of bins. """
if "Auto" in autoValue:
return "# of Bins: Auto"
return "# of Bins: " + str(int(slider_value))
if __name__ == "__main__":
app.run_server(debug=True)

view raw

app.py

hosted with ❤ by GitHub

Here are the key snippets –

html.Div(
        [
            html.Div(
                [html.H6("SERVO METER (IOT)", className="graph__title")]
            ),
            dcc.Graph(
                id="iot-measure",
                figure=dict(
                    layout=dict(
                        plot_bgcolor=app_color["graph_bg"],
                        paper_bgcolor=app_color["graph_bg"],
                    )
                ),
            ),
            dcc.Interval(
                id="iot-measure-update",
                interval=int(GRAPH_INTERVAL),
                n_intervals=0,
            ),
            # Second Panel
            html.Div(
                [html.H6("DC-MOTOR (IOT)", className="graph__title")]
            ),
            dcc.Graph(
                id="iot-measure-1",
                figure=dict(
                    layout=dict(
                        plot_bgcolor=app_color["graph_bg"],
                        paper_bgcolor=app_color["graph_bg"],
                    )
                ),
            ),
            dcc.Interval(
                id="iot-measure-update-1",
                interval=int(GRAPH_INTERVAL),
                n_intervals=0,
            )
        ],
        className="two-thirds column motor__speed__container",

The following line creates two panels, where the application will consume the streaming data by the app’s call-back feature & refresh the data & graphs as & when the application receives the streaming data.

A similar approach was adopted for other vital aspects/components inside the dashboard.

def getData(var, Ind):
    try:
        # Let's pass this to our map section
        df = x1.conStream(var, Ind)

        df['ServoMeterNew'] = df.apply(lambda row: toPositiveInflated(row, 'ServoMeter'), axis=1)
        df['ServoMotorNew'] = df.apply(lambda row: toPositive(row, 'ServoMeter'), axis=1)
        df['DCMotor'] = df.apply(lambda row: toPositiveInflated(row, 'DCMotor'), axis=1)
        df['DCMeterNew'] = df.apply(lambda row: toPositive(row, 'DCMotor'), axis=1)

        # Dropping old columns
        df.drop(columns=['ServoMeter','ServoMotor','DCMeter'], axis=1, inplace=True)

        #Rename New Columns to Old Columns
        df.rename(columns={'ServoMeterNew':'ServoMeter'}, inplace=True)
        df.rename(columns={'ServoMotorNew':'ServoMotor'}, inplace=True)
        df.rename(columns={'DCMeterNew':'DCMeter'}, inplace=True)

        return df
    except Exception as e:
        x = str(e)
        print(x)

        df = p.DataFrame()

        return df

The application is extracting streaming data & consuming it from the Ably queue.

@app.callback(
    Output("iot-measure", "figure"), [Input("iot-measure-update", "n_intervals")]
)
def gen_iot_speed(interval):
    """
    Generate the Motor Speed graph.

    :params interval: update the graph based on an interval
    """

    # Let's pass this to our map section
    df = getData(var1, DInd)

    trace = dict(
        type="scatter",
        y=df["ServoMeter"],
        line={"color": "#42C4F7"},
        hoverinfo="skip",
        error_y={
            "type": "data",
            "array": df["ServoMotor"],
            "thickness": 1.5,
            "width": 2,
            "color": "#B4E8FC",
        },
        mode="lines",
    )

    layout = dict(
        plot_bgcolor=app_color["graph_bg"],
        paper_bgcolor=app_color["graph_bg"],
        font={"color": "#fff"},
        height=400,
        xaxis={
            "range": [0, 200],
            "showline": True,
            "zeroline": False,
            "fixedrange": True,
            "tickvals": [0, 50, 100, 150, 200],
            "ticktext": ["200", "150", "100", "50", "0"],
            "title": "Time Elapsed (sec)",
        },
        yaxis={
            "range": [
                min(0, min(df["ServoMeter"])),
                max(100, max(df["ServoMeter"]) + max(df["ServoMotor"])),
            ],
            "showgrid": True,
            "showline": True,
            "fixedrange": True,
            "zeroline": False,
            "gridcolor": app_color["graph_line"],
            "nticks": max(6, round(df["ServoMeter"].iloc[-1] / 10)),
        },
    )

    return dict(data=[trace], layout=layout)

Capturing all the relevant columns & transform them into a graph, where the application will consume data into both the axis (x-axis & y-axis).

There are many other useful snippets, which creates separate useful widgets inside the dashboard.


Run:

Let us run the application –

Dashboard-View

So, we’ve done it.

You will get the complete codebase in the following Github link.

There is an excellent resource from the dash framework, which you should explore. The following link would be handy for developers who want to get some meaningful pre-built dashboard template, which you can customize as per your need through Python or R. Please find the link here.


I’ll bring some more exciting topic in the coming days from the Python verse.

Till then, Happy Avenging! 😀


Note: All the data & scenario posted here are representational data & scenarios & available over the internet & for educational purpose only.

One more thing you need to understand is that this prediction based on limited data points. The actual event may happen differently. Ideally, countries are taking a cue from this kind of analysis & are initiating appropriate measures to avoid the high-curve. And, that is one of the main objective of time series analysis.

There is always a room for improvement of this kind of models & the solution associated with it. I’ve shown the basic ways to achieve the same for the education purpose only.

Predicting real-time Covid-19 forecast by analyzing time-series data using Facebook machine-learning API

Hello Guys,

Today, I’ll share one of the important posts on predicting data using facebook’s relatively new machine-learning-based API. I find this API is interesting as to how it can build & anticipate the outcome.

We’ll be using one of the most acceptable API-based sources for Covid-19 & I’ll be sharing the link over here.

We’ll be using the prophet-API developed by Facebook to predict the data. You will get the details from this link.

Architecture

Now, let’s explore the architecture shared above.

As you can see that the application will consume the data from the third-party API named “about-corona,” & the python application will clean & transform the data. The application will send the clean data to the Facebook API (prophet) built on the machine-learning algorithm. This API is another effective time-series analysis platform given to the data scientist community.

Once the application receives the predicted model, it will visualize them using plotly & matplotlib.


I would request you to please check the demo of this application just for your reference.

Demo Run

We’ll do a time series analysis. Let us understand the basic concept of time series.

Time series is a series of data points indexed (or listed or graphed) in time order.

Therefore, the data organized by relatively deterministic timestamps and potentially compared with random sample data contain additional information that we can leverage for our business use case to make a better decision.

To use the prophet API, one needs to use & transform their data cleaner & should contain two fields (ds & y).

Let’s check one such use case since our source has plenty of good data points to decide. We’ve daily data of newly infected covid patients based on countries, as shown below –

Covid Cases

And, our clean class will transform the data into two fields –

Transformed Data

Once we fit the data into the prophet model, it will generate some additional columns, which will be used for prediction as shown below –

Generated data from prophet-api

And, a sample prediction based on a similar kind of data would be identical to this –

Sample Prediction

Let us understand what packages we need to install to prepare this application –

Installing Dependency Packages – I
Installing Dependency Packages – II

And, here is the packages –

pip install pandas
pip install matplotlib
pip install prophet

Let us now revisit the code –

1. clsConfig.py ( This native Python script contains the configuration entries. )


#####################################################
#### Written By: SATYAKI DE ####
#### Written On: 26-Jul-2021 ####
#### ####
#### Objective: This script is a config ####
#### file, contains all the keys for ####
#### for Prophet API. Application will ####
#### process these information & perform ####
#### the call to our newly developed with ####
#### APIs developed by Facebook & a open-source ####
#### project called "About-Corona". ####
#####################################################
import os
import platform as pl
class clsConfig(object):
Curr_Path = os.path.dirname(os.path.realpath(__file__))
os_det = pl.system()
if os_det == "Windows":
sep = '\\'
else:
sep = '/'
conf = {
'APP_ID': 1,
"URL":"https://corona-api.com/countries/&quot;,
"appType":"application/json",
"conType":"keep-alive",
"limRec": 10,
"CACHE":"no-cache",
"coList": "DE, IN, US, CA, GB, ID, BR",
"LOG_PATH":Curr_Path + sep + 'log' + sep,
"MAX_RETRY": 3,
"FNC": "NewConfirmed",
"TMS": "ReportedDate",
"FND": "NewDeaths"
}

view raw

clsConfig.py

hosted with ❤ by GitHub

We’re not going to discuss anything specific to this script.

2. clsL.py ( This native Python script logs the application. )


#####################################################
#### Written By: SATYAKI DE ####
#### Written On: 26-Jul-2021 ####
#### ####
#### Objective: This script is a log ####
#### file, that is useful for debugging purpose. ####
#### ####
#####################################################
import pandas as p
import os
import platform as pl
class clsL(object):
def __init__(self):
self.path = os.path.dirname(os.path.realpath(__file__))
def logr(self, Filename, Ind, df, subdir=None, write_mode='w', with_index='N'):
try:
x = p.DataFrame()
x = df
sd = subdir
os_det = pl.system()
if sd == None:
if os_det == "windows":
fullFileName = self.path + '\\' + Filename
else:
fullFileName = self.path + '/' + Filename
else:
if os_det == "windows":
fullFileName = self.path + '\\' + sd + '\\' + Filename
else:
fullFileName = self.path + '/' + sd + '/' + Filename
if (with_index == 'N'):
if ((Ind == 'Y') & (write_mode == 'w')):
x.to_csv(fullFileName, index=False)
else:
x.to_csv(fullFileName, index=False, mode=write_mode, header=None)
else:
if ((Ind == 'Y') & (write_mode == 'w')):
x.to_csv(fullFileName)
else:
x.to_csv(fullFileName, mode=write_mode, header=None)
return 0
except Exception as e:
y = str(e)
print(y)
return 3

view raw

clsL.py

hosted with ❤ by GitHub

Based on the operating system, the log class will capture potential information under the “log” directory in the form of csv for later reference purposes.

3. clsForecast.py ( This native Python script will clean & transform the data. )


##############################################
#### Written By: SATYAKI DE ####
#### Written On: 26-Jul-2021 ####
#### Modified On 26-Jul-2021 ####
#### ####
#### Objective: Calling Data Cleaning API ####
##############################################
import json
from clsConfig import clsConfig as cf
import requests
import logging
import time
import pandas as p
import clsL as cl
from prophet import Prophet
class clsForecast:
def __init__(self):
self.fnc = cf.conf['FNC']
self.fnd = cf.conf['FND']
self.tms = cf.conf['TMS']
def forecastNewConfirmed(self, srcDF, debugInd, varVa):
try:
fnc = self.fnc
tms = self.tms
var = varVa
debug_ind = debugInd
countryISO = ''
df_M = p.DataFrame()
dfWork = srcDF
# Initiating Log class
l = cl.clsL()
#Extracting the unique country name
unqCountry = dfWork['CountryCode'].unique()
for i in unqCountry:
countryISO = i.strip()
print('Country Name: ' + countryISO)
df_Comm = dfWork[[tms, fnc]]
l.logr('13.df_Comm_' + var + '.csv', debug_ind, df_Comm, 'log')
# Aligning as per Prophet naming convention
df_Comm.columns = ['ds', 'y']
l.logr('14.df_Comm_Mod_' + var + '.csv', debug_ind, df_Comm, 'log')
return df_Comm
except Exception as e:
x = str(e)
print(x)
logging.info(x)
df = p.DataFrame()
return df
def forecastNewDead(self, srcDF, debugInd, varVa):
try:
fnd = self.fnd
tms = self.tms
var = varVa
debug_ind = debugInd
countryISO = ''
df_M = p.DataFrame()
dfWork = srcDF
# Initiating Log class
l = cl.clsL()
#Extracting the unique country name
unqCountry = dfWork['CountryCode'].unique()
for i in unqCountry:
countryISO = i.strip()
print('Country Name: ' + countryISO)
df_Comm = dfWork[[tms, fnd]]
l.logr('17.df_Comm_' + var + '.csv', debug_ind, df_Comm, 'log')
# Aligning as per Prophet naming convention
df_Comm.columns = ['ds', 'y']
l.logr('18.df_Comm_Mod_' + var + '.csv', debug_ind, df_Comm, 'log')
return df_Comm
except Exception as e:
x = str(e)
print(x)
logging.info(x)
df = p.DataFrame()
return df

view raw

clsForecast.py

hosted with ❤ by GitHub

Let’s explore the critical snippet out of this script –

df_Comm = dfWork[[tms, fnc]]

Now, the application will extract only the relevant columns to proceed.

df_Comm.columns = ['ds', 'y']

It is now assigning specific column names, which is a requirement for prophet API.

4. clsCovidAPI.py ( This native Python script will call the Covid-19 API. )


##############################################
#### Written By: SATYAKI DE ####
#### Written On: 26-Jul-2021 ####
#### Modified On 26-Jul-2021 ####
#### ####
#### Objective: Calling Covid-19 API ####
##############################################
import json
from clsConfig import clsConfig as cf
import requests
import logging
import time
import pandas as p
import clsL as cl
class clsCovidAPI:
def __init__(self):
self.url = cf.conf['URL']
self.azure_cache = cf.conf['CACHE']
self.azure_con = cf.conf['conType']
self.type = cf.conf['appType']
self.typVal = cf.conf['coList']
self.max_retries = cf.conf['MAX_RETRY']
def searchQry(self, varVa, debugInd):
try:
url = self.url
api_cache = self.azure_cache
api_con = self.azure_con
type = self.type
typVal = self.typVal
max_retries = self.max_retries
var = varVa
debug_ind = debugInd
cnt = 0
df_M = p.DataFrame()
# Initiating Log class
l = cl.clsL()
payload = {}
strMsg = 'Input Countries: ' + str(typVal)
logging.info(strMsg)
headers = {}
countryList = typVal.split(',')
for i in countryList:
# Failed case retry
retries = 1
success = False
val = ''
try:
while not success:
# Getting response from web service
try:
df_conv = p.DataFrame()
strCountryUrl = url + str(i).strip()
print('Country: ' + str(i).strip())
print('Url: ' + str(strCountryUrl))
str1 = 'Url: ' + str(strCountryUrl)
logging.info(str1)
response = requests.request("GET", strCountryUrl, headers=headers, params=payload)
ResJson = response.text
#jdata = json.dumps(ResJson)
RJson = json.loads(ResJson)
df_conv = p.io.json.json_normalize(RJson)
df_conv.drop(['data.timeline'], axis=1, inplace=True)
df_conv['DummyKey'] = 1
df_conv.set_index('DummyKey')
l.logr('1.df_conv_' + var + '.csv', debug_ind, df_conv, 'log')
# Extracting timeline part separately
Rjson_1 = RJson['data']['timeline']
df_conv2 = p.io.json.json_normalize(Rjson_1)
df_conv2['DummyKey'] = 1
df_conv2.set_index('DummyKey')
l.logr('2.df_conv_timeline_' + var + '.csv', debug_ind, df_conv2, 'log')
# Doing Cross Join
df_fin = df_conv.merge(df_conv2, on='DummyKey', how='outer')
l.logr('3.df_fin_' + var + '.csv', debug_ind, df_fin, 'log')
# Merging with the previous Country Code data
if cnt == 0:
df_M = df_fin
else:
d_frames = [df_M, df_fin]
df_M = p.concat(d_frames)
cnt += 1
strCountryUrl = ''
if str(response.status_code)[:1] == '2':
success = True
else:
wait = retries * 2
print("retries Fail! Waiting " + str(wait) + " seconds and retrying!")
str_R1 = "retries Fail! Waiting " + str(wait) + " seconds and retrying!"
logging.info(str_R1)
time.sleep(wait)
retries += 1
# Checking maximum retries
if retries == max_retries:
success = True
raise Exception
except Exception as e:
x = str(e)
print(x)
logging.info(x)
pass
except Exception as e:
pass
l.logr('4.df_M_' + var + '.csv', debug_ind, df_M, 'log')
return df_M
except Exception as e:
x = str(e)
print(x)
logging.info(x)
df = p.DataFrame()
return df

view raw

clsCovidAPI.py

hosted with ❤ by GitHub

Let us explore the key snippet –

countryList = typVal.split(',')

The application will fetch individual country names into a list based on the input lists from the configure script.

response = requests.request("GET", strCountryUrl, headers=headers, params=payload)
ResJson = response.text

RJson = json.loads(ResJson)

df_conv = p.io.json.json_normalize(RJson)
df_conv.drop(['data.timeline'], axis=1, inplace=True)
df_conv['DummyKey'] = 1
df_conv.set_index('DummyKey')

The application will extract the elements & normalize the JSON & convert that to a pandas dataframe & also added one dummy column, which will use for the later purpose to merge the data from another set.

# Extracting timeline part separately
Rjson_1 = RJson['data']['timeline']

df_conv2 = p.io.json.json_normalize(Rjson_1)
df_conv2['DummyKey'] = 1
df_conv2.set_index('DummyKey')

Now, the application will take the nested element & normalize that as per granular level. Also, it added the dummy column to join both of these data together.

# Doing Cross Join
df_fin = df_conv.merge(df_conv2, on='DummyKey', how='outer')

The application will Merge both the data sets to get the complete denormalized data for our use cases.

# Merging with the previous Country Code data
if cnt == 0:
    df_M = df_fin
else:
    d_frames = [df_M, df_fin]
    df_M = p.concat(d_frames)

This entire deserializing execution happens per country. Hence, the above snippet will create an individual sub-group based on the country & later does union to all the sets.

if str(response.status_code)[:1] == '2':
    success = True
else:
    wait = retries * 2
    print("retries Fail! Waiting " + str(wait) + " seconds and retrying!")
    str_R1 = "retries Fail! Waiting " + str(wait) + " seconds and retrying!"
    logging.info(str_R1)
    time.sleep(wait)
    retries += 1

# Checking maximum retries
if retries == max_retries:
    success = True
    raise  Exception

If any calls to source API fails, the application will retrigger after waiting for a specific time until it reaches its maximum capacity.

5. callPredictCovidAnalysis.py ( This native Python script is the main one to predict the Covid. )


##############################################
#### Written By: SATYAKI DE ####
#### Written On: 26-Jul-2021 ####
#### Modified On 26-Jul-2021 ####
#### ####
#### Objective: Calling multiple API's ####
#### that including Prophet-API developed ####
#### by Facebook for future prediction of ####
#### Covid-19 situations in upcoming days ####
#### for world's major hotspots. ####
##############################################
import json
import clsCovidAPI as ca
from clsConfig import clsConfig as cf
import datetime
import logging
import clsL as cl
import clsForecast as f
from prophet import Prophet
from prophet.plot import plot_plotly, plot_components_plotly
import matplotlib.pyplot as plt
import pandas as p
# Disbling Warning
def warn(*args, **kwargs):
pass
import warnings
warnings.warn = warn
# Initiating Log class
l = cl.clsL()
# Helper Function that removes underscores
def countryDet(inputCD):
try:
countryCD = inputCD
if str(countryCD) == 'DE':
cntCD = 'Germany'
elif str(countryCD) == 'BR':
cntCD = 'Brazil'
elif str(countryCD) == 'GB':
cntCD = 'United Kingdom'
elif str(countryCD) == 'US':
cntCD = 'United States'
elif str(countryCD) == 'IN':
cntCD = 'India'
elif str(countryCD) == 'CA':
cntCD = 'Canada'
elif str(countryCD) == 'ID':
cntCD = 'Indonesia'
else:
cntCD = 'N/A'
return cntCD
except:
cntCD = 'N/A'
return cntCD
def plot_picture(inputDF, debug_ind, var, countryCD, stat):
try:
iDF = inputDF
# Lowercase the column names
iDF.columns = [c.lower() for c in iDF.columns]
# Determine which is Y axis
y_col = [c for c in iDF.columns if c.startswith('y')][0]
# Determine which is X axis
x_col = [c for c in iDF.columns if c.startswith('ds')][0]
# Data Conversion
iDF['y'] = iDF[y_col].astype('float')
iDF['ds'] = iDF[x_col].astype('datetime64[ns]')
# Forecast calculations
# Decreasing the changepoint_prior_scale to 0.001 to make the trend less flexible
m = Prophet(n_changepoints=20, yearly_seasonality=True, changepoint_prior_scale=0.001)
m.fit(iDF)
forecastDF = m.make_future_dataframe(periods=365)
forecastDF = m.predict(forecastDF)
l.logr('15.forecastDF_' + var + '_' + countryCD + '.csv', debug_ind, forecastDF, 'log')
df_M = forecastDF[['ds', 'yhat', 'yhat_lower', 'yhat_upper']]
l.logr('16.df_M_' + var + '_' + countryCD + '.csv', debug_ind, df_M, 'log')
#m.plot_components(df_M)
# Getting Full Country Name
cntCD = countryDet(countryCD)
# Draw forecast results
lbl = str(cntCD) + ' – Covid – ' + stat
m.plot(df_M, xlabel = 'Date', ylabel = lbl)
# Combine all graps in the same page
plt.title(f'Covid Forecasting')
plt.title(lbl)
plt.ylabel('Millions')
plt.show()
return 0
except Exception as e:
x = str(e)
print(x)
return 1
def countrySpecificDF(counryDF, val):
try:
countryName = val
df = counryDF
df_lkpFile = df[(df['CountryCode'] == val)]
return df_lkpFile
except:
df = p.DataFrame()
return df
def main():
try:
var1 = datetime.datetime.now().strftime("%Y-%m-%d_%H-%M-%S")
print('*' *60)
DInd = 'Y'
NC = 'New Confirmed'
ND = 'New Dead'
SM = 'data process Successful!'
FM = 'data process Failure!'
print("Calling the custom Package for large file splitting..")
print('Start Time: ' + str(var1))
countryList = str(cf.conf['coList']).split(',')
# Initiating Log Class
general_log_path = str(cf.conf['LOG_PATH'])
# Enabling Logging Info
logging.basicConfig(filename=general_log_path + 'CovidAPI.log', level=logging.INFO)
# Create the instance of the Covid API Class
x1 = ca.clsCovidAPI()
# Let's pass this to our map section
retDF = x1.searchQry(var1, DInd)
retVal = int(retDF.shape[0])
if retVal > 0:
print('Successfully Covid Data Extracted from the API-source.')
else:
print('Something wrong with your API-source!')
# Extracting Skeleton Data
df = retDF[['data.code', 'date', 'deaths', 'confirmed', 'recovered', 'new_confirmed', 'new_recovered', 'new_deaths', 'active']]
df.columns = ['CountryCode', 'ReportedDate', 'TotalReportedDead', 'TotalConfirmedCase', 'TotalRecovered', 'NewConfirmed', 'NewRecovered', 'NewDeaths', 'ActiveCaases']
df.dropna()
print('Returned Skeleton Data Frame: ')
print(df)
l.logr('5.df_' + var1 + '.csv', DInd, df, 'log')
# Working with forecast
# Create the instance of the Forecast API Class
x2 = f.clsForecast()
# Fetching each country name & then get the details
cnt = 6
for i in countryList:
try:
cntryIndiv = i.strip()
print('Country Porcessing: ' + str(cntryIndiv))
# Creating dataframe for each country
# Germany Main DataFrame
dfCountry = countrySpecificDF(df, cntryIndiv)
l.logr(str(cnt) + '.df_' + cntryIndiv + '_' + var1 + '.csv', DInd, dfCountry, 'log')
# Let's pass this to our map section
retDFGenNC = x2.forecastNewConfirmed(dfCountry, DInd, var1)
statVal = str(NC)
a1 = plot_picture(retDFGenNC, DInd, var1, cntryIndiv, statVal)
retDFGenNC_D = x2.forecastNewDead(dfCountry, DInd, var1)
statVal = str(ND)
a2 = plot_picture(retDFGenNC_D, DInd, var1, cntryIndiv, statVal)
cntryFullName = countryDet(cntryIndiv)
if (a1 + a2) == 0:
oprMsg = cntryFullName + ' ' + SM
print(oprMsg)
else:
oprMsg = cntryFullName + ' ' + FM
print(oprMsg)
# Resetting the dataframe value for the next iteration
dfCountry = p.DataFrame()
cntryIndiv = ''
oprMsg = ''
cntryFullName = ''
a1 = 0
a2 = 0
statVal = ''
cnt += 1
except Exception as e:
x = str(e)
print(x)
var2 = datetime.datetime.now().strftime("%Y-%m-%d_%H-%M-%S")
print('End Time: ' + str(var2))
print('*' *60)
except Exception as e:
x = str(e)
if __name__ == "__main__":
main()

Let us explore the key snippet –

def countryDet(inputCD):
    try:
        countryCD = inputCD

        if str(countryCD) == 'DE':
            cntCD = 'Germany'
        elif str(countryCD) == 'BR':
            cntCD = 'Brazil'
        elif str(countryCD) == 'GB':
            cntCD = 'United Kingdom'
        elif str(countryCD) == 'US':
            cntCD = 'United States'
        elif str(countryCD) == 'IN':
            cntCD = 'India'
        elif str(countryCD) == 'CA':
            cntCD = 'Canada'
        elif str(countryCD) == 'ID':
            cntCD = 'Indonesia'
        else:
            cntCD = 'N/A'

        return cntCD
    except:
        cntCD = 'N/A'

        return cntCD

The application is extracting the full country name based on ISO country code.

# Lowercase the column names
iDF.columns = [c.lower() for c in iDF.columns]
# Determine which is Y axis
y_col = [c for c in iDF.columns if c.startswith('y')][0]
# Determine which is X axis
x_col = [c for c in iDF.columns if c.startswith('ds')][0]

# Data Conversion
iDF['y'] = iDF[y_col].astype('float')
iDF['ds'] = iDF[x_col].astype('datetime64[ns]')

The above script will convert all the column names in lower letters & then convert & cast them with the appropriate data type.

# Forecast calculations
# Decreasing the changepoint_prior_scale to 0.001 to make the trend less flexible
m = Prophet(n_changepoints=20, yearly_seasonality=True, changepoint_prior_scale=0.001)
m.fit(iDF)

forecastDF = m.make_future_dataframe(periods=365)

forecastDF = m.predict(forecastDF)

l.logr('15.forecastDF_' + var + '_' + countryCD + '.csv', debug_ind, forecastDF, 'log')

df_M = forecastDF[['ds', 'yhat', 'yhat_lower', 'yhat_upper']]

l.logr('16.df_M_' + var + '_' + countryCD + '.csv', debug_ind, df_M, 'log')

The above snippet will use the machine-learning driven prophet-API, where the application will fit the model & then predict based on the existing data for a year. Also, we’ve identified the number of changepoints. By default, the prophet-API adds 25 changepoints to the initial 80% of the data set that trend is less flexible. 

Prophet allows you to adjust the trend in case there is an overfit or underfit. changepoint_prior_scale helps adjust the strength of the movement & decreasing the changepoint_prior_scale to 0.001 to make it less flexible.

def countrySpecificDF(counryDF, val):
    try:
        countryName = val
        df = counryDF

        df_lkpFile = df[(df['CountryCode'] == val)]

        return df_lkpFile
    except:
        df = p.DataFrame()

        return df

The application is fetching & creating the country-specific dataframe.

for i in countryList:
    try:
        cntryIndiv = i.strip()

        print('Country Porcessing: ' + str(cntryIndiv))

        # Creating dataframe for each country
        # Germany Main DataFrame
        dfCountry = countrySpecificDF(df, cntryIndiv)
        l.logr(str(cnt) + '.df_' + cntryIndiv + '_' + var1 + '.csv', DInd, dfCountry, 'log')

        # Let's pass this to our map section
        retDFGenNC = x2.forecastNewConfirmed(dfCountry, DInd, var1)

        statVal = str(NC)

        a1 = plot_picture(retDFGenNC, DInd, var1, cntryIndiv, statVal)

        retDFGenNC_D = x2.forecastNewDead(dfCountry, DInd, var1)

        statVal = str(ND)

        a2 = plot_picture(retDFGenNC_D, DInd, var1, cntryIndiv, statVal)

        cntryFullName = countryDet(cntryIndiv)

        if (a1 + a2) == 0:
            oprMsg = cntryFullName + ' ' + SM
            print(oprMsg)
        else:
            oprMsg = cntryFullName + ' ' + FM
            print(oprMsg)

        # Resetting the dataframe value for the next iteration
        dfCountry = p.DataFrame()
        cntryIndiv = ''
        oprMsg = ''
        cntryFullName = ''
        a1 = 0
        a2 = 0
        statVal = ''

        cnt += 1
    except Exception as e:
        x = str(e)
        print(x)

The above snippet will call the function to predict the data & then predict the visual representation based on plotting the data points.


Let us run the application –

Application Run

And, it will generate the visual representation as follows –

Application Run – Continue

And, here is the folder structure –

Directory Structure

Let’s explore the comparison study & try to find out the outcome –

Option – 1
Option – 2
Option – 3
Option -4

Let us analyze from the above visual data-point.


Conclusion:

Let’s explore the comparison study & try to find out the outcome –

  1. India may see a rise of new covid cases & it might cross the mark 400,000 during June 2022 & would be the highest among the countries that we’ve considered here including India, Indonesia, Germany, US, UK, Canada & Brazil. The second worst affected country might be the US during the same period. The third affected country will be Indonesia during the same period.
  2. Canada will be the least affected country during June 2022. The figure should be within 12,000.
  3. However, death case wise India is not only the leading country. The US, India & Brazil will see almost 4000 or slightly over the 4000 marks.

So, we’ve done it.


You will get the complete codebase in the following Github link.

I’ll bring some more exciting topic in the coming days from the Python verse.

Till then, Happy Avenging! 😀


Note: All the data & scenario posted here are representational data & scenarios & available over the internet & for educational purpose only.

One more thing you need to understand is that this prediction based on limited data points. The actual event may happen differently. Ideally, countries are taking a cue from this kind of analysis & are initiating appropriate measures to avoid the high-curve. And, that is one of the main objective of time series analysis.

There is always a room for improvement of this kind of models & the solution associated with it. I’ve shown the basic ways to achieve the same for the education purpose only.

Displaying real-time trade data in a dashboard using Python & third-party API & Streaming

Today, We want to make our use case a little bit harder & more realistic. We want to consume real-time live trade-data consuming through FinnHub API & displaying them into our dashboard using another brilliant H2O-Wave API with the help of native Python.

The use-case mentioned above is extremely useful & for that, we’ll be using the following Third-Party APIs to achieve the same –

  1. FinnHub: For more information, please click the following link.
  2. Ably: For more information, please click the following link.
  3. H2O-Wave: For more information, please click the following link.

I’m not going to discuss these topics more, as I’ve already discussed them in separate earlier posts. Please refer to the following threads for detailed level information –

creating-a-real-time-dashboard-from-streaming-data-using-python


In this post, we will address the advanced concept compared to the previous post mentioned above. Let us first look at how the run looks before we start exploring the details –

Real-time trade dashboard

Let us explore the architecture of this implementation –

Architecture Diagram

This application will talk to the FinnHub websocket & consume real-time trade data from it. And this will be temporarily stored in our Ably channels. The dashboard will pick the message & display that as soon as there is new data for that trading company.


For this use case, you need to install the following packages –

STEP – 1:

Main Packages

STEP – 2:

Main Packages – Continue

STEP – 3:

Main Packages – Continue

STEP – 4:

Main Packages – End

You can copy the following commands to install the above-mentioned packages –

pip install ably 
pip install h2o-wave
pip install pandas
pip install websocket
pip install websocket-client

Let’s explore the important data-point that you need to capture from the FinnHub portal to consume the real-time trade data –

FinnHub Portal

We’ve two main scripts. The first script will consume the streaming data into a message queue & the other one will be extracting the data from the queue & transform the data & publish it into the real-time dashboard.

1. dashboard_finnhub.py ( This native Python script will consume streaming data & create the live trade dashboard. )


###############################################################
#### Template Written By: H2O Wave ####
#### Enhanced with Streaming Data By: Satyaki De ####
#### Base Version Enhancement On: 20-Dec-2020 ####
#### Modified On 27-Jun-2021 ####
#### ####
#### Objective: This script will consume real-time ####
#### streaming data coming out from a hosted API ####
#### sources (Finnhub) using another popular third-party ####
#### service named Ably. Ably mimics pubsub Streaming ####
#### concept, which might be extremely useful for ####
#### any start-ups. ####
#### ####
#### Note: This is an enhancement of my previous post of ####
#### H2O Wave. In this case, the application will consume ####
#### streaming trade data from a live host & not generated ####
#### out of the mock data. Thus, it is more useful for the ####
#### start-ups. ####
###############################################################
import time
from h2o_wave import site, data, ui
from ably import AblyRest
import pandas as p
import json
import datetime
import logging
import platform as pl
from clsConfig import clsConfig as cf
import clsL as cl
# Disbling Warning
def warn(*args, **kwargs):
pass
import warnings
warnings.warn = warn
# Lookup functions from
# Azure cloud SQL DB
var = datetime.datetime.now().strftime("%Y-%m-%d_%H-%M-%S")
# Global Area
## Global Class
# Initiating Log Class
l = cl.clsL()
# Global Variables
# Moving previous day log files to archive directory
log_dir = cf.config['LOG_PATH']
path = cf.config['INIT_PATH']
subdir = cf.config['SUBDIR']
## End Of Global Part
class DaSeries:
def __init__(self, inputDf):
self.Df = inputDf
self.count_row = inputDf.shape[0]
self.start_pos = 0
self.end_pos = 0
self.interval = 1
def next(self):
try:
# Getting Individual Element & convert them to Series
if ((self.start_pos + self.interval) <= self.count_row):
self.end_pos = self.start_pos + self.interval
else:
self.end_pos = self.start_pos + (self.count_row – self.start_pos)
split_df = self.Df.iloc[self.start_pos:self.end_pos]
if ((self.start_pos > self.count_row) | (self.start_pos == self.count_row)):
pass
else:
self.start_pos = self.start_pos + self.interval
x = float(split_df.iloc[0]['CurrentExchange'])
dx = float(split_df.iloc[0]['Change'])
# Emptying the exisitng dataframe
split_df = p.DataFrame(None)
return x, dx
except:
x = 0
dx = 0
return x, dx
class CategoricalSeries:
def __init__(self, sourceDf):
self.series = DaSeries(sourceDf)
self.i = 0
def next(self):
x, dx = self.series.next()
self.i += 1
return f'C{self.i}', x, dx
light_theme_colors = '$red $pink $purple $violet $indigo $blue $azure $cyan $teal $mint $green $amber $orange $tangerine'.split()
dark_theme_colors = '$red $pink $blue $azure $cyan $teal $mint $green $lime $yellow $amber $orange $tangerine'.split()
_color_index = -1
colors = dark_theme_colors
def next_color():
global _color_index
_color_index += 1
return colors[_color_index % len(colors)]
_curve_index = -1
curves = 'linear smooth step step-after step-before'.split()
def next_curve():
global _curve_index
_curve_index += 1
return curves[_curve_index % len(curves)]
def calc_p(row):
try:
str_calc_s1 = str(row['s_x'])
str_calc_s2 = str(row['s_y'])
if str_calc_s1 == str_calc_s2:
calc_p_val = float(row['p_y'])
else:
calc_p_val = float(row['p_x'])
return calc_p_val
except:
return 0.0
def calc_v(row):
try:
str_calc_s1 = str(row['s_x'])
str_calc_s2 = str(row['s_y'])
if str_calc_s1 == str_calc_s2:
calc_v_val = float(row['v_y'])
else:
calc_v_val = float(row['v_x'])
return calc_v_val
except:
return 0.0
def process_DF(inputDF, inputDFUnq):
try:
# Core Business logic
# The application will show default value to any
# trade-in stock in case that data doesn't consume
# from the source.
df_conv = inputDF
df_unique_fin = inputDFUnq
df_conv['max_count'] = df_conv.groupby('default_rank')['default_rank'].transform('count')
l.logr('3. max_df.csv', 'Y', df_conv, subdir)
# Sorting the output
sorted_df = df_conv.sort_values(by=['default_rank','s'], ascending=True)
# New Column List Orders
column_order = ['s', 'default_rank', 'max_count', 'p', 't', 'v']
df_fin = sorted_df.reindex(column_order, axis=1)
l.logr('4. sorted_df.csv', 'Y', df_fin, subdir)
# Now splitting the sorted df into two sets
lkp_max_count = 4
df_fin_na = df_fin[(df_fin['max_count'] == lkp_max_count)]
l.logr('5. df_fin_na.csv', 'Y', df_fin_na, subdir)
df_fin_req = df_fin[(df_fin['max_count'] != lkp_max_count)]
l.logr('6. df_fin_req.csv', 'Y', df_fin_req, subdir)
# Now to perform cross join, we will create
# a key column in both the DataFrames to
# merge on that key.
df_unique_fin['key'] = 1
df_fin_req['key'] = 1
# Dropping unwanted columns
df_unique_fin.drop(columns=['t'], axis=1, inplace=True)
l.logr('7. df_unique_slim.csv', 'Y', df_unique_fin, subdir)
# Padding with dummy key values
#merge_df = p.merge(df_unique_fin,df_fin_req,on=['s'],how='left')
merge_df = p.merge(df_unique_fin,df_fin_req,on=['key']).drop("key", 1)
l.logr('8. merge_df.csv', 'Y', merge_df, subdir)
# Sorting the output
sorted_merge_df = merge_df.sort_values(by=['default_rank_y','s_x'], ascending=True)
l.logr('9. sorted_merge_df.csv', 'Y', sorted_merge_df, subdir)
# Calling new derived logic
sorted_merge_df['derived_p'] = sorted_merge_df.apply(lambda row: calc_p(row), axis=1)
sorted_merge_df['derived_v'] = sorted_merge_df.apply(lambda row: calc_v(row), axis=1)
l.logr('10. sorted_merge_derived.csv', 'Y', sorted_merge_df, subdir)
# Dropping unwanted columns
sorted_merge_df.drop(columns=['default_rank_x', 'p_x', 'v_x', 's_y', 'p_y', 'v_y'], axis=1, inplace=True)
#Renaming the columns
sorted_merge_df.rename(columns={'s_x':'s'}, inplace=True)
sorted_merge_df.rename(columns={'default_rank_y':'default_rank'}, inplace=True)
sorted_merge_df.rename(columns={'derived_p':'p'}, inplace=True)
sorted_merge_df.rename(columns={'derived_v':'v'}, inplace=True)
l.logr('11. org_merge_derived.csv', 'Y', sorted_merge_df, subdir)
# Aligning columns
column_order = ['s', 'default_rank', 'max_count', 'p', 't', 'v']
merge_fin_df = sorted_merge_df.reindex(column_order, axis=1)
l.logr('12. merge_fin_df.csv', 'Y', merge_fin_df, subdir)
# Finally, appending these two DataFrame (df_fin_na & merge_fin_df)
frames = [df_fin_na, merge_fin_df]
fin_df = p.concat(frames, keys=["s", "default_rank", "max_count"])
l.logr('13. fin_df.csv', 'Y', fin_df, subdir)
# Final clearance & organization
fin_df.drop(columns=['default_rank', 'max_count'], axis=1, inplace=True)
l.logr('14. Final.csv', 'Y', fin_df, subdir)
# Adjusting key columns
fin_df.rename(columns={'s':'Company'}, inplace=True)
fin_df.rename(columns={'p':'CurrentExchange'}, inplace=True)
fin_df.rename(columns={'v':'Change'}, inplace=True)
l.logr('15. TransormedFinal.csv', 'Y', fin_df, subdir)
return fin_df
except Exception as e:
print('$' * 120)
x = str(e)
print(x)
print('$' * 120)
df = p.DataFrame()
return df
def create_dashboard(update_freq=0.0):
page = site['/dashboard_finnhub']
general_log_path = str(cf.config['LOG_PATH'])
ably_id = str(cf.config['ABLY_ID'])
# Enabling Logging Info
logging.basicConfig(filename=general_log_path + 'Realtime_Stock.log', level=logging.INFO)
os_det = pl.system()
if os_det == "Windows":
src_path = path + '\\' + 'data\\'
else:
src_path = path + '/' + 'data/'
# Fetching the data
client = AblyRest(ably_id)
channel = client.channels.get('sd_channel')
message_page = channel.history()
# Counter Value
cnt = 0
# Declaring Global Data-Frame
df_conv = p.DataFrame()
for i in message_page.items:
print('Last Msg: {}'.format(i.data))
json_data = json.loads(i.data)
# Converting JSON to Dataframe
df = p.json_normalize(json_data)
df.columns = df.columns.map(lambda x: x.split(".")[-1])
if cnt == 0:
df_conv = df
else:
d_frames = [df_conv, df]
df_conv = p.concat(d_frames)
cnt += 1
# Resetting the Index Value
df_conv.reset_index(drop=True, inplace=True)
print('DF:')
print(df_conv)
# Writing to the file
l.logr('1. DF_modified.csv', 'Y', df_conv, subdir)
# Dropping unwanted columns
df_conv.drop(columns=['c'], axis=1, inplace=True)
df_conv['default_rank'] = df_conv.groupby(['s']).cumcount() + 1
lkp_rank = 1
df_unique = df_conv[(df_conv['default_rank'] == lkp_rank)]
# New Column List Orders
column_order = ['s', 'default_rank', 'p', 't', 'v']
df_unique_fin = df_unique.reindex(column_order, axis=1)
print('Rank DF Unique:')
print(df_unique_fin)
l.logr('2. df_unique.csv', 'Y', df_unique_fin, subdir)
# Capturing transformed values into a DataFrame
# Depending on your logic, you'll implement that inside
# the process_DF functions
fin_df = process_DF(df_conv, df_unique_fin)
df_unq_fin = df_unique_fin.copy()
df_unq_fin.rename(columns={'s':'Company'}, inplace=True)
df_unq_fin.rename(columns={'p':'CurrentExchange'}, inplace=True)
df_unq_fin.rename(columns={'v':'Change'}, inplace=True)
df_unq_fin.drop(columns=['default_rank','key'], axis=1, inplace=True)
l.logr('16. df_unq_fin.csv', 'Y', df_unq_fin, subdir)
df_unq_finale = df_unq_fin.sort_values(by=['Company'], ascending=True)
l.logr('17. df_unq_finale.csv', 'Y', df_unq_finale, subdir)
# Final clearance for better understanding of data
fin_df.drop(columns=['t'], axis=1, inplace=True)
l.logr('18. CleanFinal.csv', 'Y', fin_df, subdir)
count_row = df_unq_finale.shape[0]
large_lines = []
start_pos = 0
end_pos = 0
interval = 1
# Converting dataframe to a desired Series
f = CategoricalSeries(fin_df)
for j in range(count_row):
# Getting the series values from above
cat, val, pc = f.next()
# Getting Individual Element & convert them to Series
if ((start_pos + interval) <= count_row):
end_pos = start_pos + interval
else:
end_pos = start_pos + (count_row – start_pos)
split_df = df_unq_finale.iloc[start_pos:end_pos]
if ((start_pos > count_row) | (start_pos == count_row)):
pass
else:
start_pos = start_pos + interval
x_currency = str(split_df.iloc[0]['Company'])
####################################################
##### Debug Purpose #########
####################################################
print('Company: ', x_currency)
print('J: ', str(j))
print('Cat: ', cat)
####################################################
##### End Of Debug #######
####################################################
c = page.add(f'e{j+1}', ui.tall_series_stat_card(
box=f'{j+1} 1 1 2',
title=x_currency,
value='=${{intl qux minimum_fraction_digits=2 maximum_fraction_digits=2}}',
aux_value='={{intl quux style="percent" minimum_fraction_digits=1 maximum_fraction_digits=1}}',
data=dict(qux=val, quux=pc),
plot_type='area',
plot_category='foo',
plot_value='qux',
plot_color=next_color(),
plot_data=data('foo qux', -15),
plot_zero_value=0,
plot_curve=next_curve(),
))
large_lines.append((f, c))
page.save()
while update_freq > 0:
time.sleep(update_freq)
for f, c in large_lines:
cat, val, pc = f.next()
print('Update Cat: ', cat)
print('Update Val: ', val)
print('Update pc: ', pc)
print('*' * 160)
c.data.qux = val
c.data.quux = pc / 100
c.plot_data[-1] = [cat, val]
page.save()
if __name__ == "__main__":
try:
# Main Calling script
create_dashboard(update_freq=0.25)
except Exception as e:
x = str(e)
print(x)

Let’s explore the key snippets from the above script –

def process_DF(inputDF, inputDFUnq):
    try:
        # Core Business logic
        # The application will show default value to any
        # trade-in stock in case that data doesn't consume
        # from the source.
        
        # Getting block count
        #df_conv['block_count'] = df_conv.groupby(['default_rank']).cumcount()
        #l.logr('3. block_df.csv', 'Y', df_conv, subdir)

        # Getting block count
        #df_conv['max_count'] = df_conv.groupby(['default_rank']).size()
        #df_conv_fin = df_conv.groupby(['default_rank']).agg(['count'])
        #df_conv_fin = df_conv.value_counts(['default_rank']).reset_index(name='max_count')
        #df_conv_fin = df_conv.value_counts(['default_rank'])
        df_conv = inputDF
        df_unique_fin = inputDFUnq

        df_conv['max_count'] = df_conv.groupby('default_rank')['default_rank'].transform('count')
        l.logr('3. max_df.csv', 'Y', df_conv, subdir)


        # Sorting the output
        sorted_df = df_conv.sort_values(by=['default_rank','s'], ascending=True)

        # New Column List Orders
        column_order = ['s', 'default_rank', 'max_count', 'p', 't', 'v']
        df_fin = sorted_df.reindex(column_order, axis=1)

        l.logr('4. sorted_df.csv', 'Y', df_fin, subdir)

        # Now splitting the sorted df into two sets
        lkp_max_count = 4
        df_fin_na = df_fin[(df_fin['max_count'] == lkp_max_count)]

        l.logr('5. df_fin_na.csv', 'Y', df_fin_na, subdir)

        df_fin_req = df_fin[(df_fin['max_count'] != lkp_max_count)]
        l.logr('6. df_fin_req.csv', 'Y', df_fin_req, subdir)

        # Now to perform cross join, we will create
        # a key column in both the DataFrames to
        # merge on that key.
        df_unique_fin['key'] = 1
        df_fin_req['key'] = 1

        # Dropping unwanted columns
        df_unique_fin.drop(columns=['t'], axis=1, inplace=True)
        l.logr('7. df_unique_slim.csv', 'Y', df_unique_fin, subdir)

        # Padding with dummy key values
        #merge_df = p.merge(df_unique_fin,df_fin_req,on=['s'],how='left')
        merge_df = p.merge(df_unique_fin,df_fin_req,on=['key']).drop("key", 1)

        l.logr('8. merge_df.csv', 'Y', merge_df, subdir)

        # Sorting the output
        sorted_merge_df = merge_df.sort_values(by=['default_rank_y','s_x'], ascending=True)

        l.logr('9. sorted_merge_df.csv', 'Y', sorted_merge_df, subdir)

        # Calling new derived logic
        sorted_merge_df['derived_p'] = sorted_merge_df.apply(lambda row: calc_p(row), axis=1)
        sorted_merge_df['derived_v'] = sorted_merge_df.apply(lambda row: calc_v(row), axis=1)

        l.logr('10. sorted_merge_derived.csv', 'Y', sorted_merge_df, subdir)

        # Dropping unwanted columns
        sorted_merge_df.drop(columns=['default_rank_x', 'p_x', 'v_x', 's_y', 'p_y', 'v_y'], axis=1, inplace=True)

        #Renaming the columns
        sorted_merge_df.rename(columns={'s_x':'s'}, inplace=True)
        sorted_merge_df.rename(columns={'default_rank_y':'default_rank'}, inplace=True)
        sorted_merge_df.rename(columns={'derived_p':'p'}, inplace=True)
        sorted_merge_df.rename(columns={'derived_v':'v'}, inplace=True)

        l.logr('11. org_merge_derived.csv', 'Y', sorted_merge_df, subdir)

        # Aligning columns
        column_order = ['s', 'default_rank', 'max_count', 'p', 't', 'v']
        merge_fin_df = sorted_merge_df.reindex(column_order, axis=1)

        l.logr('12. merge_fin_df.csv', 'Y', merge_fin_df, subdir)

        # Finally, appending these two DataFrame (df_fin_na & merge_fin_df)
        frames = [df_fin_na, merge_fin_df]
        fin_df = p.concat(frames, keys=["s", "default_rank", "max_count"])

        l.logr('13. fin_df.csv', 'Y', fin_df, subdir)

        # Final clearance & organization
        fin_df.drop(columns=['default_rank', 'max_count'], axis=1, inplace=True)

        l.logr('14. Final.csv', 'Y', fin_df, subdir)

        # Adjusting key columns
        fin_df.rename(columns={'s':'Company'}, inplace=True)
        fin_df.rename(columns={'p':'CurrentExchange'}, inplace=True)
        fin_df.rename(columns={'v':'Change'}, inplace=True)

        l.logr('15. TransormedFinal.csv', 'Y', fin_df, subdir)

        return fin_df
    except Exception as e:
        print('$' * 120)

        x = str(e)
        print(x)

        print('$' * 120)

        df = p.DataFrame()

        return df

The above function will check if the queue is sending all the key trade-in data for all the companies. In our use case, we’re testing with the four companies & they are as follows –

a. AAPL
b. AMZN
c. BINANCE:BTCUSDT
d. IC MARKETS:1

Every message is containing data from all of these four companies together. If any of the company’s data is missing, this transformation will add a dummy record of that missing company to make the uniform number of entries in each message bouquet. And dummy trade-in values added for all the missing information.

def calc_p(row):
    try:
        str_calc_s1 = str(row['s_x'])
        str_calc_s2 = str(row['s_y'])

        if str_calc_s1 == str_calc_s2:
            calc_p_val = float(row['p_y'])
        else:
            calc_p_val = float(row['p_x'])

        return calc_p_val
    except:
        return 0.0

def calc_v(row):
    try:
        str_calc_s1 = str(row['s_x'])
        str_calc_s2 = str(row['s_y'])

        if str_calc_s1 == str_calc_s2:
            calc_v_val = float(row['v_y'])
        else:
            calc_v_val = float(row['v_x'])

        return calc_v_val
    except:
        return 0.0

The above snippet will capture the default values for those missing records.

    client = AblyRest(ably_id)
    channel = client.channels.get('sd_channel')

    message_page = channel.history()

In the above snippet, the application will consume the streaming data from the Ably queue.

for i in message_page.items:
        print('Last Msg: {}'.format(i.data))
        json_data = json.loads(i.data)

        # Converting JSON to Dataframe
        df = p.json_normalize(json_data)
        df.columns = df.columns.map(lambda x: x.split(".")[-1])

        if cnt == 0:
            df_conv = df
        else:
            d_frames = [df_conv, df]
            df_conv = p.concat(d_frames)

        cnt += 1

The above snippet will convert the streaming messages to a more meaningful pandas data-frame, which we can use for a wide variety of analytics.

    # Converting dataframe to a desired Series
    f = CategoricalSeries(fin_df)

    for j in range(count_row):
        # Getting the series values from above
        cat, val, pc = f.next()

        # Getting Individual Element & convert them to Series
        if ((start_pos + interval) <= count_row):
            end_pos = start_pos + interval
        else:
            end_pos = start_pos + (count_row - start_pos)

        split_df = df_unq_finale.iloc[start_pos:end_pos]

        if ((start_pos > count_row) | (start_pos == count_row)):
            pass
        else:
            start_pos = start_pos + interval

        x_currency = str(split_df.iloc[0]['Company'])

        ####################################################
        ##### Debug Purpose                        #########
        ####################################################
        print('Company: ', x_currency)
        print('J: ', str(j))
        print('Cat: ', cat)
        ####################################################
        #####   End Of Debug                         #######
        ####################################################

        c = page.add(f'e{j+1}', ui.tall_series_stat_card(
            box=f'{j+1} 1 1 2',
            title=x_currency,
            value='=${{intl qux minimum_fraction_digits=2 maximum_fraction_digits=2}}',
            aux_value='={{intl quux style="percent" minimum_fraction_digits=1 maximum_fraction_digits=1}}',
            data=dict(qux=val, quux=pc),
            plot_type='area',
            plot_category='foo',
            plot_value='qux',
            plot_color=next_color(),
            plot_data=data('foo qux', -15),
            plot_zero_value=0,
            plot_curve=next_curve(),
        ))
        large_lines.append((f, c))

    page.save()

    while update_freq > 0:

        time.sleep(update_freq)

        for f, c in large_lines:
            cat, val, pc = f.next()

            print('Update Cat: ', cat)
            print('Update Val: ', val)
            print('Update pc: ', pc)
            print('*' * 160)

            c.data.qux = val
            c.data.quux = pc / 100
            c.plot_data[-1] = [cat, val]

        page.save()

The above snippet will consume the data into H2O-Wave driven framework, which will expose this data into beautiful & easily representable GUI-based solutions through an interactive dashboard.


2. publish_ably_mod.py ( This native Python script will consume streaming data into Ably message Queue )


###############################################################
#### ####
#### Written By: Satyaki De ####
#### Written Date: 26-Jun-2021 ####
#### ####
#### Objective: This script will consume real-time ####
#### streaming data coming out from a hosted API ####
#### sources (Finnhub) using another popular third-party ####
#### service named Ably. Ably mimics pubsub Streaming ####
#### concept, which might be extremely useful for ####
#### any start-ups. ####
#### ####
###############################################################
from ably import AblyRest
import logging
import json
# generate random floating point values
from random import seed
from random import random
# seed random number generator
import websocket
import json
from clsConfig import clsConfig as cf
seed(1)
# Global Section
logger = logging.getLogger('ably')
logger.addHandler(logging.StreamHandler())
ably_id = str(cf.config['ABLY_ID'])
ably = AblyRest(ably_id)
channel = ably.channels.get('sd_channel')
# End Of Global Section
def on_message(ws, message):
print("*" * 60)
res = json.loads(message)
jsBody = res["data"]
jdata_dyn = json.dumps(jsBody)
print(jdata_dyn)
# JSON data
# This is the default data for all the identified category
# we've prepared. You can extract this dynamically. Or, By
# default you can set their base trade details.
json_data = [{
"c": "null",
"p": 0.01,
"s": "AAPL",
"t": 1624715406407,
"v": 0.01
},{
"c": "null",
"p": 0.01,
"s": "AMZN",
"t": 1624715406408,
"v": 0.01
},{
"c": "null",
"p": 0.01,
"s": "BINANCE:BTCUSDT",
"t": 1624715406409,
"v": 0.01
},
{
"c": "null",
"p": 0.01,
"s": "IC MARKETS:1",
"t": 1624715406410,
"v": 0.01
}]
jdata = json.dumps(json_data)
# Publish a message to the sd_channel channel
channel.publish('event', jdata)
# Publish rest of the messages to the sd_channel channel
channel.publish('event', jdata_dyn)
jsBody = []
jdata_dyn = ''
def on_error(ws, error):
print(error)
def on_close(ws):
print("### closed ###")
def on_open(ws):
# Invoking Individual Company Trade Queries
ws.send('{"type":"subscribe","symbol":"AAPL"}')
ws.send('{"type":"subscribe","symbol":"AMZN"}')
ws.send('{"type":"subscribe","symbol":"BINANCE:BTCUSDT"}')
ws.send('{"type":"subscribe","symbol":"IC MARKETS:1"}')
if __name__ == "__main__":
websocket.enableTrace(True)
ws = websocket.WebSocketApp("wss://ws.finnhub.io?token=jfhfyr8474rpv6av0",
on_message = on_message,
on_error = on_error,
on_close = on_close)
ws.on_open = on_open
ws.run_forever()

The key snippet from the above script –

    json_data = [{
        "c": "null",
        "p": 0.01,
        "s": "AAPL",
        "t": 1624715406407,
        "v": 0.01
    },{
        "c": "null",
        "p": 0.01,
        "s": "AMZN",
        "t": 1624715406408,
        "v": 0.01
    },{
        "c": "null",
        "p": 0.01,
        "s": "BINANCE:BTCUSDT",
        "t": 1624715406409,
        "v": 0.01
    },
        {
        "c": "null",
        "p": 0.01,
        "s": "IC MARKETS:1",
        "t": 1624715406410,
        "v": 0.01
        }]

As we already discussed, we’ll pass a default set of data for all the candidate companies.

    # Publish a message to the sd_channel channel
    channel.publish('event', jdata)

    # Publish rest of the messages to the sd_channel channel
    channel.publish('event', jdata_dyn)

Publish the messages to the created channel.

def on_open(ws):
    # Invoking Individual Company Trade Queries
    ws.send('{"type":"subscribe","symbol":"AAPL"}')
    ws.send('{"type":"subscribe","symbol":"AMZN"}')
    ws.send('{"type":"subscribe","symbol":"BINANCE:BTCUSDT"}')
    ws.send('{"type":"subscribe","symbol":"IC MARKETS:1"}')

if __name__ == "__main__":
    websocket.enableTrace(True)
    ws = websocket.WebSocketApp("wss://ws.finnhub.io?token=hdhdjdj9494ld934v6av0",
                              on_message = on_message,
                              on_error = on_error,
                              on_close = on_close)

Send the company-specific trade queries through websocket apps to submit that to FinnHub.

3. clsConfig.py ( This file contains the configuration details. )


################################################
#### Written By: SATYAKI DE ####
#### Written On: 15-May-2020 ####
#### ####
#### Objective: This script is a config ####
#### file, contains all the keys for ####
#### Machine-Learning. Application will ####
#### process these information & perform ####
#### various analysis on Linear-Regression. ####
################################################
import os
import platform as pl
class clsConfig(object):
Curr_Path = os.path.dirname(os.path.realpath(__file__))
os_det = pl.system()
if os_det == "Windows":
sep = '\\'
else:
sep = '/'
config = {
'APP_ID': 1,
'ARCH_DIR': Curr_Path + sep + 'arch' + sep,
'PROFILE_PATH': Curr_Path + sep + 'profile' + sep,
'LOG_PATH': Curr_Path + sep + 'log' + sep,
'REPORT_PATH': Curr_Path + sep + 'report',
'FILE_NAME': Curr_Path + sep + 'Data' + sep + 'TradeIn.csv',
'SRC_PATH': Curr_Path + sep + 'Data' + sep,
'APP_DESC_1': 'H2O Wave Integration with FinHubb!',
'DEBUG_IND': 'N',
'INIT_PATH': Curr_Path,
'SUBDIR' : 'data',
'ABLY_ID': 'WWP309489.93jfkT:32kkdhdJjdued79e'
}

view raw

clsConfig.py

hosted with ❤ by GitHub


Let’s explore the directory structure –

MAC Directory

Let’s run the application –

Step 1:

Starting of Wave Server

Step 2:

Triggering message consumption job

Step 3:

Triggering the main application

You can monitor the message consumption from your Ably portal as follows –

Message Consumption

If you want to know more detail, then you need to scroll down the page, where you will get this additional information –

Message spike during consumption

And, the final output in the interactive dashboard will be look like the below screenshot –

Interactive Real-time Dashboard

So, we’ve done it.

You will get the complete codebase in the following Github link.

I’ll bring some more exciting topic in the coming days from the Python verse.

Till then, Happy Avenging! 😀

Note: All the data & scenario posted here are representational data & scenarios & available over the internet & for educational purpose only.

Building Python-based best-route apps for Indian Railways

Hi Guys!

Today, I’ll present a way to get the best route from Indian Railways train between two specific sources & destination using third-party API.

This approach is particularly beneficial if you want to integrate this logic in Azure Function or Lambda Function or any serverless functions.

Before we dig into the details. Let us explore what kind of cloud-based architecture we can implement this.

Architecture

Fig: 1 (Cloud Architecture)

In this case, I’ve considered Azure as the implementation platform.

Let’s discuss how the events will take place. At first, a user searches for the best routes between two fixed stations. The user has to provide the source & destination stations. The request will go through the Azure Firewall after validating the initial authentication. As part of the API service, it will check for similar queries & if it is there, then it will fetch it from the cache & send it back to the user through their mobile application. However, for the first time, it will retrieve the information from the DB & keep a copy in the cache. This part also managed through a load balancer for high-level availability. However, periodically system will push the data from the cache to the DB with the updated information.

Let’s see the program directory structure –

ProgramDir

Let’s discuss our code –

1. clsConfig.py (This script contains all the parameters for the main Indian Railway API & try to get the response between two railway stations. Hence, the name comes into the picture.)

 1
 2
 3
 4
 5
 6
 7
 8
 9
10
11
12
13
14
15
16
17
18
19
20
21
22
23
24
25
26
27
28
29
30
31
32
33
34
35
36
37
38
##############################################
#### Written By: SATYAKI DE               ####
#### Written On: 12-Oct-2019              ####
####                                      ####
#### Objective: This script is a config   ####
#### file, contains all the keys for      ####
#### azure cosmos db. Application will    ####
#### process these information & perform  ####
#### various CRUD operation on Cosmos DB. ####
##############################################

import os
import platform as pl

class clsConfig(object):
    Curr_Path = os.path.dirname(os.path.realpath(__file__))

    os_det = pl.system()
    if os_det == "Windows":
        sep = '\\'
    else:
        sep = '/'

    config = {
        'APP_ID': 1,
        'URL': "https://trains.p.rapidapi.com/",
        'RAPID_API_HOST': "trains.p.rapidapi.com",
        'RAPID_API_KEY': "hrfjjdfjfjfjfjxxxxxjffjjfjfjfjfjfjfjf",
        'RAPID_API_TYPE': "application/json",
        'ARCH_DIR': Curr_Path + sep + 'arch' + sep,
        'PROFILE_PATH': Curr_Path + sep + 'profile' + sep,
        'LOG_PATH': Curr_Path + sep + 'log' + sep,
        'REPORT_PATH': Curr_Path + sep + 'report',
        'APP_DESC_1': 'Indian Railway Train Schedule Search',
        'DEBUG_IND': 'N',
        'INIT_PATH': Curr_Path,
        'COL_LIST': ['name','train_num','train_from','train_to','classes','departTime','arriveTime','Mon','Tue','Wed','Thu','Fri','Sat','Sun']
    }

As of now, I’ve replaced the API Key with the dummy value.

2. clsIndianRailway.py (This script will invoke the main Indian Railway API & try to get the response between two railway stations. Hence, the name comes into the picture.)

 1
 2
 3
 4
 5
 6
 7
 8
 9
10
11
12
13
14
15
16
17
18
19
20
21
22
23
24
25
26
27
28
29
30
31
32
33
34
35
36
37
38
39
40
41
42
43
44
45
46
47
48
49
50
51
52
53
54
55
56
57
58
59
60
##############################################
#### Written By: SATYAKI DE               ####
#### Written On: 20-Dec-2019              ####
#### Modified On 20-Dec-2019              ####
####                                      ####
#### Objective: Main scripts to invoke    ####
#### Indian Railway API.                  ####
##############################################

import requests
import logging
import json
from clsConfig import clsConfig as cf

class clsIndianRailway:
    def __init__(self):
        self.url = cf.config['URL']
        self.rapidapi_host = cf.config['RAPID_API_HOST']
        self.rapidapi_key = cf.config['RAPID_API_KEY']
        self.type = cf.config['RAPID_API_TYPE']

    def searchQry(self, rawQry):
        try:
            url = self.url
            rapidapi_host = self.rapidapi_host
            rapidapi_key = self.rapidapi_key
            type = self.type

            Ipayload = "{\"search\":\"" + rawQry + "\"}"

            jpayload = json.dumps(Ipayload)
            payload = json.loads(jpayload)

            print('Input JSON: ', str(payload))

            headers = {
                'x-rapidapi-host': rapidapi_host,
                'x-rapidapi-key': rapidapi_key,
                'content-type': type,
                'accept': type
                }

            response = requests.request("POST", url, data=payload, headers=headers)

            ResJson  = response.text

            jdata = json.dumps(ResJson)
            ResJson = json.loads(jdata)

            return ResJson

        except Exception as e:
            ResJson = ''
            x = str(e)
            print(x)

            logging.info(x)
            ResJson = {'errorDetails': x}

            return ResJson

Let’s explain the critical snippet from the code.

url = self.url
rapidapi_host = self.rapidapi_host
rapidapi_key = self.rapidapi_key
type = self.type

Ipayload = "{\"search\":\"" + rawQry + "\"}"

jpayload = json.dumps(Ipayload)
payload = json.loads(jpayload)

The first four lines are to receive the parameter values. Our application needs to frame the search query, which is done in the IPayload variable. After that, our app will convert it into a json object type.

headers = {
    'x-rapidapi-host': rapidapi_host,
    'x-rapidapi-key': rapidapi_key,
    'content-type': type,
    'accept': type
    }

response = requests.request("POST", url, data=payload, headers=headers)

Now, the application will prepare the headers & send the request & received the response. Finally, that response will be sent by this script to the main callee application after extracting part of the response & converting that back to JSON are as follows –

response = requests.request("POST", url, data=payload, headers=headers)

ResJson  = response.text

jdata = json.dumps(ResJson)
ResJson = json.loads(jdata)

return ResJson

3. callIndianRailwayAPI.py (This is the main script which invokes the main Indian Railway API & tries to get the response between two railway stations. Hence, the name comes into the picture.)

  1
  2
  3
  4
  5
  6
  7
  8
  9
 10
 11
 12
 13
 14
 15
 16
 17
 18
 19
 20
 21
 22
 23
 24
 25
 26
 27
 28
 29
 30
 31
 32
 33
 34
 35
 36
 37
 38
 39
 40
 41
 42
 43
 44
 45
 46
 47
 48
 49
 50
 51
 52
 53
 54
 55
 56
 57
 58
 59
 60
 61
 62
 63
 64
 65
 66
 67
 68
 69
 70
 71
 72
 73
 74
 75
 76
 77
 78
 79
 80
 81
 82
 83
 84
 85
 86
 87
 88
 89
 90
 91
 92
 93
 94
 95
 96
 97
 98
 99
100
101
102
103
104
105
106
107
108
109
110
111
112
113
114
115
116
117
118
119
120
121
122
123
124
125
126
127
128
129
130
131
132
133
134
135
136
137
138
139
140
141
142
143
144
145
146
147
148
149
150
151
152
153
154
155
156
157
158
159
160
161
162
163
164
165
166
167
168
169
170
171
172
173
174
175
176
177
178
179
180
181
182
183
184
185
186
187
188
189
190
191
192
193
194
195
196
197
198
199
200
201
202
203
204
205
206
207
208
209
210
211
212
213
214
215
216
217
218
##############################################
#### Written By: SATYAKI DE               ####
#### Written On: 20-Dec-2019              ####
#### Modified On 20-Dec-2019              ####
####                                      ####
#### Objective: Main calling scripts.     ####
##############################################

from clsConfig import clsConfig as cf
import pandas as p
import clsL as cl
import logging
import datetime
import json
import clsIndianRailway as ct
import re
import numpy as np

# Disbling Warning
def warn(*args, **kwargs):
    pass

import warnings
warnings.warn = warn

# Lookup functions from
# Azure cloud SQL DB

var = datetime.datetime.now().strftime("%Y-%m-%d_%H-%M-%S")

def getArriveTimeOnly(row):
    try:
        # Using regular expression to fetch time part only

        lkp_arriveTime = str(row['arriveTime'])

        str_arr_time, remain = lkp_arriveTime.split('+')

        return str_arr_time

    except Exception as e:
        x = str(e)
        str_arr_time = ''

        return str_arr_time

def getArriveDateDiff(row):
    try:
        # Using regular expression to fetch time part only

        lkp_arriveTime = str(row['arriveTime'])

        first_half, str_date_diff_init = lkp_arriveTime.split('+')

        # Replacing the text part from it & only capturing the integer part
        str_date_diff = int(re.sub(r"[a-z]","",str_date_diff_init, flags=re.I))

        return str_date_diff

    except Exception as e:
        x = str(e)
        str_date_diff = 0

        return str_date_diff

def getArriveTimeDiff(row):
    try:
        # Using regular expression to fetch time part only

        lkp_arriveTimeM = str(row['arriveTimeM'])

        str_time_diff_init = int(re.sub(r'[^\w\s]', '', lkp_arriveTimeM))

        # Replacing the text part from it & only capturing the integer part
        str_time_diff = (2400 - str_time_diff_init)

        return str_time_diff

    except Exception as e:
        x = str(e)
        str_time_diff = 0

        return str_time_diff

def main():
    try:
        dfSrc = p.DataFrame()
        df_ret = p.DataFrame()
        ret_2 = ''
        debug_ind = 'Y'
        col_list = cf.config['COL_LIST']

        general_log_path = str(cf.config['LOG_PATH'])

        # Enabling Logging Info
        logging.basicConfig(filename=general_log_path + 'consolidatedIR.log', level=logging.INFO)

        # Initiating Log Class
        l = cl.clsL()

        # Moving previous day log files to archive directory
        arch_dir = cf.config['ARCH_DIR']
        log_dir = cf.config['LOG_PATH']

        tmpR0 = "*" * 157

        logging.info(tmpR0)
        tmpR9 = 'Start Time: ' + str(var)
        logging.info(tmpR9)
        logging.info(tmpR0)

        print("Archive Directory:: ", arch_dir)
        print("Log Directory::", log_dir)
        tmpR1 = 'Log Directory::' + log_dir
        logging.info(tmpR1)

        # Query using parameters
        rawQry = str(input('Please enter the name of the train service that you want to find out (Either by Name or by Number): '))

        x1 = ct.clsIndianRailway()
        ret_2 = x1.searchQry(rawQry)

        # Capturing the JSON Payload
        res = json.loads(ret_2)

        # Converting dictionary to Pandas Dataframe
        # df_ret = p.read_json(ret_2, orient='records')

        df_ret = p.io.json.json_normalize(res)
        df_ret.columns = df_ret.columns.map(lambda x: x.split(".")[-1])

        # Resetting the column orders as per JSON
        # df_ret = df_ret[list(res[0].keys())]
        column_order = col_list
        df_mod_ret = df_ret.reindex(column_order, axis=1)

        # Sorting the source data for better viewing
        df_mod_resp = df_mod_ret.sort_values(by=['train_from','train_to','train_num'])

        l.logr('1.IndianRailway_' + var + '.csv', debug_ind, df_mod_resp, 'log')

        # Fetching Data for Delhi To Howrah
        df_del_how = df_mod_resp[(df_mod_resp['train_from'] == 'NDLS') & (df_mod_resp['train_to'] == 'HWH')]

        l.logr('2.IndianRailway_Delhi2Howrah_' + var + '.csv', debug_ind, df_del_how, 'log')

        # Splitting Arrive time into two separate fields for better calculation
        df_del_how['arriveTimeM'] = df_del_how.apply(lambda row: getArriveTimeOnly(row), axis=1)
        df_del_how['arriveTimeDayDiff'] = df_del_how.apply(lambda row: getArriveDateDiff(row), axis=1)
        df_del_how['arriveTimeDiff'] = df_del_how.apply(lambda row: getArriveTimeDiff(row), axis=1)

        l.logr('3.IndianRailway_Del2How_Mod_' + var + '.csv', debug_ind, df_del_how, 'log')

        # To fetch the best route which saves time
        lstTimeDayDiff = df_del_how['arriveTimeDayDiff'].values.tolist()
        min_lstTimeDayDiff = int(min(lstTimeDayDiff))

        df_min_timedaydiff = df_del_how[(df_del_how['arriveTimeDayDiff'] == min_lstTimeDayDiff)]

        l.logr('4.IndianRailway_Del2How_TimeCalc_' + var + '.csv', debug_ind, df_min_timedaydiff, 'log')

        # Now application will check the maximum arrivetimediff, this will bring the record
        # which arrives early at Howrah station
        lstTimeDiff = df_min_timedaydiff['arriveTimeDiff'].values.tolist()
        max_lstTimeDiff = int(max(lstTimeDiff))

        df_best_route = df_min_timedaydiff[(df_min_timedaydiff['arriveTimeDiff'] == max_lstTimeDiff)]

        # Dropping unwanted columns
        df_best_route.drop(columns=['arriveTimeM'], inplace=True)
        df_best_route.drop(columns=['arriveTimeDayDiff'], inplace=True)
        df_best_route.drop(columns=['arriveTimeDiff'], inplace=True)

        l.logr('5.IndianRailway_Del2How_BestRoute_' + var + '.csv', debug_ind, df_best_route, 'log')

        print("-" * 60)

        print('Realtime Indian Railway Data:: ')
        logging.info('Realtime Indian Railway Data:: ')
        print(df_mod_resp)
        print()
        print('Best Route from Delhi -> Howrah:: ')
        print(df_best_route)
        print()

        # Checking execution status
        ret_val_2 = df_best_route.shape[0]

        if ret_val_2 == 0:
            print("Indian Railway hasn't returned any rows. Please check your queries!")
            logging.info("Indian Railway hasn't returned any rows. Please check your queries!")
            print("*" * 157)
            logging.info(tmpR0)
        else:
            print("Successfuly row feteched!")
            logging.info("Successfuly row feteched!")
            print("*" * 157)
            logging.info(tmpR0)

        print('Finding Story points..')
        print("*" * 157)
        logging.info('Finding Story points..')
        logging.info(tmpR0)


        tmpR10 = 'End Time: ' + str(var)
        logging.info(tmpR10)
        logging.info(tmpR0)

    except ValueError:
        print("No relevant data to proceed!")
        logging.info("No relevant data to proceed!")

    except Exception as e:
        print("Top level Error: args:{0}, message{1}".format(e.args, e.message))

if __name__ == "__main__":
    main()

Key snippet to explore –

# Query using parameters
rawQry = str(input('Please enter the name of the train service that you want to find out (Either by Name or by Number): '))

In this case, we make it interactive mode. However, in the actual scenario, you would receive these values from your mobile application.

x1 = ct.clsIndianRailway()
ret_2 = x1.searchQry(rawQry)

# Capturing the JSON Payload
res = json.loads(ret_2)

The above four lines initially invoke the API & receive the JSON response.

# Converting dictionary to Pandas Dataframe
df_ret = p.io.json.json_normalize(res)
df_ret.columns = df_ret.columns.map(lambda x: x.split(".")[-1])

# Resetting the column orders as per JSON
column_order = col_list
df_mod_ret = df_ret.reindex(column_order, axis=1)

# Sorting the source data for better viewing
df_mod_resp = df_mod_ret.sort_values(by=['train_from','train_to','train_num'])

In these last five lines, our application will convert the JSON & serialize it into pandas dataframe, which is sorted after that.

The result will look like this –

SerializeJson2PandasDF

This is exceptionally critical, as this will allow you to achieve your target. Without flattening the data, you won’t get to your goal.

# Fetching Data for Delhi To Howrah
df_del_how = df_mod_resp[(df_mod_resp['train_from'] == 'NDLS') & (df_mod_resp['train_to'] == 'HWH')]

As the line suggested, our application will pick-up only those records between New Delhi & Howrah. Thus, we’ve used our filter to eliminate additional records. And, the data will look like this –

SilteredRecords

Now, we need to identify the minimum time taken by anyone of the two records. For that, we’ll be doing some calculations to fetch the minimum time taken by the application.

# Splitting Arrive time into two separate fields for better calculation
df_del_how['arriveTimeM'] = df_del_how.apply(lambda row: getArriveTimeOnly(row), axis=1)
df_del_how['arriveTimeDayDiff'] = df_del_how.apply(lambda row: getArriveDateDiff(row), axis=1)
df_del_how['arriveTimeDiff'] = df_del_how.apply(lambda row: getArriveTimeDiff(row), axis=1)

To do that, we’ll be generating a couple of derived columns (shown above), which we’ll be using the fetch the shortest duration. And, the data should look like this –

CalculatedFields

These are the two fields, which we’re using for our calculation. First, we’re splitting arriveTime into two separate columns i.e. arriveTimeM & arriveTimeDayDiff. However, arriveTimeDiff is a calculated field.

So, our logic to find the best routes –

  • arriveTimeDayDiff = Take the minimum of the records. If you have multiple candidates, then we’ll pick all of them. In this case, we’ll get two records.
  • ArrivalDiff = (24:00 – <Train’s Arrival Time>), then take the maximum of the value

Note that, in this case, we haven’t considered the departure time. You can add that logic to improvise & correct your prediction.

The above steps can be seen in the following snippet –

# To fetch the best route which saves time
lstTimeDayDiff = df_del_how['arriveTimeDayDiff'].values.tolist()
min_lstTimeDayDiff = int(min(lstTimeDayDiff))

df_min_timedaydiff = df_del_how[(df_del_how['arriveTimeDayDiff'] == min_lstTimeDayDiff)]

l.logr('4.IndianRailway_Del2How_TimeCalc_' + var + '.csv', debug_ind, df_min_timedaydiff, 'log')

# Now application will check the maximum arrivetimediff, this will bring the record
# which arrives early at Howrah station
lstTimeDiff = df_min_timedaydiff['arriveTimeDiff'].values.tolist()
max_lstTimeDiff = int(max(lstTimeDiff))

df_best_route = df_min_timedaydiff[(df_min_timedaydiff['arriveTimeDiff'] == max_lstTimeDiff)]

Let’s see how it runs –

Output

As you can see that NDLS (New Delhi), we’ve three records marked in the GREEN square box. However, as destination HWH (Howrah), we’ve only two records marked in the RED square box. However, as part of our calculation, we’ll pick the record marked with the BLUE square box.

Let’s see how the log directory generates all the files –

Log_Dir

Let’s see the final output in our csv file –

BestRoute

So, finally, we’ve achieved it. 😀

Let me know – how do you like this post. Please share your suggestion & comments.

I’ll be back with another installment from the Python verse.

Till then – Happy Avenging!

Note: All the data posted here are representational data & available over the internet & for educational purpose only.

Explaining new Python library

Hi Guys!

Here is the post as to how to call this Dnpr library & what are the current limitations of this library.

Before we start let’s post the calling script & then explain how we can use them –

##############################################
#### Written By: SATYAKI DE               ####
#### Written On: 08-Sep-2019              ####
####                                      ####
#### Objective: Main calling scripts.     ####
##############################################

from dnpr.clsDnpr import clsDnpr
import datetime as dt
import json

# Disbling Warning
def warn(*args, **kwargs):
    pass

import warnings
warnings.warn = warn

# Lookup functions from


def main():
    try:
        srcJson = [
                    {"FirstName": "Satyaki", "LastName": "De", "Sal": 1000},
                    {"FirstName": "Satyaki", "LastName": "De", "Sal": 1000},
                    {"FirstName": "Archi", "LastName": "Bose", "Sal": 500},
                    {"FirstName": "Archi", "LastName": "Bose", "Sal": 7000},
                    {"FirstName": "Deb", "LastName": "Sen", "Sal": 9500}
                  ]

        print("=" * 157)
        print("Checking distinct function!")
        print("=" * 157)
        print()

        print("*" * 157)
        print("Input Data: ")
        srcJsonFormat = json.dumps(srcJson, indent=1)
        print(str(srcJsonFormat))
        print("*" * 157)

        # Initializing the class
        t = clsDnpr()

        print("1. Checking distinct functionality!")

        var1 = dt.datetime.now().strftime("%Y-%m-%d %H-%M-%S")
        print("Start Time: ", str(var1))

        # Invoking the distinct function
        tarJson = t.distinct(srcJson)

        print("*" * 157)
        print("Output Data: ")
        tarJsonFormat = json.dumps(tarJson, indent=1)
        print(str(tarJsonFormat))
        print("*" * 157)

        if not tarJson:
            print()
            print("No relevant output data!")
            print("*" * 157)
        else:
            print()
            print("Relevant output data comes!")
            print("*" * 157)

        var2 = dt.datetime.now().strftime("%Y-%m-%d %H-%M-%S")
        print("End Time: ", str(var2))

        print("=" * 157)
        print("End of distinct function!")
        print("=" * 157)

        print("2. Checking nvl functionality!")

        srcJson_1 = [
            {"FirstName": "Satyaki", "LastName": "", "Sal": 1000},
            {"FirstName": "Archi", "LastName": "Bose", "Sal": 500},
            {"FirstName": "Deb", "LastName": "", "Sal": 9500}
        ]

        var3 = dt.datetime.now().strftime("%Y-%m-%d %H-%M-%S")
        print("Start Time: ", str(var3))

        strDef = 'FNU'
        print("Default Value: ", strDef)
        srcColName = 'LastName'
        print('Candidate Column for NVL: ', srcColName)

        # Invoking the nvl function
        tarJson_1 = t.nvl(srcJson_1, srcColName, strDef)

        print("*" * 157)
        print("Output Data: ")
        tarJsonFormat_1 = json.dumps(tarJson_1, indent=1)
        print(str(tarJsonFormat_1))
        print("*" * 157)

        if not tarJson_1:
            print()
            print("No relevant output data!")
            print("*" * 157)
        else:
            print()
            print("Relevant output data comes!")
            print("*" * 157)

        var4 = dt.datetime.now().strftime("%Y-%m-%d %H-%M-%S")
        print("End Time: ", str(var4))

        print("=" * 157)
        print("End of nvl function!")
        print("=" * 157)

        print("3. Checking partition-by functionality!")

        srcJson_2 = [
            {"FirstName": "Satyaki", "LastName": "", "Sal": 1000},
            {"FirstName": "Satyaki", "LastName": "", "Sal": 700},
            {"FirstName": "Archi", "LastName": "Bose", "Sal": 500},
            {"FirstName": "Deb", "LastName": "", "Sal": 9500},
            {"FirstName": "Archi", "LastName": "Bose", "Sal": 4500},
        ]

        var5 = dt.datetime.now().strftime("%Y-%m-%d %H-%M-%S")
        print("Start Time: ", str(var5))

        GrList = ['FirstName', 'LastName']
        print("Partition By Columns::: ", str(GrList))
        grOperation = 'Max'
        print('Operation toe be performed: ', grOperation)
        strCandidateColumnName = 'Sal'
        print('Column Name on which the aggregate function will take place: ', strCandidateColumnName)

        # Invoking the partition by function - MAX
        tarJson_1 = t.partitionBy(srcJson_2, GrList, grOperation, strCandidateColumnName)

        print("*" * 157)
        print("Output Data: ")
        tarJsonFormat_1 = json.dumps(tarJson_1, indent=1)
        print(str(tarJsonFormat_1))
        print("*" * 157)

        if not tarJson_1:
            print()
            print("No relevant output data!")
            print("*" * 157)
        else:
            print()
            print("Relevant output data comes!")
            print("*" * 157)

        var6 = dt.datetime.now().strftime("%Y-%m-%d %H-%M-%S")
        print("End Time: ", str(var6))

        var7 = dt.datetime.now().strftime("%Y-%m-%d %H-%M-%S")
        print("Start Time: ", str(var7))

        grOperation_1 = 'Min'
        print('Operation toe be performed: ', grOperation_1)

        # Invoking the Partition By function - MIN
        tarJson_2 = t.partitionBy(srcJson_2, GrList, grOperation_1, strCandidateColumnName)

        print("*" * 157)
        print("Output Data: ")
        tarJsonFormat_2 = json.dumps(tarJson_2, indent=1)
        print(str(tarJsonFormat_2))
        print("*" * 157)

        if not tarJson_2:
            print()
            print("No relevant output data!")
            print("*" * 157)
        else:
            print()
            print("Relevant output data comes!")
            print("*" * 157)

        var8 = dt.datetime.now().strftime("%Y-%m-%d %H-%M-%S")
        print("End Time: ", str(var8))

        var9 = dt.datetime.now().strftime("%Y-%m-%d %H-%M-%S")
        print("Start Time: ", str(var9))

        grOperation_2 = 'Avg'
        print('Operation toe be performed: ', grOperation_2)

        # Invoking the Partition By function - Avg
        tarJson_3 = t.partitionBy(srcJson_2, GrList, grOperation_2, strCandidateColumnName)

        print("*" * 157)
        print("Output Data: ")
        tarJsonFormat_3 = json.dumps(tarJson_3, indent=1)
        print(str(tarJsonFormat_3))
        print("*" * 157)

        if not tarJson_3:
            print()
            print("No relevant output data!")
            print("*" * 157)
        else:
            print()
            print("Relevant output data comes!")
            print("*" * 157)

        var10 = dt.datetime.now().strftime("%Y-%m-%d %H-%M-%S")
        print("End Time: ", str(var10))

        var11 = dt.datetime.now().strftime("%Y-%m-%d %H-%M-%S")
        print("Start Time: ", str(var11))

        grOperation_3 = 'Sum'
        print('Operation toe be performed: ', grOperation_3)

        # Invoking the Partition By function - Sum
        tarJson_4 = t.partitionBy(srcJson_2, GrList, grOperation_3, strCandidateColumnName)

        print("*" * 157)
        print("Output Data: ")
        tarJsonFormat_4 = json.dumps(tarJson_4, indent=1)
        print(str(tarJsonFormat_4))
        print("*" * 157)

        if not tarJson_4:
            print()
            print("No relevant output data!")
            print("*" * 157)
        else:
            print()
            print("Relevant output data comes!")
            print("*" * 157)

        var12 = dt.datetime.now().strftime("%Y-%m-%d %H-%M-%S")
        print("End Time: ", str(var12))

        print("=" * 157)
        print("End of partition function!")
        print("=" * 157)

        print("4. Checking regular expression functionality!")
        print()

        var13 = dt.datetime.now().strftime("%Y-%m-%d %H-%M-%S")
        print("Start Time: ", str(var13))

        print('::Function Regex_Like:: ')
        print()

        tarColumn = 'FirstName'
        print('Target Column for Rexex_Like: ', tarColumn)
        inpPattern = r"\bSa"
        print('Input Pattern: ', str(inpPattern))

        # Invoking the regex_like function
        tarJson = t.regex_like(srcJson, tarColumn, inpPattern)

        print('End of Function Regex_Like!')
        print()

        print("*" * 157)
        print("Output Data: ")
        tarJsonFormat = json.dumps(tarJson, indent=1)
        print(str(tarJsonFormat))
        print("*" * 157)

        if not tarJson:
            print()
            print("No relevant output data!")
            print("*" * 157)
        else:
            print()
            print("Relevant output data comes!")
            print("*" * 157)

        var14 = dt.datetime.now().strftime("%Y-%m-%d %H-%M-%S")
        print("End Time: ", str(var14))

        var15 = dt.datetime.now().strftime("%Y-%m-%d %H-%M-%S")
        print("Start Time: ", str(var15))

        print('::Function Regex_Replace:: ')
        print()

        tarColumn = 'FirstName'
        print('Target Column for Rexex_Replace: ', tarColumn)
        inpPattern = r"\bSa"
        print('Input Pattern: ', str(inpPattern))
        replaceString = 'Ka'
        print('Replacing Character: ', replaceString)

        # Invoking the regex_replace function
        tarJson = t.regex_replace(srcJson, tarColumn, inpPattern, replaceString)

        print('End of Function Rexex_Replace!')
        print()

        print("*" * 157)
        print("Output Data: ")
        tarJsonFormat = json.dumps(tarJson, indent=1)
        print(str(tarJsonFormat))
        print("*" * 157)

        if not tarJson:
            print()
            print("No relevant output data!")
            print("*" * 157)
        else:
            print()
            print("Relevant output data comes!")
            print("*" * 157)

        var16 = dt.datetime.now().strftime("%Y-%m-%d %H-%M-%S")
        print("End Time: ", str(var16)) 

        var17 = dt.datetime.now().strftime("%Y-%m-%d %H-%M-%S")
        print("Start Time: ", str(var17))

        print('::Function Regex_Substr:: ')
        print()

        tarColumn = 'FirstName'
        print('Target Column for Regex_Substr: ', tarColumn)
        inpPattern = r"\bSa"
        print('Input Pattern: ', str(inpPattern))

        # Invoking the regex_substr function
        tarJson = t.regex_substr(srcJson, tarColumn, inpPattern)

        print('End of Function Regex_Substr!')
        print()

        print("*" * 157)
        print("Output Data: ")
        tarJsonFormat = json.dumps(tarJson, indent=1)
        print(str(tarJsonFormat))
        print("*" * 157)

        if not tarJson:
            print()
            print("No relevant output data!")
            print("*" * 157)
        else:
            print()
            print("Relevant output data comes!")
            print("*" * 157)

        var18 = dt.datetime.now().strftime("%Y-%m-%d %H-%M-%S")
        print("End Time: ", str(var18))

        print("=" * 157)
        print("End of regular expression function!")
        print("=" * 157)


    except ValueError:
        print("No relevant data to proceed!")

    except Exception as e:
        print("Top level Error: args:{0}, message{1}".format(e.args, e.message))

if __name__ == "__main__":
    main()

Let’s explain the key lines –

As of now, the source payload that it will support is mostly simple JSON.

As you can see, we’ve relatively started with the simple JSON containing an array of elements.

# Initializing the class
t = clsDnpr()

In this line, you can initiate the main library.

Let’s explore the different functions, which you can use on JSON.

1. Distinct:

Let’s discuss the distinct function on  JSON. This function can be extremely useful if you use NoSQL, which doesn’t offer any distinct features. Or, if you are dealing with or expecting your source with duplicate JSON inputs.

Let’s check our sample payload for distinct –

Sample_Payload_Distinct

Here is the basic syntax & argument that it is expecting –

distinct(Input Json) returnOutput Json

So, all you have to ensure that you are passing a JSON input string.

As per our example –

# Invoking the distinct function
tarJson = t.distinct(srcJson)

And, here is the output –

Distinct_Output

If you compare the source JSON. You would have noticed that there are two identical entries with the name “Satyaki” is now replaced by one unique entries.

Limitation: Currently, this will support only basic JSON. However, I’m working on it to support that much more complex hierarchical JSON in coming days.

2. NVL:

NVL is another feature that I guess platform like JSON should have. So, I built this library specially handles the NULL data scenario, where the developer may want to pass a default value in place of NULL.

Hence, the implementation of this function.

Here is the sample payload for this –

Sample_Payload_NVL

In this case, if there is some business logic that requires null values replaced with some default value for LastName say e.g. FNU. This function will help you to implement that logic.

Here is the basic syntax & argument that it is expecting –

nvl(
     Input Json, 
     Prospective Null Column Name, 
     Dafult Value in case of Null
   ) return Output Json

And, here is the code implementation –

strDef = ‘FNU’
print(“Default Value: “, strDef)
srcColName = ‘LastName’
print(‘Candidate Column for NVL: ‘, srcColName)

# Invoking the nvl function
tarJson_1 = t.nvl(srcJson_1, srcColName, strDef)

So, in the above lines, this code will replace the Null value with the “FNU” for the column LastName.

And, Here is the output –

NVL_Output

3. Partition_By:

I personally like this function as this gives more power to manipulate any data in JSON levels such as Avg, Min, Max or Sum. This might be very useful in order to implement some basic aggregation on the fly.

Here is the basic syntax & argument that it is expecting –

partition_by(
              Input Json, 
              Group By Column List, 
              Group By Operation, 
              Candidate Column Name, 
              Output Column Name
            ) return Output Json

Now, we would explore the sample payload for all these functions to test –

Sample_payload_PartitionBy

Case 1:

In this case, we’ll calculate the maximum salary against FirstName & LastName. However, I want to print the Location in my final JSON output.

So, if you see the sample data & let’s make it tabular for better understanding –

PartitionMAX_SourceTab

So, as per our business logic, our MAX aggregate would operate only on FirstName & LastName. Hence, the calculation will process accordingly.

In that case, the output will look something like –

PartitionMAX_FinTab

As you can see, from the above picture two things happen. It will remove any duplicate entries. In this case, Satyaki has exactly two identical rows. So, it removes one. However, as part of partition by clause, it keeps two entries of Archi as the location is different. Deb will be appearing once as expected.

Let’s run our application & find out the output –

MAX_PartitionBy

So, we meet our expectation.

Case 2:

Same, logic will be applicable for Min as well.

Hence, as per the table, we should expect the output as –

PartitionMIN_FinTab

And, the output of our application run is –

MIN_PartitionBy

So, this also come as expected.

Case 3:

Let’s check for average –

PartitionAVG_FinTab

The only thing I wanted to point out, as we’ve two separate entries for Satyaki. So, the average will contain the salary from both the value as rightfully so. Hence, the average of (1000+700)/2 = 850.

Let’s run our application –

AVG_PartitionBy

So, we’ve achieved our target.

Case 4:

Let’s check for Sum.

PartitionSUM_FinTab

Now, let’s run our application –

SUM_PartitionBy

In the next installment, we’ll be discussing the last function from this package i.e. Regular Expression in JSON.

I hope, you’ll like this presentation.

Let me know – if you find any special bug. I’ll look into that.

Till then – Happy Avenging!

Note: All the data posted here are representational data & available over the internet & for educational purpose only.

Building an Azure Function using Python (Crossover between Reality Stone & Time Stone in Python Verse)

Hi Guys!

Today, we’ll be discussing a preview features from Microsoft Azure. Building an Azure function using Python on it’s Linux/Ubuntu VM. Since this is a preview feature, we cannot implement this to production till now. However, my example definitely has more detailed steps & complete code guide compared to whatever available over the internet.

In this post, I will take one of my old posts & enhance it as per this post. Hence, I’ll post those modified scripts. However, I won’t discuss the logic in details as most of these scripts have cosmetic changes to cater to this requirement.

In this post, we’ll only show Ubuntu run & there won’t be Windows or MAC comparison.

Initial Environment Preparation:

  1. Set-up new virtual machine on Azure.
  2. Set-up Azure function environments on that server.

Set-up new virtual machine on Azure:

I’m not going into the details of how to create Ubuntu VM on Microsoft Azure. You can refer the steps in more information here.

After successful creation, the VM will look like this –

Azure VM - Ubuntu

Detailed information you can get after clicking this hyperlink over the name of the VM.

Azure-VM Basic Details

You have to open port 7071 for application testing from the local using postman.

You can get it from the network option under VM as follows –

Network-Configuration

Make sure that you are restricting these ports to specific network & not open to ALL traffic.

So, your VM is ready now.

To update Azure CLI, you need to use the following commands –

sudo apt-get update && sudo apt-get install –only-upgrade -y azure-cli

Set-up Azure function environments on that server:

To set-up the environment, you don’t have to go for Python installation as by default Ubuntu in Microsoft Azure comes up with desired Python version, i.e., Python3.6. However, to run the python application, you need to install the following app –

  1. Microsoft SDK. You will get the details from this link.
  2. Installing node-js. You will get the details from this link.
  3. You need to install a docker. However, as per Microsoft official version, this is not required. But, you can create a Docker container to distribute the python function in Azure application. I would say you can install this just in case if you want to continue with this approach. You will get the details over here. If you want to know details about the Docker. And, how you want to integrate python application. You can refer to this link.
  4. Your desired python packages. In this case, we’ll be modifying this post – “Encryption/Decryption, JSON, API, Flask Framework in Python (Crossover between Reality Stone & Time Stone in Python Verse).” We’ll be modifying a couple of lines only to cater to this functionality & deploying the same as an Azure function.
  5. Creating an Azure function template on Ubuntu. The essential detail you’ll get it from here. However, over there, it was not shown in detailed steps of python packages & how you can add all the dependencies to publish it in details. It was an excellent post to start-up your knowledge.

Let’s see these components status & very brief details –

Microsoft SDK:

To check the dot net version. You need to type the following commands in Ubuntu –

dotnet –info

And, the output will look like this –

DotNet-Version

Node-Js:

Following is the way to verify your node-js version & details –

node -v

npm -v

And, the output looks like this –

Node-Js

Docker:

Following is the way to test your docker version –

docker -v

And, the output will look like this –

Docker-Version

Python Packages:

Following are the python packages that we need to run & publish that in Azure cloud as an Azure function –

pip freeze | grep -v “pkg-resources” > requirements.txt

And, the output is –

Requirements

You must be wondered that why have I used this grep commands here. I’ve witnessed that on many occassion in Microsoft Azure’s Linux VM it produces one broken package called resource=0.0.0, which will terminate the deployment process. Hence, this is very crucial to eliminate those broken packages.

Now, we’re ready for our python scripts. But, before that, let’s see the directory structure over here –

Win_Vs_Ubuntu-Cloud

Creating an Azure Function Template on Ubuntu: 

Before we post our python scripts, we’ll create these following components, which is essential for our Python-based Azure function –

  • Creating a group:

              Creating a group either through Azure CLI or using a docker, you can proceed. The commands for Azure CLI is as follows –

az group create –name “rndWestUSGrp” –location westus

It is advisable to use double quotes for parameters value. Otherwise, you might land-up getting the following error – “Error: “resourceGroupName” should satisfy the constraint – “Pattern”: /^[-w._]+$/“.

I’m sure. You don’t want to face that again. And, here is the output –

CreateDeploymentGroup

Note that, here I haven’t used the double-quotes. But, to avoid any unforeseen issues – you should use double-quotes. You can refer the docker command from the above link, which I’ve shared earlier.

Now, you need to create one storage account where the metadata information of your function will be stored. You will create that as follows –

az storage account create –name cryptpy2019 –location westus –resource-group rndWestUSGrp –sku Standard_LRS

And, the output will look like this –

AccountCreate_1

Great. Now, we’ll create a virtual environment for Python3.6.

python3.6 -m venv .env
source .env/bin/activate

Python-VM

Now, we’ll create a local function project.

func init encPro

And, the output you will get is as follows –

Local-Function

Inside this directory, you’ll see the following files –

Local-Function-Details

You need to edit the host.json with these default lines –

{
 “version”: “2.0”,
 “extensionBundle”: {
                                       “id”: “Microsoft.Azure.Functions.ExtensionBundle”,
                                       “version”: “[1.*, 2.0.0)”
                                     }
}

And, the final content of these two files (excluding the requirements.txt) will look like this –

Configuration

Finally, we’ll create the template function by this following command –

func new

This will follow with steps finish it. You need to choose Python as your programing language. You need to choose an HTTP trigger template. Once you created that successfully, you’ll see the following files –

func_New

Note that, our initial function name is -> getVal.

By default, Azure will generate some default code inside the __init__.py. The details of those two files can be found here.

Since we’re ready with our environment setup. We can now discuss our Python scripts –

1. clsConfigServer.py (This script contains all the parameters of the server.)

###########################################
#### Written By: SATYAKI DE        ########
#### Written On: 10-Feb-2019       ########
####                               ########
#### Objective: Parameter File     ########
###########################################

import os
import platform as pl

# Checking with O/S system
os_det = pl.system()

class clsConfigServer(object):
    Curr_Path = os.path.dirname(os.path.realpath(__file__))

    if os_det == "Windows":
        config = {
            'FILE': 'acct_addr_20180112.csv',
            'SRC_FILE_PATH': Curr_Path + '\\' + 'src_file\\',
            'PROFILE_FILE_PATH': Curr_Path + '\\' + 'profile\\',
            'HOST_IP_ADDR': '0.0.0.0',
            'DEF_SALT': 'iooquzKtqLwUwXG3rModqj_fIl409vemWg9PekcKh2o=',
            'ACCT_NBR_SALT': 'iooquzKtqLwUwXG3rModqj_fIlpp1vemWg9PekcKh2o=',
            'NAME_SALT': 'iooquzKtqLwUwXG3rModqj_fIlpp1026Wg9PekcKh2o=',
            'PHONE_SALT': 'iooquzKtqLwUwXG3rMM0F5_fIlpp1026Wg9PekcKh2o=',
            'EMAIL_SALT': 'iooquzKtqLwU0653rMM0F5_fIlpp1026Wg9PekcKh2o='
        }
    else:
        config = {
            'FILE': 'acct_addr_20180112.csv',
            'SRC_FILE_PATH': Curr_Path + '/' + 'src_file/',
            'PROFILE_FILE_PATH': Curr_Path + '/' + 'profile/',
            'HOST_IP_ADDR': '0.0.0.0',
            'DEF_SALT': 'iooquzKtqLwUwXG3rModqj_fIl409vemWg9PekcKh2o=',
            'ACCT_NBR_SALT': 'iooquzKtqLwUwXG3rModqj_fIlpp1vemWg9PekcKh2o=',
            'NAME_SALT': 'iooquzKtqLwUwXG3rModqj_fIlpp1026Wg9PekcKh2o=',
            'PHONE_SALT': 'iooquzKtqLwUwXG3rMM0F5_fIlpp1026Wg9PekcKh2o=',
            'EMAIL_SALT': 'iooquzKtqLwU0653rMM0F5_fIlpp1026Wg9PekcKh2o='
        }

2. clsEnDec.py (This script is a lighter version of encryption & decryption of our previously discussed scenario. Hence, we won’t discuss in details. You can refer my earlier post to understand the logic of this script.)

###########################################
#### Written By: SATYAKI DE        ########
#### Written On: 25-Jan-2019       ########
#### Package Cryptography needs to ########
#### install in order to run this  ########
#### script.                       ########
####                               ########
#### Objective: This script will   ########
#### encrypt/decrypt based on the  ########
#### hidden supplied salt value.   ########
###########################################

from cryptography.fernet import Fernet
import logging

from getVal.clsConfigServer import clsConfigServer as csf

class clsEnDec(object):

    def __init__(self):
        # Calculating Key
        self.token = str(csf.config['DEF_SALT'])

    def encrypt_str(self, data, token):
        try:
            # Capturing the Salt Information
            t1 = self.token
            t2 = token

            if t2 == '':
                salt = t1
            else:
                salt = t2

            logging.info("Encrypting the value!")

            # Checking Individual Types inside the Dataframe
            cipher = Fernet(salt)
            encr_val = str(cipher.encrypt(bytes(data,'utf8'))).replace("b'","").replace("'","")

            strV1 = "Encrypted value:: " + str(encr_val)
            logging.info(strV1)

            return encr_val

        except Exception as e:
            x = str(e)
            print(x)
            encr_val = ''

            return encr_val

    def decrypt_str(self, data, token):
        try:
            # Capturing the Salt Information
            t1 = self.token
            t2 = token

            if t2 == '':
                salt = t1
            else:
                salt = t2

            logging.info("Decrypting the value!")

            # Checking Individual Types inside the Dataframe
            cipher = Fernet(salt)
            decr_val = str(cipher.decrypt(bytes(data,'utf8'))).replace("b'","").replace("'","")

            strV2 = "Decrypted value:: " + str(decr_val)
            logging.info(strV2)

            return decr_val

        except Exception as e:
            x = str(e)
            print(x)
            decr_val = ''

            return decr_val

3. clsFlask.py (This is the main server script that will the encrypt/decrypt class from our previous scenario. This script will capture the requested JSON from the client, who posted from the clients like another python script or third-party tools like Postman.)

###########################################
#### Written By: SATYAKI DE            ####
#### Written On: 25-Jan-2019           ####
#### Package Flask package needs to    ####
#### install in order to run this      ####
#### script.                           ####
####                                   ####
#### Objective: This script will       ####
#### encrypt/decrypt based on the      ####
#### supplied salt value. Also,        ####
#### this will capture the individual  ####
#### element & stored them into JSON   ####
#### variables using flask framework.  ####
###########################################

from getVal.clsConfigServer import clsConfigServer as csf
from getVal.clsEnDec import clsEnDecAuth

getVal = clsEnDec()

import logging

class clsFlask(object):
    def __init__(self):
        self.xtoken = str(csf.config['DEF_SALT'])

    def getEncryptProcess(self, dGroup, input_data, dTemplate):
        try:
            # It is sending default salt value
            xtoken = self.xtoken

            # Capturing the individual element
            dGroup = dGroup
            input_data = input_data
            dTemplate = dTemplate

            # This will check the mandatory json elements
            if ((dGroup != '') & (dTemplate != '')):

                # Based on the Group & Element it will fetch the salt
                # Based on the specific salt it will encrypt the data
                if ((dGroup == 'GrDet') & (dTemplate == 'subGrAcct_Nbr')):
                    xtoken = str(csf.config['ACCT_NBR_SALT'])

                    strV1 = "xtoken: " + str(xtoken)
                    logging.info(strV1)
                    strV2 = "Flask Input Data: " + str(input_data)
                    logging.info(strV2)

                    #x = cen.clsEnDecAuth()
                    ret_val = getVal.encrypt_str(input_data, xtoken)
                elif ((dGroup == 'GrDet') & (dTemplate == 'subGrName')):
                    xtoken = str(csf.config['NAME_SALT'])

                    strV1 = "xtoken: " + str(xtoken)
                    logging.info(strV1)
                    strV2 = "Flask Input Data: " + str(input_data)
                    logging.info(strV2)

                    #x = cen.clsEnDecAuth()
                    ret_val = getVal.encrypt_str(input_data, xtoken)
                elif ((dGroup == 'GrDet') & (dTemplate == 'subGrPhone')):
                    xtoken = str(csf.config['PHONE_SALT'])

                    strV1 = "xtoken: " + str(xtoken)
                    logging.info(strV1)
                    strV2 = "Flask Input Data: " + str(input_data)
                    logging.info(strV2)

                    #x = cen.clsEnDecAuth()
                    ret_val = getVal.encrypt_str(input_data, xtoken)
                elif ((dGroup == 'GrDet') & (dTemplate == 'subGrEmail')):
                    xtoken = str(csf.config['EMAIL_SALT'])

                    strV1 = "xtoken: " + str(xtoken)
                    logging.info(strV1)
                    strV2 = "Flask Input Data: " + str(input_data)
                    logging.info(strV2)

                    #x = cen.clsEnDecAuth()
                    ret_val = getVal.encrypt_str(input_data, xtoken)
                else:
                    ret_val = ''
            else:
                ret_val = ''

            # Return value
            return ret_val

        except Exception as e:
            ret_val = ''
            # Return the valid json Error Response
            return ret_val

    def getDecryptProcess(self, dGroup, input_data, dTemplate):
        try:
            xtoken = self.xtoken

            # Capturing the individual element
            dGroup = dGroup
            input_data = input_data
            dTemplate = dTemplate

            # This will check the mandatory json elements
            if ((dGroup != '') & (dTemplate != '')):

                # Based on the Group & Element it will fetch the salt
                # Based on the specific salt it will decrypt the data
                if ((dGroup == 'GrDet') & (dTemplate == 'subGrAcct_Nbr')):
                    xtoken = str(csf.config['ACCT_NBR_SALT'])

                    strV1 = "xtoken: " + str(xtoken)
                    logging.info(strV1)
                    strV2 = "Flask Input Data: " + str(input_data)
                    logging.info(strV2)

                    #x = cen.clsEnDecAuth()
                    ret_val = getVal.decrypt_str(input_data, xtoken)
                elif ((dGroup == 'GrDet') & (dTemplate == 'subGrName')):
                    xtoken = str(csf.config['NAME_SALT'])

                    strV1 = "xtoken: " + str(xtoken)
                    logging.info(strV1)
                    strV2 = "Flask Input Data: " + str(input_data)
                    logging.info(strV2)

                    #x = cen.clsEnDecAuth()
                    ret_val = getVal.decrypt_str(input_data, xtoken)
                elif ((dGroup == 'GrDet') & (dTemplate == 'subGrPhone')):
                    xtoken = str(csf.config['PHONE_SALT'])

                    strV1 = "xtoken: " + str(xtoken)
                    logging.info(strV1)
                    strV2 = "Flask Input Data: " + str(input_data)
                    logging.info(strV2)

                    #x = cen.clsEnDecAuth()
                    ret_val = getVal.decrypt_str(input_data, xtoken)
                elif ((dGroup == 'GrDet') & (dTemplate == 'subGrEmail')):
                    xtoken = str(csf.config['EMAIL_SALT'])

                    strV1 = "xtoken: " + str(xtoken)
                    logging.info(strV1)
                    strV2 = "Flask Input Data: " + str(input_data)
                    logging.info(strV2)

                    #x = cen.clsEnDecAuth()
                    ret_val = getVal.decrypt_str(input_data, xtoken)
                else:
                    ret_val = ''
            else:
                ret_val = ''

            # Return value
            return ret_val

        except Exception as e:
            ret_val = ''
            # Return the valid Error Response
            return ret_val

4. __init__.py (This autogenerated script contains the primary calling methods of encryption & decryption based on the element header & values after enhanced as per the functionality.)

###########################################
#### Written By: SATYAKI DE            ####
#### Written On: 08-Jun-2019           ####
#### Package Flask package needs to    ####
#### install in order to run this      ####
#### script.                           ####
####                                   ####
#### Objective: Main Calling scripts.  ####
#### This is an autogenrate scripts.   ####
#### However, to meet the functionality####
#### we've enhanced as per our logic.  ####
###########################################
__all__ = ['clsFlask']

import logging
import azure.functions as func
import json

from getVal.clsFlask import clsFlask

getVal = clsFlask()

def main(req: func.HttpRequest) -> func.HttpResponse:
    logging.info('Python Encryption function processed a request.')

    str_val = 'Input Payload:: ' + str(req.get_json())
    str_1 = str(req.get_json())

    logging.info(str_val)

    ret_val = {}
    DataIn = ''
    dGroup = ''
    dTemplate = ''
    flg = ''

    if (str_1 != ''):
        try:
            req_body = req.get_json()
            dGroup = req_body.get('dataGroup')

            try:
                DataIn = req_body.get('data')
                strV15 = 'If Part:: ' + str(DataIn)

                logging.info(strV15)

                if ((DataIn == '') | (DataIn == None)):
                    raise ValueError

                flg = 'Y'
            except ValueError:
                DataIn = req_body.get('edata')
                strV15 = 'Else Part:: ' + str(DataIn)
                logging.info(strV15)
                flg = 'N'
            except:
                DataIn = req_body.get('edata')
                strV15 = 'Else Part:: ' + str(DataIn)
                logging.info(strV15)
                flg = 'N'

            dTemplate = req_body.get('dataTemplate')

        except ValueError:
            pass

    strV5 = "Encrypt Decrypt Flag:: " + flg
    logging.info(strV5)

    if (flg == 'Y'):

        if ((DataIn != '') & ((dGroup != '') & (dTemplate != ''))):

            logging.info("Encryption Started!")
            ret_val = getVal.getEncryptProcess(dGroup, DataIn, dTemplate)
            strVal2 = 'Return Payload:: ' + str(ret_val)
            logging.info(strVal2)

            xval = json.dumps(ret_val)

            return func.HttpResponse(xval)
        else:
            return func.HttpResponse(
                 "Please pass a data in the request body",
                 status_code=400
            )
    else:

        if ((DataIn != '') & ((dGroup != '') & (dTemplate != ''))):

            logging.info("Decryption Started!")
            ret_val2 = getVal.getDecryptProcess(dGroup, DataIn, dTemplate)
            strVal3 = 'Return Payload:: ' + str(ret_val)
            logging.info(strVal3)

            xval1 = json.dumps(ret_val2)

            return func.HttpResponse(xval1)
        else:
            return func.HttpResponse(
                "Please pass a data in the request body",
                status_code=400
            )

In this script, based on the value of an flg variable, we’re calling our encryption or decryption methods. And, the value of the flg variable is set based on the following logic –

try:
    DataIn = req_body.get('data')
    strV15 = 'If Part:: ' + str(DataIn)

    logging.info(strV15)

    if ((DataIn == '') | (DataIn == None)):
        raise ValueError

    flg = 'Y'
except ValueError:
    DataIn = req_body.get('edata')
    strV15 = 'Else Part:: ' + str(DataIn)
    logging.info(strV15)
    flg = 'N'
except:
    DataIn = req_body.get('edata')
    strV15 = 'Else Part:: ' + str(DataIn)
    logging.info(strV15)
    flg = 'N'

So, if the application gets the “data” element then – it will consider the data needs to be encrypted; otherwise, it will go for decryption. And, based on that – it is setting the value.

Now, we’re ready to locally run our application –

func host start

And, the output will look like this –

StartingAzureFunction-Python
StartingAzureFunction-Python 2

Let’s test it from postman –

Encrypt:

Postman-Encrypt

Decrypt:

Postman-Decrypt

Great. Now, we’re ready to publish this application to Azure cloud.

As in our earlier steps, we’ve already built our storage account for the metadata. Please scroll to top to view that again. Now, using that information, we’ll make the function app with a more meaningful name –

az functionapp create –resource-group rndWestUSGrp –os-type Linux \
–consumption-plan-location westus –runtime python \
–name getEncryptDecrypt –storage-account cryptpy2019

CreatingFunctionPython

Let’s publish the function –

sudo func azure functionapp publish “getEncryptDecrypt” –build-native-deps

On many occassion, without the use of “–build-native-deps” might leads to failure. Hence, I’ve added that to avoid such scenarios.

Publishing-Function

Now, we need to test our first published complex Azure function with Python through postman –

Encrypt:

PubishedFuncPostmanEncrypt

Decrypt:

PubishedFuncPostmanDecrypt

Wonderful! So, it is working.

You can see the function under the Azure portal –

Deployed-Function

Let’s see some other important features of this function –

Monitor: You can monitor two ways. One is by clicking the monitor options you will get the individual requests level details & also get to see the log information over here –

Function-Monitor-Details-1

Clicking Application Insights will give you another level of detailed logs, which can be very useful for debugging. We’ll touch this at the end of this post with a very brief discussion.

Function-Monitor-Details-3.JPG

As you can see, clicking individual lines will show the details further.

Let’s quickly check the application insights –

Application-Insights-1

Application Insights will give you a SQL like an interface where you can get the log details of all your requests.

Application-Insights-2

You can expand the individual details for further information.

Application-Insights-3

You can change the parameter name & other details & click the run button to get all the log details for your debugging purpose.

So, finally, we’ve achieved our goal. This is relatively long posts. But, I’m sure this will help you to create your first python-based function on the Azure platform.

Hope, you will like this approach. Let me know your comment on the same.

I’ll bring some more exciting topic in the coming days from the Python verse.

Till then, Happy Avenging! 😀

Note: All the data posted here are representational data & available over the internet.

Combining the NoSQL(Cosmos DB) & traditional Azure RDBMS in Azure (Time stone solo from Python verse)

Hi Guys!

Today, our main objective is to extend our last post & blending two different kinds of data using Python.

Please refer the earlier post if you didn’t go through it – “Building Azure cosmos application.“.

What is the Objective?

In this post, our objective is to combine traditional RDBMS from the cloud with Azure’s NO SQL, which is, in this case, is Cosmos DB. And, try to forecast some kind of blended information, which can be aggregated further.

Examining Source Data.

No SQL Data from Cosmos:

Let’s check one more time the No SQL data created in our last post.

CosmosData

Total, we’ve created 6 records in our last post.

As you can see in red marked areas. From item, one can check the total number of records created. You can also filter out specific record using the Edit Filter blue color button highlighted with blue box & you need to provide the “WHERE CLAUSE” inside it.

Azure SQL DB:

Let’s create some data in Azure SQL DB.

But, before that, you need to create SQL DB in the Azure cloud. Here is the official Microsoft link to create DB in Azure. You can refer to it here.

I won’t discuss the detailed steps of creating DB here.

From Azure portal, it looks like –

Azure SQL DB Main Screen

Let’s see how the data looks like in Azure DB. For our case, we’ll be using the hrMaster DB.

Let’s create the table & some sample data aligned as per our cosmos data.

Azure SQL DB

We will join both the data based on subscriberId & then extract our required columns in our final output.

CombinedData

Good. Now, we’re ready for python scripts.

Python Scripts:

In this installment, we’ll be reusing the following python scripts, which is already discussed in my earlier post –

  • clsL.py
  • clsColMgmt.py
  • clsCosmosDBDet.py

So, I’m not going to discuss these scripts.

Before we discuss our scripts, let’s look out the directory structures –

Win_Vs_MAC

Here is the detailed directory structure between the Windows & MAC O/S.

1. clsConfig.py (This script will create the split csv files or final merge file after the corresponding process. However, this can be used as usual verbose debug logging as well. Hence, the name comes into the picture.)

##############################################
#### Written By: SATYAKI DE               ####
#### Written On: 25-May-2019              ####
#### Updated On: 02-Jun-2019              ####
####                                      ####
#### Objective: This script is a config   ####
#### file, contains all the keys for      ####
#### azure cosmos db. Application will    ####
#### process these information & perform  ####
#### various CRUD operation on Cosmos DB. ####
##############################################

import os
import platform as pl

class clsConfig(object):
    Curr_Path = os.path.dirname(os.path.realpath(__file__))
    db_name = 'rnd-de01-usw2-vfa-cdb'
    db_link = 'dbs/' + db_name
    CONTAINER1 = "RealtimeEmail"
    CONTAINER2 = "RealtimeTwitterFeedback"
    CONTAINER3 = "RealtimeHR"

    os_det = pl.system()
    if os_det == "Windows":
        sep = '\\'
    else:
        sep = '/'

    config = {
        'SERVER': 'xxxx-xxx.database.windows.net',
        'DATABASE_1': 'SalesForceMaster',
        'DATABASE_2': 'hrMaster',
        'DATABASE_3': 'statMaster',
        'USERNAME': 'admin_poc_dev',
        'PASSWORD': 'xxxxx',
        'DRIVER': '{ODBC Driver 17 for SQL Server}',
        'ENV': 'pocdev-saty',
        'ENCRYPT_FLAG': "yes",
        'TRUST_FLAG': "no",
        'TIMEOUT_LIMIT': "30",
        'PROCSTAT': "'Y'",
        'APP_ID': 1,
        'EMAIL_SRC_JSON_FILE': Curr_Path + sep + 'src_file' + sep + 'srcEmail.json',
        'TWITTER_SRC_JSON_FILE': Curr_Path + sep + 'src_file' + sep + 'srcTwitter.json',
        'HR_SRC_JSON_FILE': Curr_Path + sep + 'src_file' + sep + 'srcHR.json',
        'COSMOSDB_ENDPOINT': 'https://rnd-de01-usw2-vfa-cdb.documents.azure.com:443/',
        'CONFIG_TABLE': 'ETL_CONFIG_TAB',
        'COSMOS_PRIMARYKEY': "XXXXXXXXXXXXXXXXXXXXXXXXXXXXXXXXXXXXXXXXXXXXXXXXXXXXXXXXXXXXIsI00AxKXXXXXgg==",
        'ARCH_DIR': Curr_Path + sep + 'arch' + sep,
        'COSMOSDB': db_name,
        'COSMOS_CONTAINER1': CONTAINER1,
        'COSMOS_CONTAINER2': CONTAINER2,
        'COSMOS_CONTAINER3': CONTAINER3,
        'CONFIG_ORIG': 'Config_orig.csv',
        'ENCRYPT_CSV': 'Encrypt_Config.csv',
        'DECRYPT_CSV': 'Decrypt_Config.csv',
        'PROFILE_PATH': Curr_Path + sep + 'profile' + sep,
        'LOG_PATH': Curr_Path + sep + 'log' + sep,
        'REPORT_PATH': Curr_Path + sep + 'report',
        'APP_DESC_1': 'Feedback Communication',
        'DEBUG_IND': 'N',
        'INIT_PATH': Curr_Path,
        'SQL_QRY_1': "SELECT c.subscriberId, c.sender, c.orderNo, c.orderDate, c.items.orderQty  FROM RealtimeEmail c",
        'SQL_QRY_2': "SELECT c.twitterId, c.Twit, c.DateCreated, c.Country FROM RealtimeTwitterFeedback c WHERE c.twitterId=@CrVal",
        'DB_QRY': "SELECT * FROM c",
        'AZURE_SQL_1': "SELECT DISTINCT subscriberId, state, country, annualIncome, customerType FROM dbo.onboardCustomer",
        'COLLECTION_QRY': "SELECT * FROM r",
        'database_link': db_link,
        'collection_link_1': db_link + '/colls/' + CONTAINER1,
        'collection_link_2': db_link + '/colls/' + CONTAINER2,
        'collection_link_3': db_link + '/colls/' + CONTAINER3,
        'options': {
            'offerThroughput': 1000,
            'enableCrossPartitionQuery': True,
            'maxItemCount': 2
        }
    }

Here, we’ve added a couple of more entries compared to the last time, which points the detailed configuration for Azure SQL DB.

‘SERVER’: ‘xxxx-xxx.database.windows.net’,
‘DATABASE_1’: ‘SalesForceMaster’,
‘DATABASE_2’: ‘hrMaster’,
‘DATABASE_3’: ‘statMaster’,
‘USERNAME’: ‘admin_poc_dev’,
‘PASSWORD’: ‘xxxxx’,
‘DRIVER’: ‘{ODBC Driver 17 for SQL Server}’,
‘ENV’: ‘pocdev-saty’,
‘ENCRYPT_FLAG’: “yes”,
‘TRUST_FLAG’: “no”,
‘TIMEOUT_LIMIT’: “30”,
‘PROCSTAT’: “‘Y'”, 

Here, you need to supply your DB credentials accordingly.

2. clsDBLookup.py (This script will look into the Azure SQL DB & fetch data from the traditional RDBMS of Azure environment.)

#####################################################
#### Written By: SATYAKI DE                      ####
#### Written On: 25-May-2019                     ####
####                                             ####
#### Objective: This script will check &         ####
#### test the connection with the Azure          ####
#### SQL DB & it will fetch all the records      ####
#### name resied under the same DB of a table.   ####
#####################################################

import pyodbc as py
import pandas as p
from clsConfig import clsConfig as cdc

class clsDBLookup(object):
    def __init__(self, lkpTableName = ''):
        self.server = cdc.config['SERVER']
        self.database = cdc.config['DATABASE_1']
        self.database1 = cdc.config['DATABASE_2']
        self.database2 = cdc.config['DATABASE_3']
        self.username = cdc.config['USERNAME']
        self.password = cdc.config['PASSWORD']
        self.driver = cdc.config['DRIVER']
        self.env = cdc.config['ENV']
        self.encrypt_flg = cdc.config['ENCRYPT_FLAG']
        self.trust_flg = cdc.config['TRUST_FLAG']
        self.timeout_limit = cdc.config['TIMEOUT_LIMIT']
        self.lkpTableName = cdc.config['CONFIG_TABLE']
        self.ProcStat = cdc.config['PROCSTAT']
        self.AppId = cdc.config['APP_ID']

    def LookUpData(self):
        try:
            # Assigning all the required values
            server = self.server
            database = self.database1
            username = self.username
            password = self.password
            driver = self.driver
            env = self.env
            encrypt_flg = self.encrypt_flg
            trust_flg = self.trust_flg
            timout_limit = self.timeout_limit
            lkpTableName = self.lkpTableName
            ProcStat = self.ProcStat
            AppId = self.AppId

            # Creating secure connection
            str_conn = 'Driver=' + driver + ';Server=tcp:' + server + ',1433;' \
                       'Database=' + database + ';Uid=' + username + '@' + env + ';' \
                       'Pwd=' + password + ';Encrypt=' + encrypt_flg + ';' \
                       'TrustServerCertificate=' + trust_flg + ';Connection Timeout=' + timout_limit + ';'

            db_con_azure = py.connect(str_conn)

            query = " SELECT [ruleId] as ruleId, [ruleName] as ruleName, [ruleSQL] as ruleSQL, " \
                    " [ruleFlag] as ruleFlag, [appId] as appId, [DBType] as DBType, " \
                    " [DBName] as DBName FROM [dbo][" + lkpTableName + "] WHERE ruleFLag = " + ProcStat + " " \
                    " and appId = " + AppId + " ORDER BY ruleId "

            df = p.read_sql(query, db_con_azure)

            # Closing the connection
            db_con_azure.close()

            return df
        except Exception as e:
            x = str(e)
            print(x)
            df = p.DataFrame()

            return df

    def azure_sqldb_read(self, sql):
        try:
            # Assigning all the required values
            server = self.server
            database = self.database1
            username = self.username
            password = self.password
            driver = self.driver
            env = self.env
            encrypt_flg = self.encrypt_flg
            trust_flg = self.trust_flg
            timout_limit = self.timeout_limit
            lkpTableName = self.lkpTableName
            ProcStat = self.ProcStat
            AppId = self.AppId

            # Creating secure connection
            str_conn = 'Driver=' + driver + ';Server=tcp:' + server + ',1433;' \
                       'Database=' + database + ';Uid=' + username + '@' + env + ';' \
                       'Pwd=' + password + ';Encrypt=' + encrypt_flg + ';' \
                       'TrustServerCertificate=' + trust_flg + ';Connection Timeout=' + timout_limit + ';'

            # print("Connection Details:: ", str_conn)
            db_con_azure = py.connect(str_conn)

            query = sql

            df = p.read_sql(query, db_con_azure)

            # Closing the connection
            db_con_azure.close()

            return df
        except Exception as e:
            x = str(e)
            print(x)
            df = p.DataFrame()

            return df

Major lines to discuss –

azure_sqldb_read(self, sql):

Getting the source SQL supplied from the configuration script.

db_con_azure = py.connect(str_conn)

query = sql

df = p.read_sql(query, db_con_azure)

After creating a successful connection, our application will read the SQL & fetch the data & store that into a pandas dataframe and return the output to the primary calling function.

3. callCosmosAPI.py (This is the main script, which will call all the methods to blend the data. Hence, the name comes into the picture.)

##############################################
#### Written By: SATYAKI DE               ####
#### Written On: 25-May-2019              ####
#### Modified On 02-Jun-2019              ####
####                                      ####
#### Objective: Main calling scripts.     ####
##############################################

import clsColMgmt as cm
import clsCosmosDBDet as cmdb
from clsConfig import clsConfig as cf
import pandas as p
import clsLog as cl
import logging
import datetime
import json
import clsDBLookup as dbcon

# Disbling Warning
def warn(*args, **kwargs):
    pass

import warnings
warnings.warn = warn

def getDate(row):
    try:
        d1 = row['orderDate']
        d1_str = str(d1)
        d1_dt_part, sec = d1_str.split('.')
        dt_part1 = d1_dt_part.replace('T', ' ')

        return dt_part1
    except Exception as e:
        x = str(e)
        print(x)
        dt_part1 = ''

        return dt_part1

# Lookup functions from
# Azure cloud SQL DB

var = datetime.datetime.now().strftime("%Y-%m-%d_%H-%M-%S")

def main():
    try:
        df_ret = p.DataFrame()
        df_ret_2 = p.DataFrame()
        df_ret_2_Mod = p.DataFrame()

        debug_ind = 'Y'

        # Initiating Log Class
        l = cl.clsLog()

        general_log_path = str(cf.config['LOG_PATH'])

        # Enabling Logging Info
        logging.basicConfig(filename=general_log_path + 'consolidated.log', level=logging.INFO)

        # Moving previous day log files to archive directory
        arch_dir = cf.config['ARCH_DIR']
        log_dir = cf.config['LOG_PATH']

        print("Archive Directory:: ", arch_dir)
        print("Log Directory::", log_dir)

        print("*" * 157)
        print("Testing COSMOS DB Connection!")
        print("*" * 157)

        # Checking Cosmos DB Azure
        y = cmdb.clsCosmosDBDet()
        ret_val = y.test_db_con()

        if ret_val == 0:
            print()
            print("Cosmos DB Connection Successful!")
            print("*" * 157)
        else:
            print()
            print("Cosmos DB Connection Failure!")
            print("*" * 157)
            raise Exception

        print("*" * 157)

        # Accessing from Azure SQL DB
        x1 = dbcon.clsDBLookup()
        act_df = x1.azure_sqldb_read(cf.config['AZURE_SQL_1'])

        print("Azure SQL DB::")
        print(act_df)
        print()

        print("-" * 157)

        # Calling the function 1
        print("RealtimeEmail::")

        # Fetching First collection data to dataframe
        print("Fethcing Comos Collection Data!")

        sql_qry_1 = cf.config['SQL_QRY_1']
        msg = "Documents generatd based on unique key"
        collection_flg = 1

        x = cm.clsColMgmt()
        df_ret = x.fetch_data(sql_qry_1, msg, collection_flg)

        l.logr('1.EmailFeedback_' + var + '.csv', debug_ind, df_ret, 'log')
        print('RealtimeEmail Data::')
        print(df_ret)
        print()

        # Checking execution status
        ret_val = int(df_ret.shape[0])

        if ret_val == 0:
            print("Cosmos DB Hans't returned any rows. Please check your queries!")
            print("*" * 157)
        else:
            print("Successfully fetched!")
            print("*" * 157)

        # Calling the 2nd Collection
        print("RealtimeTwitterFeedback::")

        # Fetching First collection data to dataframe
        print("Fethcing Cosmos Collection Data!")

        # Query using parameters
        sql_qry_2 = cf.config['SQL_QRY_2']
        msg_2 = "Documents generated based on RealtimeTwitterFeedback feed!"
        collection_flg = 2

        val = 'crazyGo'
        param_det = [{"name": "@CrVal", "value": val}]
        add_param = 2

        x1 = cm.clsColMgmt()
        df_ret_2 = x1.fetch_data(sql_qry_2, msg_2, collection_flg, add_param, param_det)

        l.logr('2.TwitterFeedback_' + var + '.csv', debug_ind, df_ret, 'log')
        print('Realtime Twitter Data:: ')
        print(df_ret_2)
        print()

        # Checking execution status
        ret_val_2 = int(df_ret_2.shape[0])

        if ret_val_2 == 0:
            print("Cosmos DB hasn't returned any rows. Please check your queries!")
            print("*" * 157)
        else:
            print("Successfuly row feteched!")
            print("*" * 157)

        # Merging NoSQL Data (Cosmos DB) with Relational DB (Azure SQL DB)
        df_Fin_temp = p.merge(df_ret, act_df, on='subscriberId', how='inner')

        df_fin = df_Fin_temp[['orderDate', 'orderNo', 'sender', 'state', 'country', 'customerType']]

        print("Initial Combined Data (From Cosmos & Azure SQL DB) :: ")
        print(df_fin)

        l.logr('3.InitCombine_' + var + '.csv', debug_ind, df_fin, 'log')

        # Transforming the orderDate as per standard format
        df_fin['orderDateM'] = df_fin.apply(lambda row: getDate(row), axis=1)

        # Dropping the old column & renaming the new column to old column
        df_fin.drop(columns=['orderDate'], inplace=True)
        df_fin.rename(columns={'orderDateM': 'orderDate'}, inplace=True)

        print("*" * 157)
        print()
        print("Final Combined & Transformed result:: ")
        print(df_fin)

        l.logr('4.Final_Combine_' + var + '.csv', debug_ind, df_fin, 'log')
        print("*" * 157)

    except ValueError:
        print("No relevant data to proceed!")

    except Exception as e:
        print("Top level Error: args:{0}, message{1}".format(e.args, e.message))

if __name__ == "__main__":
    main()

The key lines from this script –

def getDate(row):
    try:
        d1 = row['orderDate']
        d1_str = str(d1)
        d1_dt_part, sec = d1_str.split('.')
        dt_part1 = d1_dt_part.replace('T', ' ')

        return dt_part1
    except Exception as e:
        x = str(e)
        print(x)
        dt_part1 = ''

        return dt_part1

This function converts NoSQL date data type more familiar format.

NoSQL Date:
NoSQL_Date
Transformed Date:
Transformed Date
# Accessing from Azure SQL DB
x1 = dbcon.clsDBLookup()
act_df = x1.azure_sqldb_read(cf.config['AZURE_SQL_1'])

print("Azure SQL DB::")
print(act_df)
print()

Above lines are calling the Azure SQL DB method to retrieve the RDBMS data into our dataframe.

# Merging NoSQL Data (Cosmos DB) with Relational DB (Azure SQL DB)
df_Fin_temp = p.merge(df_ret, act_df, on='subscriberId', how='inner')

df_fin = df_Fin_temp[['orderDate', 'orderNo', 'sender', 'state', 'country', 'customerType']]

In these above lines, we’re joining the data retrieved from two different kinds of the database to prepare our initial combined dataframe. Also, we’ve picked only the desired column, which will be useful for us.

# Transforming the orderDate as per standard format
df_fin['orderDateM'] = df_fin.apply(lambda row: getDate(row), axis=1)

# Dropping the old column & renaming the new column to old column
df_fin.drop(columns=['orderDate'], inplace=True)
df_fin.rename(columns={'orderDateM': 'orderDate'}, inplace=True)

In the above lines, we’re transforming our date field, as shown above in one of our previous images by calling the getDate method.

Let’s see the directory structure of our program –

Win_Vs_MAC

Let’s see how it looks when it runs –

Windows:

Win_Run_1
Win_Run_2

MAC:

MAC_Run_1
MAC_Run_2

So, finally, we’ve successfully blended the data & make more meaningful data projection.

Following python packages are required to run this application –

pip install azure

pip install azure-cosmos

pip install pandas

pip install requests

pip install pyodbc

This application tested on Python3.7.1 & Python3.7.2 as well. As per Microsoft, their official supported version is Python3.5.

I hope you’ll like this effort.

Wait for the next installment. Till then, Happy Avenging. 😀

[Note: All the sample data are available/prepared in the public domain for research & study.]